
記住我


Pompe disease is a rare glycogen storage disorder caused by a deficiency in the lysosomal enzyme acid α-glucosidase, which leads to muscle weakness, cardiac and respiratory failure, and early mortality. Alglucosidase alfa, a recombinant human acid α-glucosidase, was the first approved treatment of Pompe disease, but its uptake into skeletal muscle via the cation-independent mannose-6-phosphate (M6P) receptor (CIMPR) is limited. Avalglucosidase alfa has received marketing authorization in several countries for infantile-onset and/or late-onset Pompe disease. This recently approved enzyme replacement therapy (ERT) was glycoengineered to maximize CIMPR binding through high-affinity interactions with ∼7 bis-M6P moieties. Recently, small molecules like the glucosylceramide synthase inhibitor miglustat were reported to increase the stability of recombinant human acid α-glucosidase, and it was suggested that an increased serum half-life would result in better glycogen clearance. Here, the effects of miglustat on alglucosidase alfa and avalglucosidase alfa stability, activity, and efficacy in Pompe mice were evaluated. Although miglustat increased the stability of both enzymes in fluorescent protein thermal shift assays and when incubated in neutral pH buffer over time, it reduced their enzymatic activity by ∼50%. Improvement in tissue glycogen clearance and transcriptional dysregulation in Pompe mice correlated with M6P levels but not with miglustat coadministration. These results further substantiate the crucial role of CIMPR binding in lysosomal targeting of ERTs.
SIGNIFICANCE STATEMENT This work describes important new insights into the treatment of Pompe disease using currently approved enzyme replacement therapies (ERTs) coadministered with miglustat. Although miglustat increased the stability of ERTs in vitro, there was no positive impact to glycogen clearance and transcriptional correction in Pompe mice. However, increasing mannose-6-phosphate levels resulted in increased cell uptake in vitro and increased glycogen clearance and transcriptional correction in Pompe mice, further underscoring the crucial role of cation-independent mannose-6-phosphate receptor–mediated lysosomal targeting for ERTs.
IntroductionPompe disease is a rare glycogenosis resulting from deficiency in acid α-glucosidase (GAA), an enzyme necessary to break down glycogen within lysosomes (van der Ploeg and Reuser, 2008). Failure to adequately break down lysosomal glycogen leads to pathologic accumulation within cells, particularly in cardiac and skeletal muscle (van der Ploeg and Reuser, 2008). Patients typically present with muscle weakness, but severity, onset age, and progression rate vary widely. The most severe form is infantile-onset Pompe disease (IOPD), which leads to fatal cardiorespiratory failure in infancy if untreated (van der Ploeg and Reuser, 2008). The slower-progressing late-onset Pompe disease (LOPD) has a wider onset spectrum and course versus IOPD and leads to progressive respiratory decline, motor disability, and reduced life expectancy (van der Ploeg and Reuser, 2008; Güngör et al., 2011).
The only treatment available for Pompe disease is enzyme replacement therapy (ERT), which provides an exogenous source of the deficient GAA enzyme. ERT with alglucosidase alfa (Myozyme, Lumizyme) reduces mortality in IOPD (Kishnani et al., 2007; Nicolino et al., 2009) and improves or stabilizes respiratory and motor function in LOPD (van der Ploeg et al., 2010). However, a significant unmet need exists for treatment of patients who improve initially with alglucosidase alfa but demonstrate respiratory and motor decline after 3–5 years (Chien et al., 2015; Parini et al., 2018; Hahn and Schänzer, 2019; Harlaar et al., 2019; Schänzer et al., 2019). This suboptimal response has been at least partially attributed to poor cell uptake and lysosomal targeting in skeletal muscles. Lysosomal enzymes are targeted to the lysosome by the cation-independent mannose-6-phosphate (M6P) receptor (CIMPR). The CIMPR binds to M6P moieties on alglucosidase alfa, leading to endocytosis and trafficking to lysosomes. Alglucosidase alfa has ∼1 mol/mol M6P, and only a small percentage of this is present as bis-M6P, to which the CIMPR has a much higher affinity (Ghosh et al., 2003; Zhu et al., 2009; Togawa et al., 2014). The low levels of high-affinity ligand for the CIMPR likely play a significant role in poor uptake into skeletal muscle. Increasing lysosomal targeting in skeletal muscle has been shown to result in better glycogen clearance and clinical improvement (Zhou et al., 2013; Pena et al., 2019; Diaz-Manera et al., 2021; Dimachkie et al., 2022).
Two different approaches to increase cell uptake of an ERT have been clinically investigated. The first was a glycoengineering approach to design an enzyme with increased binding and affinity for the CIMPR. The resulting molecule, avalglucosidase alfa (Nexviazyme, Nexviadyme), is manufactured by chemically conjugating ∼7 bis-M6P glycans to alglucosidase alfa (Zhu et al., 2009; Zhou et al., 2013). Avalglucosidase alfa has ∼15-fold more M6P versus alglucosidase alfa, resulting in greater receptor affinity, ∼20-fold greater cell uptake, and ∼5-fold increased potency in reducing glycogen in Pompe mice (Zhu et al., 2009). Avalglucosidase alfa has been shown to confer greater clinical benefit versus alglucosidase alfa, including meaningful improvements in respiratory function and the 6-minute walk test (6MWT) (Pena et al., 2019; Diaz-Manera et al., 2021).
The second approach was to increase target tissue exposure by increasing stability of the enzyme in circulation. This approach uses small-molecule chaperones that preferentially bind correctly folded proteins, stabilizing them against misfolding (Andreotti et al., 2015; Parenti et al., 2015). Several studies have investigated GAA chaperones in Pompe disease either as monotherapy, attempting to improve missense variant GAA enzyme function, or in combination with recombinant GAA to increase ERT half-life (Parenti et al., 2007, 2014; Porto et al., 2009, 2012). Miglustat (AT2221), an inhibitor of glucosylceramide synthase, has been suggested to have beneficial effects in Pompe mice when coadministered with an investigational ERT, cipaglucosidase alfa (ATB200) (Xu et al., 2019). ATB200 has reportedly higher levels of M6P than alglucosidase alfa but significantly lower levels than avalglucosidase alfa (Xu et al., 2019). A phase 3 study evaluating coadministration of miglustat and ATB200 versus alglucosidase alfa failed to meet its primary endpoint of superiority over alglucosidase alfa (Schoser et al., 2021). Patients treated with ATB200 and miglustat showed a greater 6MWT increase versus alglucosidase alfa, which was not statistically significant, and less decline in forced vital capacity. ATB200 has not been evaluated as a monotherapy in patients; therefore, potential individual contributions of the higher levels of M6P on the enzyme and its stabilization by miglustat are undetermined. Importantly, miglustat’s ability to stabilize approved ERTs and potentially enhance their pharmacodynamic effect is untested. This study investigates the impact of differential enzymatic M6P content versus chaperone activity on ERT function in vitro and in vivo.
Materials and MethodsDifferentially Conjugated Avalglucosidase Alfa SamplesAlglucosidase alfa samples were diluted in 100 mM sodium acetate (pH 5.6) to a final concentration of 5 mg/ml. The diluted samples were oxidized with 2 mM sodium metaperiodate for 30 minutes at 8°C. Excess sodium metaperiodate was consumed by the addition of 50% glycerol (1.5% final concentration) incubated for 30 minutes at 8°C while stirring. Reactants were removed through ultrafiltration/diafiltration into 100 mM sodium acetate buffer (pH 5.6) until a final protein concentration of 9.2 mg/ml was reached. The oxidized protein was split into different portions, and each portion was incubated with the synthetic bis-M6P-tetra-mannose glycan at different glycan/protein excess molar ratios (20 mg glycan/ml buffer) for >7 days at 8°C while protected from light. The conjugation reaction was stopped upon removal of free residual glycan and buffer exchange of the samples into 10 mM histidine buffer (pH 6.9). The glycan–protein ratio (mol/mol) was measured using size exclusion high-performance liquid chromatography (HPLC) (Bio SEC-3 column, Agilent; DAD detector 280 nm, isocratic gradient 37.5 mM sodium phosphate dibasic, 150 mM sodium chloride, pH 6.2). The ratios were obtained upon extrapolation of the retention time of the differential conjugated sample toward the retention time curve based on in-house prepared differently conjugated standards. Next to this, the differential conjugated samples were characterized for molecule mass by MALDI-TOF and total M6P content using the fluorescent label 4-aminobenzoic acid ethyl ester and reversed-phase-HPLC (Luna C18 column; Phenomenex).
Relative Potency of the Differentially Conjugated Avalglucosidase Alfa in Human Pompe FibroblastsSV40 transformed fibroblasts from a male IOPD patient with reportedly 0.21% residual GAA activity (Coriell Cell Repositories) were maintained in 5% CO2 at 37°C. In general, the cells were plated onto 96-well culture dishes at 2 × 10⁴ cells per well in growth medium [minimum essential medium (MEM) with 10% gamma-irradiated fetal bovine serum (FBS), 24 mM HEPES, and 1% L-glutamine] and allowed to settle for 16–20 hours.
The unconjugated (alglucosidase alfa) material, the differentially conjugated avalglucosidase alfa samples, and the fully conjugated avalglucosidase alfa reference material (10 μg/ml each) in uptake medium [MEM, 3% bovine serum albumin (BSA), 10% gamma-irradiated FBS, 34 mM HEPES, and 1% L-glutamine] were added in triplicate in column 2 of a 96-well sample plate. Samples and reference were diluted using a 2.5 × serial dilution starting in column 3 to column 12 onwards of the 96-well plate upon transfer of 100 μl of the sample/reference (e.g., column 2) into 150 μl of the uptake medium in the following column (e.g., column 3) followed by rigorous up and down mixing. Each sample plate contained only one sample and the reference material. After cell settlement, the liquid of the cell plate was discarded by inversion and 130 μl of each sample/reference dilution from the sample plate was transferred to the corresponding well of the cell plate. Cells were incubated in the presence of the samples for 4 hours at 37°C. After incubation, cells were washed three times with phosphate-buffered saline (PBS) and incubated with mammalian protein extraction reagent (MPER; Pierce) for 10 minutes, and lysates were homogenized by up and down pipetting and stored overnight at ≤50°C before performing the 4-methylumbelliferone (4MU) assay. After thawing, cell plates were centrifuged at 1865 g for 10 minutes at 6 ± 2°C. Sixty microliters of each cell lysate was transferred to a corresponding well in a separate 96-well assay plate to start the enzymatic activity 4MU assay. The assay started with the addition of 7.7 mM 4MU substrate to each well. Assay plates were incubated at 37°C for 60 minutes while protected from light. At the end of the incubation period, the plate was removed from the incubator and allowed to cool down and 180 μl stop solution (1M glycine, pH 12.50) was added to each well. The fluorescent signal was measured at 460 nm (excitation occurred at 355 nm) using a Gemini fluorescent microplate reader and SoftMax Pro software. The dose-response curves for the reference material and test samples were fitted to a four-parameter logistic model, and the curves for samples and reference were tested for parallelism using an equivalence testing. EC50 values were calculated for samples and reference standard. The relative cellular uptake of the samples was determined as the ratio of the EC50 of the assay standard divided by the EC50 of the sample.
Intracellular Processing of Alglucosidase Alfa and Avalglucosidase AlfaHuman Pompe fibroblast cells (Coriell Cell Repositories), deficient in GAA production, were maintained in 5% CO2 at 37°C. The cells were plated onto 6-well culture dishes at 1 × 10⁶ cells per well in growth medium (MEM, 10% FBS, 24 mM HEPES, and 1% glutamine) and allowed to settle for 16–24 hours. Alglucosidase alfa (50 nM) and avalglucosidase alfa (10 or 50 nM) in uptake media (Ham’s F12, 10% FBS) were added in separate wells and incubated at 37°C for 24, 30, and 48 hours. After incubation, the cells were washed three times with PBS, scraped, and centrifuged at 14,400 g. Cell pellets were frozen at ≤−15°C. The cells were lysed with MPER (Pierce) and centrifuged at 18,000 g. Protein content in the cell lysate was determined using the BCA kit (Pierce) with BSA as a standard. Lysates were incubated with 0.7% PNGase F (Sanofi) and 1× reducing agent (Invitrogen) at 37°C for 20 hours. For western blotting of cell lysates, 1 μg of protein was loaded per lane, and for unprocessed alglucosidase alfa and avalglucosidase alfa, 10 ng was loaded per lane. Polyvinylidene fluoride (PVDF) transfers were probed with a 1:1504 dilution of mouse anti-GAA specific monoclonal antibody (Sanofi) and a 1:3200 dilution of rabbit anti-actin antibody (Bethyl Laboratories) followed by 1:20,000 dilution of IRDye-labeled goat anti-mouse and goat anti-rabbit secondary antibody (LI-COR). Detection was carried out with an infrared dye (LI-COR) using the LI-COR Odyssey system visualizing two separate proteins, GAA and actin (internal reference protein), simultaneously.
Molecular ModelingMolecular modeling by docking miglustat into the GAA active site based on published structures [see 5NN3 in the Protein Data Bank, http://rcsb.org/structure/5NN3, and Roig-Zamboni et al. (2017)] was performed using Molecular Operating Environment (MOE) software. GAA protein structures from the Protein Data Bank (PDB) were first prepared by running QuickPrep to set up protonation states and hydrogen-bonding network interactions. The protonation state of miglustat was enumerated, and docked miglustat indicated that the miglustat interaction with GAA was similar to that of miglitol, where the iminosugar head moiety deoxynojirimycin maintains identical key hydrogen-bonding interactions with Asp404, Asp518, and His674 of recombinant human acid α-glucosidase (rhGAA). The hydrogen-bonding interaction between Trp481 indole NH and miglitol hydroxyl group was absent with miglustat as well as other rhGAA structures.
Ex Vivo Fluorescent Protein Thermal Shift AssayThe effect of miglustat on the thermal stability of alglucosidase alfa and avalglucosidase alfa was assessed using the fluorescent protein thermal shift (PTS) assay developed by Applied Biosystems (Foster City, CA). The proteins were evaluated in buffers at pH 7.4 (50 mM sodium phosphate, 150 mM sodium chloride, pH 7.4) or pH 5.2 (50 mM sodium acetate, 150 mM sodium chloride, pH 5.2). Protein (1.2 mg/ml) was mixed with miglustat, or as a control the ceramide analog eliglustat, which is not expected to bind to α-glucosidase, at 10, 30, 100 μM, or buffer alone. The PTS dye was diluted 1:50 in distilled water to make a working stock and then diluted 1:10 into the final protein mixture. Samples (20 μl) were loaded in triplicate into the wells of a 96-well microamp reaction plate (Applied Biosystems). Protein melting curves were generated by running the reactions on a Quant Studio 7 Flex qPCR instrument (Applied Biosystems) in continuous ramp mode using a temperature gradient from 25°C to 95°C at a rate of 0.05°C/s.
Protein denaturation was detected by measuring incorporation of the fluorescent PTS dye. Fluorescence intensity was plotted against temperature, and linear regression curves for each well were generated using the proprietary Protein Thermal Shift Software V1.3 (Applied Biosystems). Melting temperature (Tm) values were calculated using a Boltzmann fit of the sigmoidal curves.
Ex Vivo GAA Stability and Enzymatic Activity AssaysFor the stability time course in PBS (pH 7.4), alglucosidase alfa and avalglucosidase alfa were diluted to a final concentration of 3 μM with or without miglustat (N-butyldeoxynojirimycin; Sigma) at a final concentration of 17 or 170 μM and added to PBS. GAA activity was measured immediately and after a 2-, 4-, 6-, 8-, and 24-hour incubation at 37°C.
For the GAA activity assay, all alglucosidase alfa and avalglucosidase alfa samples were diluted to 1 μg/ml enzyme in buffer (100 mM sodium acetate, 100 mM NaCl, 1.0 mg/ml BSA, 0.02% Triton, and 0.02% sodium azide, pH 4.8). Twenty-five microliters of the diluted sample in buffer was then incubated with 50 μl 1 mM 4-methylumbelliferyl α-D-glucopyranoside in substrate buffer (100 nM sodium acetate, 0.02% sodium azide, pH 4.8) at 37°C for 30 minutes while protected from light. The reaction was then stopped by adding 125 μl 1 M glycine, pH 10.5. Fluorescence was measured on a PHERAstar FS plate reader with an excitation wavelength of 350 nm and an emission wavelength of 450 nm. GAA activity was calculated using GraphPad Prism in two ways: first by normalizing samples to their own respective baseline levels (activity at time zero) and using that to calculate the percentage of remaining GAA activity, and second by simply plotting the raw values of the 4MU fluorescence.
Animal StudiesAll animal studies were performed in Pompe mice that contain a neomycin resistance cassette inserted into exon 6 of both alleles of the Gaa gene (6neo/6neo), resulting in a disruption of the coding region (Raben et al., 1998). These animals lack GAA activity and accumulate glycogen in a manner similar to human disease.
Pharmacodynamic studies were performed at Sanofi (Framingham, MA). and pharmacokinetics and biodistribution studies were performed at Charles River Laboratories (Worcester, MA). All studies were performed with male and female animals aged 3–6 months. All studies were performed in accordance with internal Institutional Animal Care and Use Committee (IACUC) guidelines and local regulatory bodies.
In all of the pharmacodynamic (glycogen) studies, animals were administered weekly doses for 4 weeks via the lateral tail vein. Diphenhydramine was administered intraperitoneally at doses 2–4 within 10–20 minutes prior to administration of ERTs to minimize hypersensitivity reactions. A second dose was administered if animals displayed any signs of hypersensitivity. Animals were euthanized by CO2 asphyxiation 7 days after the last dose and perfused with PBS, and tissues were collected and stored at −80°C for biochemical glycogen analysis.
In the pharmacokinetic and biodistribution studies, GAAKO mice were administered 20 mg/kg alglucosidase alfa or avalglucosidase alfa by injection in the lateral tail vein. Blood was collected at 5, 15, and 30 minutes and 1, 2, and 4 hours postdose, processed for serum, and stored at −80°C until enzyme concentration analysis. In the biodistribution study, animals were perfused with PBS after euthanasia and tissues were collected 1, 6, and 24 hours postdose and stored at −80°C for enzyme concentration analysis. For cohorts in which miglustat was coadministered, animals were administered 10 mg/kg miglustat by oral gavage 30 minutes prior to enzyme administration.
Enzyme Serum and Tissue Concentration AnalysesStandard intermediates of alglucosidase alfa or avalglucosidase alfa were prepared in formulation buffer (alglucosidase alfa: 2% mannitol, 0.05% Tween 80 in 25 mM sodium phosphate, pH 6.2; avalglucosidase alfa: 2% glycine, 2% mannitol, 10 mM histidine, 0.01% Tween 80, pH 6.2) at nominal concentrations of 500 ng/ml, subsampled, and stored frozen at ≤−60°C. Each day, an aliquot of the standard intermediate was thawed, and standards were prepared in working dilution buffer (WDB: 0.2 M sodium acetate, 0.4 M KCl with 0.01% BSA, pH 3.9) to target concentrations of 250, 125, 62.5, 31.25, 15.625, 7.813, 3.906, and 0 ng/ml. Samples analyzed for alglucosidase alfa were quantitated using the standard curve prepared from alglucosidase alfa. Samples analyzed for avalglucosidase alfa were quantitated using the standard curve prepared from avalglucosidase alfa.
Quality controls (QCs) for the assay were prepared by spiking alglucosidase alfa or avalglucosidase alfa at concentrations of 500 and 40 ng/ml in their respective formulation buffer. Assay QCs were subsampled after preparation and stored frozen at ≤−60°C. Aliquots of QCs were thawed on each day of use and diluted 1:4 in WDB prior to plating. Samples analyzed for alglucosidase alfa were assayed with QCs prepared from alglucosidase alfa. Samples analyzed for avalglucosidase alfa were assayed with QCs prepared from avalglucosidase alfa.
Frozen tissue specimens were weighed (mg tissue) and placed in Precellys 24 ceramic bead (1.4 mm) grinding tubes (Bertin Technologies). A volume of cold, deionized water (DiH2O, in μl) equivalent to 10 times the tissue weight (mg) was added to each tube. Tissue specimens were homogenized using a Precellys 24 homogenizer (Bertin Technologies). Homogenates were then centrifuged at 13,000 rpm for 15 minutes and stored at ≤−60°C until analysis.
In this method, a fluorometric enzyme activity assay used 4MU α-D-glucopyranoside as a substrate. Serum and tissue homogenate specimens, standards, and QCs were incubated with the substrate in the dark for 2 hours at 37 ± 2°C with shaking. In the presence of rhGAAs, 4MU was liberated from the substrate in direct proportion to the amount of enzyme present in the specimen. After the 2-hour incubation, the reaction was stopped with cold 0.5 M carbonate-bicarbonate buffer at pH 10.65. The resulting fluorescence was measured using a SpectraMax plate reader (Molecular Devices) set at a 360-nm excitation and a 450-nm emission with a 435-nm cutoff.
Serum and tissue homogenate specimens were diluted in WDB prior to analysis. Initial dilution of the specimen was no less than the predetermined minimum required dilution (Supplemental Table 1).
All serum and tissue homogenate specimens were analyzed in duplicate with an appropriate specimen blank comprised of treatment-naïve GAAKO mouse serum or tissue homogenate. The applicable standard curve and QCs were tested on each assay plate.
Raw data were acquired using SoftMax Pro (Molecular Devices). Data regression was performed using Watson LIMS (Thermo Fisher). The raw data values (OD) were plotted against nominal concentrations to form a standard curve. The 0-ng/ml standard point was not used in the regression of the standard curve. An unweighted, four-parameter logistic Marquardt regression was computer fit by Watson LIMS, and concentrations of alglucosidase alfa or avalglucosidase alfa in QCs and specimens were determined by interpolation from the standard curve. For QCs and specimens, the interpolated result was multiplied by the appropriate dilution factor. Specimens with results less than the lower limit of quantification (LLOQ) were reported as <LLOQ.
Assay performance was maintained throughout testing of specimens by evaluating the accuracy (% bias) and precision (% CV) of both the standard values and the interpolated concentrations of the QCs. Predetermined assay acceptance criteria were met for test results to be considered valid.
Tissue Glycogen AssaysTissue samples were homogenized using a Fisherbrand Bead Mill 24 at 4°C in deionized DNase/RNase-free water in a volume of 10 times the weight (ml/mg) of the sample with the following homogenizer settings: speed 5.65, time 30 seconds, pause for 1 minute, two cycles. After homogenization, samples were centrifuged at 16,000 g at 4°C for 10 minutes. After centrifugation, the lysate supernatant was split into two separate aliquots and frozen at −80°C.
Lysates were then heat denatured in boiling water (100°C) for 10 minutes and centrifuged at 16,000 g at 4°C for 10 minutes, and the supernatant was transferred to fresh tubes. Glycogen content was measured colorimetrically using a BioVision Glycogen Assay Kit. Tissue lysates were diluted anywhere from 1:2 to 1:60 in deionized DNase/RNase-free water, depending on the tissue type and treatment, to fall within the range of the standard curve of the assay. In the first step of this assay, samples were incubated with and without glucoamylase to measure the amount of glucose released. Background levels of glucose for all samples were measured without the addition of glucoamylase. After a 30-minute incubation at room temperature, the glucose was then specifically oxidized to produce a product that reacts with an OxiRed probe to generate color (OD 570 nm). During this second step, samples were incubated for 30 minutes at room temperature while protected from light. Absorbance at 570 nm was measured on a PHERAstar FS plate reader. Glycogen values were determined by subtracting the background glucose from the glucose content of samples treated with glucoamylase. The glycogen content was then quantitated based on a glycogen standard curve (ranging from 0 to 1400 ng) and normalized to tissue content (and protein content if including figures showing values normalized to protein). Protein levels were measured in lysates (after heat denaturation) using a Coomassie Plus (Bradford) Assay Kit (Thermo Scientific) according to the manufacturer’s instructions. Absorbance at 595 nm was measured on a PHERAstar FS plate reader. The protein concentration was then quantitated based on a BSA protein standard curve (ranging from 0 to 600 μg).
Transcriptional ProfilingRNA Extraction, Library Construction, and SequencingEach quadriceps sample was lysed and homogenized in Qiazol Reagent (Invitrogen, Carlsbad, CA) using a Precellys bead beater according to the manufacturer’s instructions. The RNA was cleaned up using Qiagen RNeasy Mini kit with on-column DNase I treatment; Appendix D (Cat# 74104; QIAGEN Sciences, Germantown, MD). The integrity of the RNA was determined using a Bioanalyzer Total RNA Nano chip on the Bioanalyzer 2100 (Cat# 5067-1511; Agilent Technologies, Santa Clara, CA). The quantity was determined using the NanoDrop 8000 Spectrophotometer (Thermo Fisher, Waltham, MA). The RNA samples were shipped to GENEWIZ (South Plainfield, NJ) on dry ice for library construction and sequencing. GENEWIZ confirmed the RNA quantity and integrity using the TapeStation RNA ScreenTape assay (Agilent). Strand-specific RNA-seq libraries were created using the NEBNext Ultra II Directional RNA Library Prep Kit for Illumina (NEB # E7760S; New England Biolabs, Inc., Ipswich, MA). The libraries were sequenced using the HiSeq 4000 (Illumina).
Data Processing and Quality ControlAll data preprocessing and QC were performed within Array Studio (Version 10; OmicSoft Corporation, Research Triangle Park, NC). The average sequencing depth for the quad samples was 69 × 106 reads. Data quality was assessed using the “Raw Data QC Wizard” function within Array Studio. The sequence used to trim the adapters from the reads was “AGATCGGAAGAGC.” The paired reads (150 base pairs) were mapped to the reference genome using the OmicSoft Aligner 4 (OSA4) (Hu et al., 2012). The reference genome used during alignment was Mouse.B38; the gene model was GenCode.V19. The expectation-maximization (EM) algorithm was implemented to calculate both counts and fragments per kilobase million (FPKM) value for each gene (Dempster et al., 1977; Li et al., 2010). Only protein coding genes were included for downstream analysis. Genes that did not meet a count cutoff of <15 in at least three samples per group were considered lowly expressed genes and filtered out. Poor quality reads were filtered out using a Q score cutoff of 20. Next, the samples were normalized to the 75th quantile followed by a log2 transformation (Log2[FPKM+1]).
Data AnalysisDisease signature: Student’s t test (Student, 1908) was performed to identify differentially expressed genes between age-matched C57BL6 wild-type mice and vehicle-treated Pompe mice. The Benjamini–Hochberg method was used to adjust the P value for multiple hypothesis testing (Benjamini and Hochberg, 1995). Genes were considered significantly altered if the absolute fold change in expression was >2.0 and adjusted P < 0.05.
Treatment signatures: one-way analysis of variance (ANOVA) (Fisher, 1919) test followed by a Holm’s post hoc test (Holm, 1979) was employed to determine if a gene was differentially expressed between the treatment groups. Genes were considered significantly altered if the absolute fold change in expression was >1.2 and adjusted P value < 0.05.
Gene set enrichment analysis (GSEA, version 4.1.0) (Mootha et al., 2003; Subramanian et al., 2005) of the individual treatment signatures was run against the top 100 most significant genes from the disease signature. Normalized enrichment scores (NES) for each treatment were plotted against the average glycogen levels.
Gene set variation analysis (GSVA, version 1.40.1) (Hänzelmann et al., 2013) was conducted using the MSigDB murine C5 ontology (Mm.c5.all.v7.1.entrez.rds) gene set collection (Li et al., 2010; Liberzon et al., 2011). Individual enrichment scores were generated for each mouse for all gene sets within those collections. Gene lists for the selected pathways are listed (Supplemental Gene Lists). Student’s t test was used to identify gene sets with significantly different (P < 0.05) GSVA enrichment scores in wild-type mice compared with vehicle-treated GAAKO mice.
Statistical AnalysisTo check if increasing the number of high-affinity glycans on rhGAA could result in increased potency, we performed one-way ANOVA followed by a Bonferroni post hoc comparison test for each tissue.
To assess the biodistribution of alglucosidase alfa and avalglucosidase alfa with and without miglustat administration for each tissue, we constructed a general linear model that included the main effects for treatment, time, and sex, with all two-factor and three-factor interaction effects between main effects. We evaluated the differences between treatment groups by the least squares (LS) means method. To control multiple comparisons, a Bonferroni–Holm adjustment was used. There are 18 values <LLOQ in the groups of “rhGAA + water” and “rhGAA + miglustat” from the triceps. We imputed these values by random numbers generated from the uniform distribution, with the minimum as zero and maximum as LLOQ. Studentized residual plots were used to check normality and homogeneity assumptions.
To assess if miglustat has an effect on glycogen clearance when coadministered with alglucosidase alfa or avalglucosidase alfa for each tissue, we first fitted data using a two-way ANOVA model to evaluate the effects of coadministration and treatment (coTrt) and sex, and their interaction effect on glycogen level, where coTrt is the combination of coadministration and treatment. Since there was no significant interaction effect but there was significant coTrt effect, we evaluated the effect of ERT treatment of each coadministration based on LS means. We also evaluated the effect of coadministration for each ERT treatment based on LS means. Furthermore, we performed Dunnett’s test to compare the vehicle/vehicle group to all other seven combinations of coadministration and treatment. Studentized residual plots were used to check normality and homogeneity assumptions. In case of heteroscedasticity, appropriate corrected models were used.
The significance level was taken to 5% except for the interaction test, for which the significance level was taken to 10%. Statistical software GraphPad Prism (version 5.0), R (version 4.0.2), and SAS (version 9.4) were used.
ResultsIncreasing the Number of High-Affinity Glycans on rhGAA Results in Increased Glycogen ClearanceAvalglucosidase alfa is produced by the chemical conjugation of a glycan bearing two terminal M6Ps to oxidized sialic acid. The structure of this glycan (Fig. 1A) and its chemical conjugation was extensively optimized to generate a molecule with maximal conjugation to a glycan with the highest affinity for the CIMPR (Zhu et al., 2009; Zhou et al., 2013). To determine the influence of the number of bis-M6P glycans conjugated to rhGAA on the potency of the enzyme, cellular uptake in vitro and glycogen clearance in vivo were evaluated with rhGAAs with increasing numbers of glycans. The increase in glycan conjugation level correlated with an increase in cell uptake, with the effect plateauing when more than 3–5 moles of glycan are conjugated per mole of avalglucosidase alfa (Fig. 1B). This increase in cell uptake in vitro is associated with increased lysosomal targeting in a glycan-dependent manner in vivo as measured by glycogen reduction in Pompe mice. Pompe mice contain a neomycin resistance cassette inserted into exon 6 of both alleles of the Gaa gene (6neo/6neo), resulting in a disruption of the coding region (Raben et al., 1998). These animals lack GAA activity and accumulate glycogen in a manner similar to human disease. For this study, glycogen clearance after treatment with 20 mg/kg alglucosidase alfa conjugated with increasing levels of glycan was compared with treatment with 100 mg/kg alglucosidase alfa. A 5-fold higher dose of alglucosidase alfa was used as a comparator because avalglucosidase alfa (which contains ∼7 conjugated glycans per molecule of rhGAA) had been previously shown to be ∼5-fold more potent at clearing glycogen in Pompe mice (Zhu et al., 2009). Pompe mice were administered injections weekly for 4 weeks, and tissues were collected 7 days after the last dose. Alglucosidase alfa conjugated with 2, 4, or 7 glycans on average were tested. Glycogen levels after treatment with 100 mg/kg alglucosidase alfa were similar to historical controls (Zhu et al., 2009) and unpublished data. Increasing the number of bis-M6P glycans conjugated to GAA resulted in increasing glycogen clearance across all muscles assayed to varying degrees. Maximal clearance was observed in the triceps and psoas at 4–7 glycans (8–14 additional M6P/mole rhGAA), suggesting that CIMPR binding using this regimen may already be saturated in these muscles (Fig. 1C). A clear glycan-dependent response was observed in the quadriceps, but glycogen levels in the diaphragm were highly variable across all cohorts. Importantly, the addition of synthetic glycans to alglucosidase alfa did not affect proteolytic processing of the enzyme (Supplemental Fig. 1). These data demonstrate that a dose-dependent increase in CIMPR-mediated cell uptake results in increased pharmacodynamic effect in vivo.
 Fig. 1.
 Higher glycan conjugation results in increased cell uptake and glycogen clearance. (A) The synthetic bis-mannose-6-phosphate-tetra-mannose glycan that is chemically conjugated to alglucosidase alfa (rhGAA) to create avalglucosidase alfa. (B) Pompe fibroblasts were incubated for 4 hours with alglucosidase alfa with increasing amounts of conjugated glycan and the intracellular activity measured. Error bars represent the calculated S.D. based on an intermediate assay precision of 12%. Each line represents a different experiment. (C) Pompe mice were administered 100 mg/kg alglucosidase alfa (algl) or 20 mg/kg alglucosidase alfa conjugated with increasing levels of glycan. N = 12 (6 males/6 females) per group, mean ± S.D. is shown. *P < 0.05 compared with alglucosidase alfa using one-way ANOVA followed by a Bonferroni post hoc comparison test.
Miglustat Stabilizes GAA but Also Inhibits GAA ActivityMiglustat (N-butyldeoxynojirimycin, NB-DNJ) is a synthetic iminosugar that structurally resembles the terminal glucose residue of glycogen. It is also a known inhibitor of α-glucosidases I and II through a mechanism proposed to be a transition state mimic binding at the active site (Butters et al., 2000). Miglitol (NHE-DNJ), a close analog of miglustat, has been shown to bind at the active site of GAA, thus inhibiting the target enzyme (Bruckmann et al., 2012; Roig-Zamboni et al., 2017). Given the structural similarity between miglustat and miglitol, miglustat is likely to bind in a similar way at the same site on GAA (Roig-Zamboni et al., 2017).
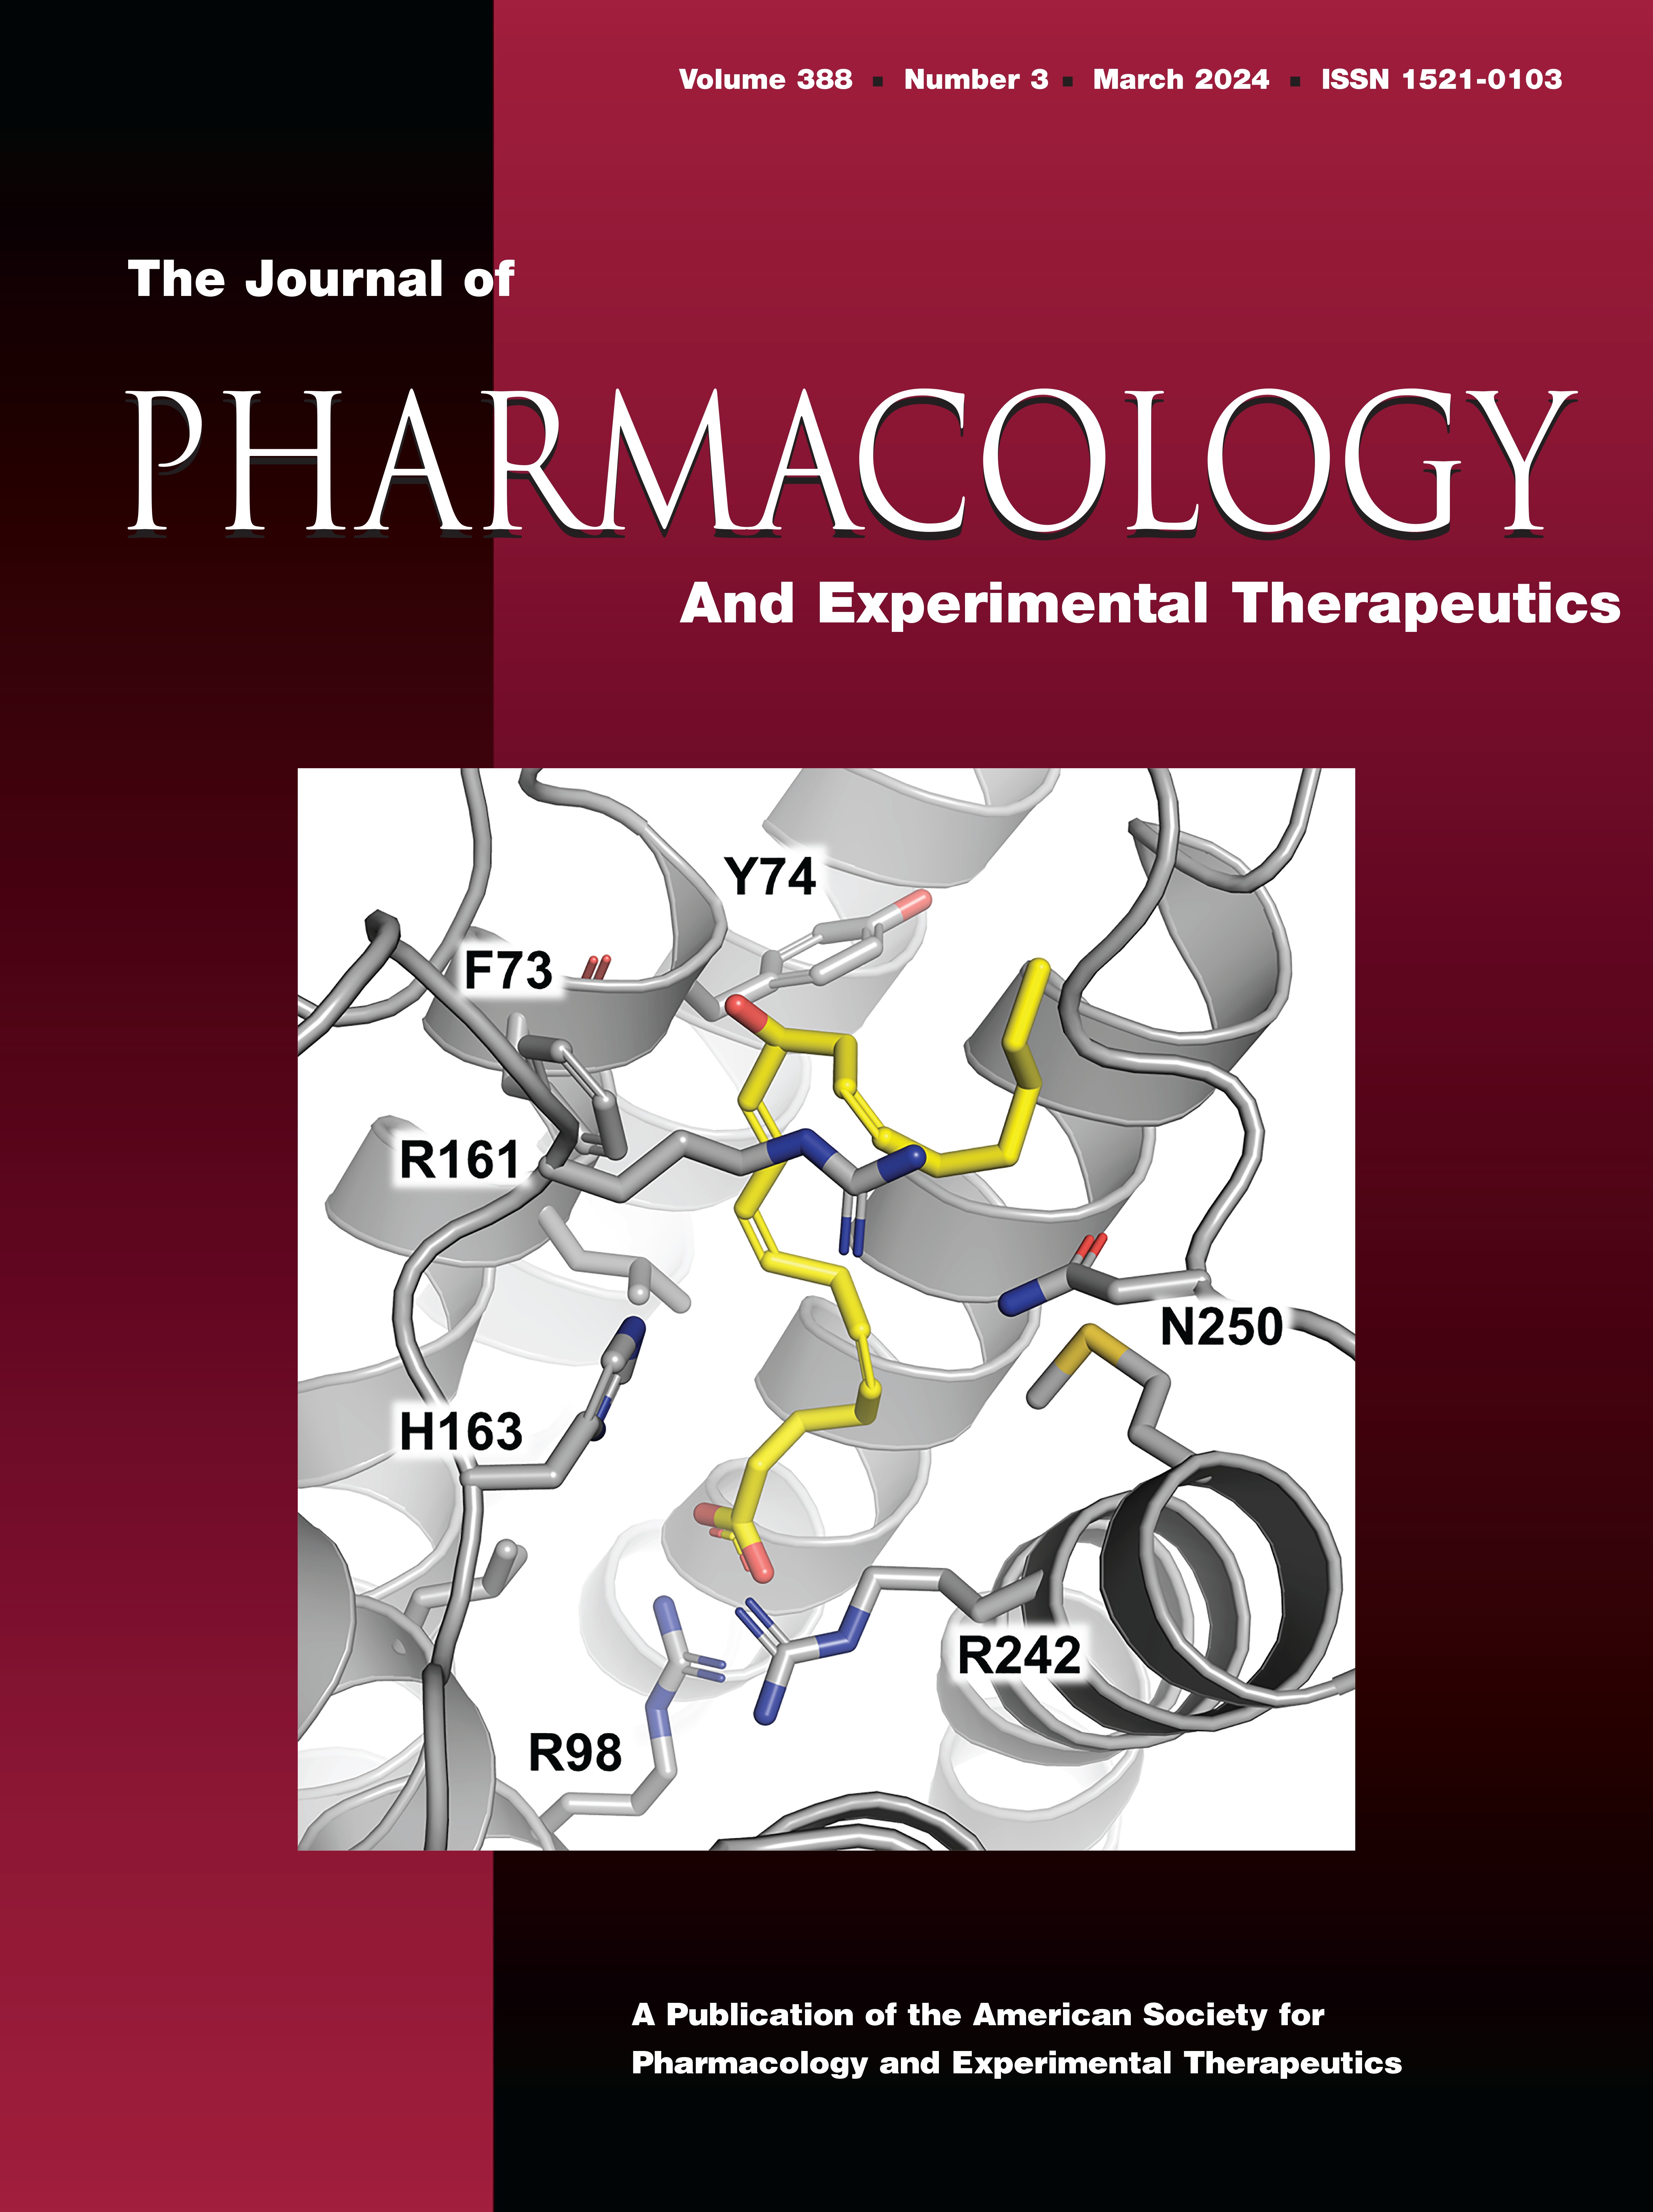
To gain insight into how miglustat binds to GAA, molecular modeling, by docking miglustat into the GAA active site based on published structures, was performed using MOE software. GAA protein structures from the PDB were first prepared by running QuickPrep to set up protonation states and hydrogen-bonding network interactions. The protonation state of miglustat was enumerated, and docked miglustat indicated that the miglustat interaction with GAA was similar to that of miglitol (Fig. 2), where the iminosugar head moiety deoxynojirimycin maintains identical key hydrogen-bonding interactions with Asp404, Asp518, and His674 of rhGAA. The hydrogen-bonding interaction between Trp481 indole NH and miglitol hydroxyl group was absent with miglustat. Our modeling exercise suggests that miglustat binds well at the active site of GAA. Such binding of miglustat at the active site may stabilize the protein but may also inhibit GAA enzymatic function.
 Fig. 2.
 In silico modeling of miglustat binding to the active site of GAA. Molecular modeling shows that miglustat (orange) interacts with GAA (PDB code: 5NN3) in a manner similar to miglitol [green (Bruckmann et al., 2012)], where the iminosugar head moiety deoxynojirimycin maintains identical key hydrogen-bonding interactions with Asp404, Asp518, and His674 of rhGAA.
To assess the effect of miglustat binding on the stability of rhGAAs (either alglucosidase alfa or avalglucosidase alfa), protein stability in the presence or absence of miglustat was measured in vitro using the fluorescent PTS assay (Fig. 3). In this assay, both alglucosidase alfa and avalglucosidase alfa are more stable at pH 5.2 [melting temperature (Tm) = 67.2°C and 67.9°C, respectively], the pH of the lysosome, than at pH 7.4 (Tm = 49.5°C and 48.4°C, respectively). Coincubation of either alglucosidase alfa or avalglucosidase alfa with an increasing concentration of miglustat resulted in concentration-dependent stabilization of each enzyme (Fig. 3). Additionally, incubation of alglucosidase alfa or avalglucosidase alfa in a neutral pH buffer (PBS, pH 7.4) resulted in a time-dependent loss of enzymatic activity over a 24-hour period (Fig. 4). In contrast to recently published data on cipaglucosidase alfa in which significant stability was lost after a 2-hour incubation in buffer (Xu et al., 2019), alglucosidase alfa and avalglucosidase alfa were relatively stable for at least 8 hours without miglustat, with a loss of only 12% and 21% of their activity, respectively. By 24 hours, alglucosidase alfa and avalglucosidase alfa activity had decreased by 36.0% and 47.5%, respectively. Interestingly, although both avalglucosidase alfa and alglucosidase alfa were stabilized in the presence of either 17 or 170 μM miglustat at 24 hours, the addition of miglustat resulted in a significant reduction of GAA activity overall (Fig. 4B). These activity assays were performed at pH 4.8, a pH at which miglustat is expected to dissociate from the enzyme, which may reflect the weak inhibitory activity observed (Wang et al., 2014).
 Fig. 3.
 Miglustat binding increases the stability of rhGAA [either alglucosidase alfa (algl) or avalglucosidase alfa (aval)] in vitro using the fluorescent protein thermal shift (PTS) assay. In this assay, both alglucosidase alfa and avalglucosidase alfa are less stable at pH 7.4 (melting temperature [Tm] = 49.5 and 48.4°C, respectively) than at pH 5.2 (Tm = 67.2 and 67.9°C, respectively), which resembles the pH of the lysosome. Coincubation of either alglucosidase alfa or avalglucosidase alfa with increasing doses of miglustat results in a concentration-dependent stabilization of either enzyme.
 Fig. 4.
 Incubation of alglucosidase alfa (algl) or avalglucosidase alfa (aval) in a neutral pH buffer (PBS, pH 7.4) results in a time-dependent denaturation of GAA over a 24-hour period. Alglucosidase alfa and avalglucosidase alfa are stable for at least 8 hours without miglustat (mig), with a loss of 12% and 21% of their activity, respectively, by 8 hours. By 24 hours, alglucosidase alfa and avalglucosidase alfa had experienced a 36% and 48% loss of activity, respectively. Interestingly, although both avalglucosidase alfa and alglucosidase alfa were stabilized in the presence of either 17 or 170 μM miglustat at 24 hours, the addition of miglustat resulted in a significant reduction of rhGAA activity overall. Mean ± S.D. is shown.
Miglustat Coadministration Did Not Impact the Pharmacokinetics of Alglucosidase Alfa or Avalglucosidase AlfaTo evaluate the effect of miglustat on the pharmacokinetics and biodistribution of the rhGAA enzymes, Pompe mice were administered 20 mg/kg alglucosidase alfa or avalglucosidase alfa with or without 10 mg/kg miglustat. As was previously reported, miglustat was administered orally 30 minutes prior to intravenous ERT administration (Khanna et al., 2012). Blood was collected 5, 15, and 30 minutes and 1, 2, and 4 hours postdose with a terminal blood collection 7 hours postdose. Analysis of the mean serum concentration of rhGAA in the presence or absence of miglustat showed no sex effect (Supplemental Fig. 2), and parameters were analyzed with the sexes grouped together. As with what is observed in patients, the serum half-life was shorter for avalglucosidase alfa compared with alglucosidase alfa, but exposure was similar between the two enzymes (Table 1). No significant effect of miglustat on serum exposure and half-life was observed for either avalglucosidase alfa or alglucosidase alfa (Table 2).
TABLE 1Serum pharmacokinetic parameters from Pompe mice after a single 20 mg/kg administration of enzyme replacement therapies with or without coadministration of miglustat (N = 10, 5 males/5 females per group)
TABLE 2Serum mean pharmacokinetic parameter ratios from Pompe mice treated with 20 mg/kg enzyme replacement therapies with and without coadministration of miglustat
Additionally, we assessed the biodistribution of alglucosidase alfa and avalglucosidase alfa with and without miglustat administration. A similar overall pattern of tissue enzyme levels was observed between avalglucosidase alfa and alglucosidase alfa (Fig. 5). As expected, avalglucosidase alfa levels were elevated in the heart due to high CIMPR expression (P < 0.05), but higher levels were also noted in the liver at 6 and 24 hours (P < 0.01) (Koeberl et al., 2011). Coadministration with miglustat largely did not affect the enzyme uptake of ERTs in this study. In the heart, triceps, and quadriceps, no significant effect with miglustat administration was observed at the group level, but a slight increase was observed in female mice administered alglucosidase alfa at 24 hours (P < 0.05). The reason for this is unknown but may be the result of the small sample size and therefore not biologically relevant. Avalglucosidase alfa levels were lower in the liver 6 hours postdose with miglustat administration versus avalglucosidase alfa alone (P = 0.0001). Overall, coadministration of miglustat did not impact the uptake of avalglucosidase alfa or alglucosidase alfa.
 Fig. 5.
 Miglustat (mig) does not affect the muscle distribution of alglucosidase alfa (algl) or avalglucosidase alfa (aval). N = 6 (3 males/3 females) per group [values below lower limit of quantification (LLOQ) were excluded from the graph]. A general linear model including all two-factor and three-factor interaction effects was used. Least squares mean method was used to evaluate the differences among treatment groups. To control multiple comparisons, a Bonferroni–Holm adjustment was used. Values below LLOQ were imputed by a uniform distribution, with the minimum as zero and maximum as LLOQ. Mean ± S.D. is shown. *P < 0.05, ***P < 0.0005.
Miglustat Has No Effect on Glycogen Clearance When Coadministered with Alglucosidase Alfa or Avalglucosidase AlfaTo evaluate the in vivo impact of M6P content versus miglustat binding on the efficacy of rhGAA enzymes, the pharmacodynamic effect of coadministration of miglustat with avalglucosidase alfa or alglucosidase alfa was measured in Pompe mice. Pompe mice were dosed weekly for 4 weeks with either alglucosidase alfa (20 mg/kg) or avalglucosidase alfa (4 or 20 mg/kg) in the presence or absence of miglustat (10 mg/kg). Similar to the dosing regimen previously published (
留言 (0)