
記住我
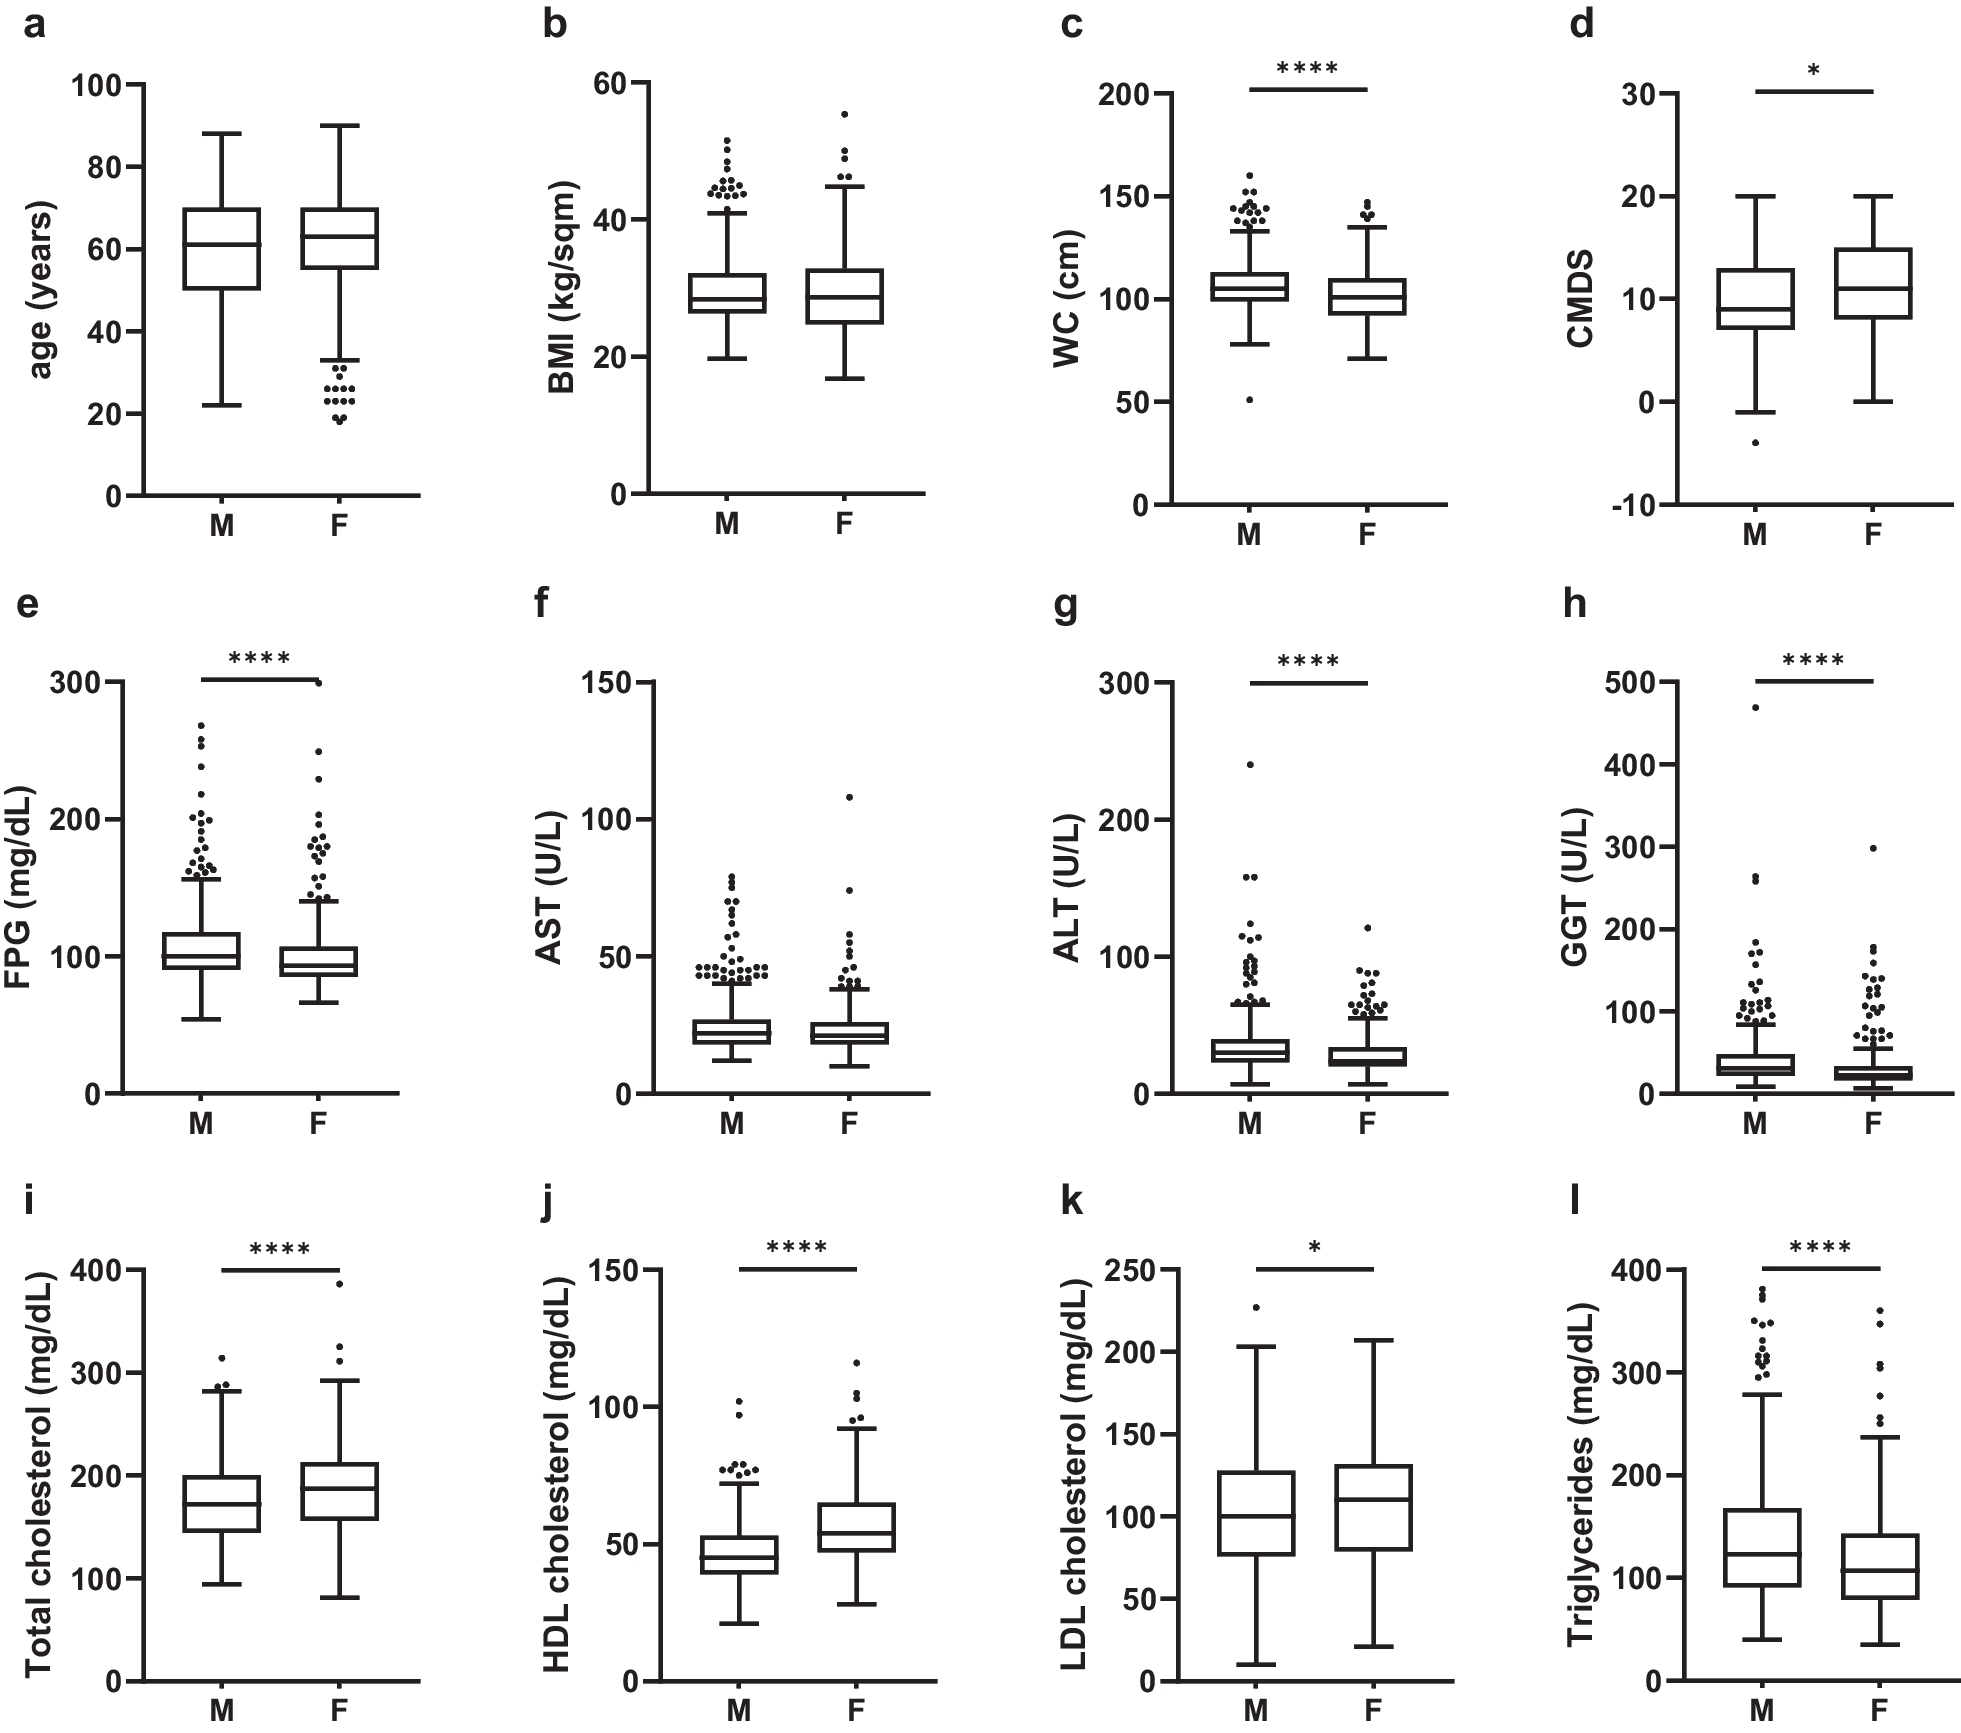


As shown in Table 1, the study enrolled 5586 participants, 49.8% (n = 2781) of whom were women and 30.4% (n = 1698) with NAFLD. The average age was 43.8 years, with a median BMI of 24.1 kg/m2. The women group had a lower BMI (22.5 [20.4, 25.0] vs. 25.4 [23.3, 27.6] kg/m2), and a smaller proportion of hypertension (12.8% vs. 20.6%), hyperlipidemia (46.0% vs. 61.9%), hyperuricemia (2.8% vs. 36.2%), and NAFLD (17.9% vs. 42.7%) than men. The AST and ALT levels in the women were also lower than those of the men. Most (90.5%) of the subjects in the study were with normal renal function (eGFR ≥ 90 mL/min/1.73m2). Blood lipid levels were worse controlled in men, including higher levels of TG, LDL-C, and lower levels of HDL-C compared with the women, but there was no big difference in TC levels. The concentrations of FBG and fasting insulin were higher, and the FFA levels were lower in men. The Adipo-IR index did not differ much between men and women (3.77 [2.36, 5.89] vs. 3.80 [2.48, 5.76] μIU/mL*mmol/L).
Univariate regression between Adipo-IR and NAFLD stratified by sexWe categorized the Adipo-IR index into four groups according to quartiles in all participants, using the first interquartile range (Q1) as the reference group (Table 2). The scale was as follows: Q1: 0.17 ≤ Adipo-IR ≤ 2.43, Q2: 2.43 < Adipo-IR ≤ 3.78, Q3: 3.78 < Adipo-IR ≤ 5.84, Q4: 5.84 < Adipo-IR ≤ 46.5 μIU/mL*mmol/L. 11.0%, 19.6%, 33.2%, and 57.9% of subjects in each interquartile range had NAFLD, respectively. We observed graded positive associations between Adipo-IR and NAFLD both in men and in women. In men, there were 2.20 (95%CI 95% CI 1.72–2.84, P < 0.001), 4.84 (95%CI 3.81–6.20, P < 0.001), and 12.51 (95%CI 9.76–16.14, P < 0.001) times higher odds of having NAFLD among subjects in the second lowest, the second highest, and the highest Adipo-IR quartile, respectively, compared to subjects in the lowest quartile of Adipo-IR. In women, the corresponding ORs seemed to be higher compared to ORs in men.
Multiple regressions between Adipo-IR and NAFLD stratified by sex and hyperlipidemia/LDL-CHyperlipidemia (P = 0.02), and sex (P = 0.01) were significant modifiers in the association between Adipo-IR and NAFLD after adjusting for age, BMI, eGFR, FBG, hypertension, and hyperuricemia. Age, BMI, eGFR ≥ 90 mL/min/1.73m2, hypertension, and hyperuricemia were not significant modifiers (all P > 0.05). Therefore, we conducted subgroup analysis by sex and hyperlipidemia, as shown in Table 3. After adjusting for potential confounders, there was a graded positive association between Adipo-IR and NAFLD in each subgroup. However, the ORs for NAFLD in hyperlipidemic women were generally higher than ORs in normolipidemic or hyperlipidemic men, and normolipidemic women, indicating that the association between Adipo-IR and NAFLD was strongest in hyperlipidemic women. In the hyperlipidemic women, there were 1.63 (95%CI 0.82–3.39, P = 0.18), 3.63 (95%CI 1.92–7.36, P < 0.001), and 9.62 (95%CI 5.14–19.30, P < 0.001) times higher odds of NAFLD among subjects in the second lowest, the second highest, and the highest Adipo-IR quartiles, respectively, compared to subjects in the lowest quartile of Adipo-IR. Similarly, as shown in Fig. 1, in the hyperlipidemic women, for one unit increase in log-Adipo-IR, the odds of having NAFLD increased by 385% after adjustment for other potential confounders (OR = 4.85, 95%CI 3.54–6.73, P < 0.001). However, it turned out that the odds of having NAFLD increased by 131% (OR = 2.31, 95%CI 1.74–3.11, P < 0.001), 216% (OR = 3.16, 95%CI 2.56–3.93, P < 0.001), 181% (OR = 2.81, 95%CI 1.88–4.28, P < 0.001) in normolipidemic men, hyperlipidemic men, and normolipidemic women, respectively.
Table 3 Multiple regression between Adipo-IR and NAFLD stratified by sex and hyperlipidemiaFig. 1
ORs between Adipo-IR and NAFLD stratified by sex and hyperlipidemia/LDL-C. *Adjusted for age, BMI, eGFR, FBG, hypertension, and hyperuricemia. All P values were < 0.001. Adipo-IR index, BMI and FBG were log-transformed when they were put into models. OR odds ratio, CI confidence interval, LDL-C low-density lipoprotein cholesterol, Adipo-IR adipose tissue insulin resistance index, NAFLD non-alcoholic fatty liver disease. Others were the same with Table 1
We further investigated which blood lipid components played an important role in this interactive effect, and we found that it was mainly LDL-C that modified the association between Adipo-IR and NAFLD (P = 0.02). We ran multiple regressions between Adipo-IR and NAFLD, stratifying by LDL-C (≥ 3.4 mmol/L) [25] and sex, adjusting for age, BMI, eGFR, FBG, hypertension, and hyperuricemia. Results in Fig. 1 also suggested Adipo-IR was a significant predictor of NAFLD in each subgroup. However, the association was strongest in women with high LDL-C, compared with women with normal LDL-C and men. In women with high LDL-C, one unit increase in log-Adipo-IR was associated with 4.41 times increase in odds for NAFLD after adjusting for other risk factors (OR = 4.41, 95%CI 2.97–6.73, P < 0.001).
Multiple regressions between Adipo-IR and NAFLD in women stratified by hyperlipidemia and ageAccounting for the effect of menopause, we further stratified women by hyperlipidemia and age (Fig. 2), although age was not a significant modifier in the relationship between Adipo-IR and NAFLD (P = 0.14). We found that the ORs in women with age ≥ 50 years were higher than ORs in women with age < 50 years, no matter in the normolipidemic or hyperlipidemic group, after adjusting for age, BMI, eGFR, FBG, hypertension, and hyperuricemia. Similar to previous results, the ORs in hyperlipidemic women were higher than ORs in normolipidemic women, no matter in the age < 50 or age ≥ 50-year-old group. On average, for one unit increase in log-Adipo-IR, the odds of having NAFLD increased by 474% (OR = 5.74, 95%CI 3.82–8.87, P < 0.001) in the hyperlipidemic women with age ≥ 50 years.
Fig. 2
ORs between Adipo-IR and NAFLD in women stratified by hyperlipidemia and age. *Adjusted for age, BMI, eGFR, FBG, hypertension, and hyperuricemia. All P values were < 0.001. Adipo-IR index, BMI and FBG were log-transformed when they were put into models. OR odds ratio, CI confidence interval, Adipo-IR adipose tissue insulin resistance index, NAFLD non-alcoholic fatty liver disease. Others were the same with Table 1
留言 (0)