
記住我


Pure curcumin (95% purity) was procured from SRL, India. Various solvents including chloroform, hexane, ethyl acetate, and methanol were obtained from RANKEM, India. Poly Vinyl alcohol (PVA) was sourced from Sigma Aldrich, while PLGA and carbopol 940 were obtained from Yarrow Chem, Mumbai. Triethanolamine oleate was purchased from SRL. All chemicals were of analytical grade, and demineralized water was used.
Plant material, processing and extraction processFresh Lakadong turmeric (LKD) rhizomes were collected from the Lakadong region in Meghalaya, India (Location: 25° 11′ 0" North, 92° 17′ 0" East). The plant material was authenticated at the Botanical Survey of India, Shillong, Meghalaya (India) and a voucher specimen (Specimen number. GIPS/2018/003) was preserved for future reference at the Central Museum of GIPS, Guwahati, India. The rhizomes were cleaned, dried, and ground into coarse powder. The homogeneous powdered material (1 kg) was subjected to successive extraction for 72 h using solvents (2.5 L) of increasing polarity (hexane, chloroform, ethyl acetate, and methanol) in a Soxhlet apparatus. The extracts obtained were filtered, concentrated using reduced pressure and labeled as hexane extract (LKDHE), chloroform extract (LKDCH), ethyl acetate extract (LKDEA), and methanol extract (LKDME).
Residual solvents in extracts by gas chromatographyThe collected extracts were analyzed for residual solvent content using Gas Chromatography (GC) with a Headspace system (Clarus 690 Perkin Elmer). The injection Volume sampling rate was maintained at 12,50000pts/s with initial oven temperature at 40̊ C for 2 min followed by GC run (Ramp 1 at 5.0 deg/min to 100 deg/min hold for 1 min and Ramp 2 10.0 deg/min to 150 deg/min with hold time of 0.00 min), offset at 100 µV. Extract samples were placed in vials, and the GC run was executed following the specified procedure (Fig. 1). The outcomes are displayed in Additional file 1: Fig. S1.
Fig. 1
Phytochemical evaluation of LKD extracts and characterization of curcumin. A: TLC chromatogram of LKD successive extracts; B, C, D: HPTLC fingerprinting of isolated curcumin from LKDCH E FTIR fingerprinting of purified LKD curcumin F MS spectra G 1H NMR of purified LKD curcumin H 13C NMR of purified LKD curcumin
Physical evaluations and phytochemical studies of the LKD successive extractsPhysical properties of the LKD successive extractsVarious physical parameters were evaluated on the extracts including testing for organoleptic characters, nature of the extract, percentage yield; pH and solubility testing were determined [13].
Phytochemical evaluations and analytical process of curcumin from LKDPreliminary phytochemical screening, thin layer chromatography and quantification of total phenolic contentPhytochemical screening of the LKD successive extracts was conducted to identify various classes of phytochemicals [14]. Prominent phytochemical classes that produced positive test results underwent further verification using Thin-Layer Chromatography (TLC) methods. For extracts abundant in curcuminoids, TLC analysis was executed following established protocols [15]. The procedure encompassed preparing sample extracts for analysis, selecting the stationary phase, optimizing the mobile phase, developing the chromatogram, and spotting detection, all in accordance with established guidelines. The stationary phase for TLC employed pre-coated silica gel 60 F254 aluminum sheets (Merck Ltd.), while the mobile phase was composed of a mixture of chloroform and methanol in a 9:1 ratio. Subsequently, the TLC plates were observed using short UV light (264 nm), long UV light (366 nm), and visible light, both before and after applying the detecting reagent. Furthermore, the optimization of High-Performance Thin-Layer Chromatography (HPTLC) fingerprinting and the analysis of the curcumin-rich crude fraction after isolation via column chromatography were performed using HPTLC CAMAG equipment, which included the Linomat V sample applicator, CAMAG TLC visualizer, and WINCATS 4 software.
Furthermore, based on the results of the preliminary phytochemical screening and TLC analysis, further studies were conducted for the total phenolic and tannin content estimation using a UV–Visible spectrophotometer (Shimadzu-AA6300). The total phenolic content and total tannin content were determined using the Folin-Ciocalteu method with certain modifications [16]. Sampling was done by preparing all the successive extracts at concentration of 1 mg/mL. A series of dilution in the concentration range of 0.02–0.10 mg/mL was prepared for tannic acid (1 mg/mL stock solution) taken as reference standard. The total phenolics (TP), total simple phenolics (TSP) and total tannin content (TC) were estimated using the reported methods. All estimations were performed in triplicates and were statistically expressed as Mean ± S.E.M using linear regression equation.
Isolation and characterization of curcumin from LKDThe analysis of the chloroform extract (LKDCH) through TLC and HPTLC confirmed a notable presence of curcumin. Consequently, an attempt was undertaken to isolate curcumin from this extract, employing a column chromatography approach. The wet packing method was adopted, wherein the column was packed with silica gel (#60–120 mesh, column grade, Merck Ltd.), combined with exceptionally pure chloroform. LKDCH (50 g) was absorbed in chloroform and introduced into the column. The elution process was executed by employing a gradient mixture of methanol (MeOH) and chloroform (CHCl3), with a progressively increasing proportion of MeOH within CHCl3. The gradient levels were as follows: 1%, 2.5%, 5%, 7.5%, 10%, 15%, 20%, 40%, 60%, 80%, and finally, 100%. The eluates were collected in 25 mL fractions. Similar Rf values led to the pooling of corresponding eluates, which were subsequently concentrated using a rotary evaporator. The procedure yielded 105 fractions. Notably, fractions 50–55 exhibited distinct yellow single spots of curcumin, which were then combined and subjected to concentration. To enhance its purity, curcumin was purified through recrystallization in 100% acetone and stored at room temperature.
The characterization and interpretation of the structure of the isolated curcumin was analyzed by sophisticated spectrometric techniques including FTIR (Bruker Alpha), 1HNMR and 13CNMR (Bruker Avance Neo 500 MHz FT-NMR spectrometer), Mass spectrometer (Waters Corporation MALDI-TOF SYNAPT XS HD Mass spectrometer) [17].
Differential scanning calorimetry (DSC)The DSC 3 instrument (Mettler Toledo; Model no-ME-5140313) was employed to examine the melting point behavior of both the isolated and purified curcumin, as well as the standard curcumin. Samples were positioned in aluminum pans and subjected to scanning at a rate of 10 °C per minute within the temperature range of 20 °C to 300 °C under an inert nitrogen gas environment. For confirming the identity and purity of the isolated curcumin, a comparison was made between the endothermic peak of the isolated curcumin and that of the standard curcumin [18].
HPLC analysis for determination of the purity of isolated curcuminThe purity of isolated Curcumin from Lakadong Turmeric extracts was determined by HPLC (Arc HPLC, Waters). The HPLC System consisted of a chromatographic pump, Injector, and UV detector. For HPLC separation, a reversed-phase C-18 column was used. The mobile phase was composed of acetonitrile-acidic Water (pH 3 adjusted by acetic acid) (80:20v/v) at a flow rate of 1 m/min. The run time was 10 min and the detection wavelength was set at 425 nm. The mobile phase was filtered using a 0.2 nm millipore membrane filter. The sample injection volume was set at 20 μl. The purity was determined by comparing it with a chromatogram of the standard curcumin from SRL, India (95% Purity) [8]. The result is shown in Fig. 2.
Fig. 2
HPLC chromatogram of curcumin. A: Curcumin standard; B: Curcumin in LKDCH and purity of isolated curcumin from LKDCH; C: Curcumin standard; D Curcumin isolated from LKDCH
Nuclear magnetic resonance (NMR)The chemical identity of the LKCH isolated curcumin was further confirmed by proton NMR spectrum usingHigh Resolution Multinuclear FT-NMR Spectrometer (ECX400 -Jeol 400 MHz, Japan). The samples were dissolved in dimethyl sulfoxide d6 (DMSO d6) as solvent. 20 µl of tetramethylsilane (TMS) was added to the sample solution as the internal reference. Chemical shifts observed were reported in parts per million (ppm) relative to expression of tetramethylsilane (TMS) in δ units, and the spin multiplicities were obtained as s(singlet) and d (doublet) [17].
Fourier-transform infrared spectroscopy (FTIR)The IR spectrum of isolated LKDCH curcumin was further compared with that of the standard curcumin used to determine its structural identity using FT-IR spectrophotometer (Perkin Elmer Model: L1600400 Spectrum Two Ft-IR/DTGS). The samples were placed directly in a KBr-coated pan and scanned at 400 to 4000 cm−1 [18].
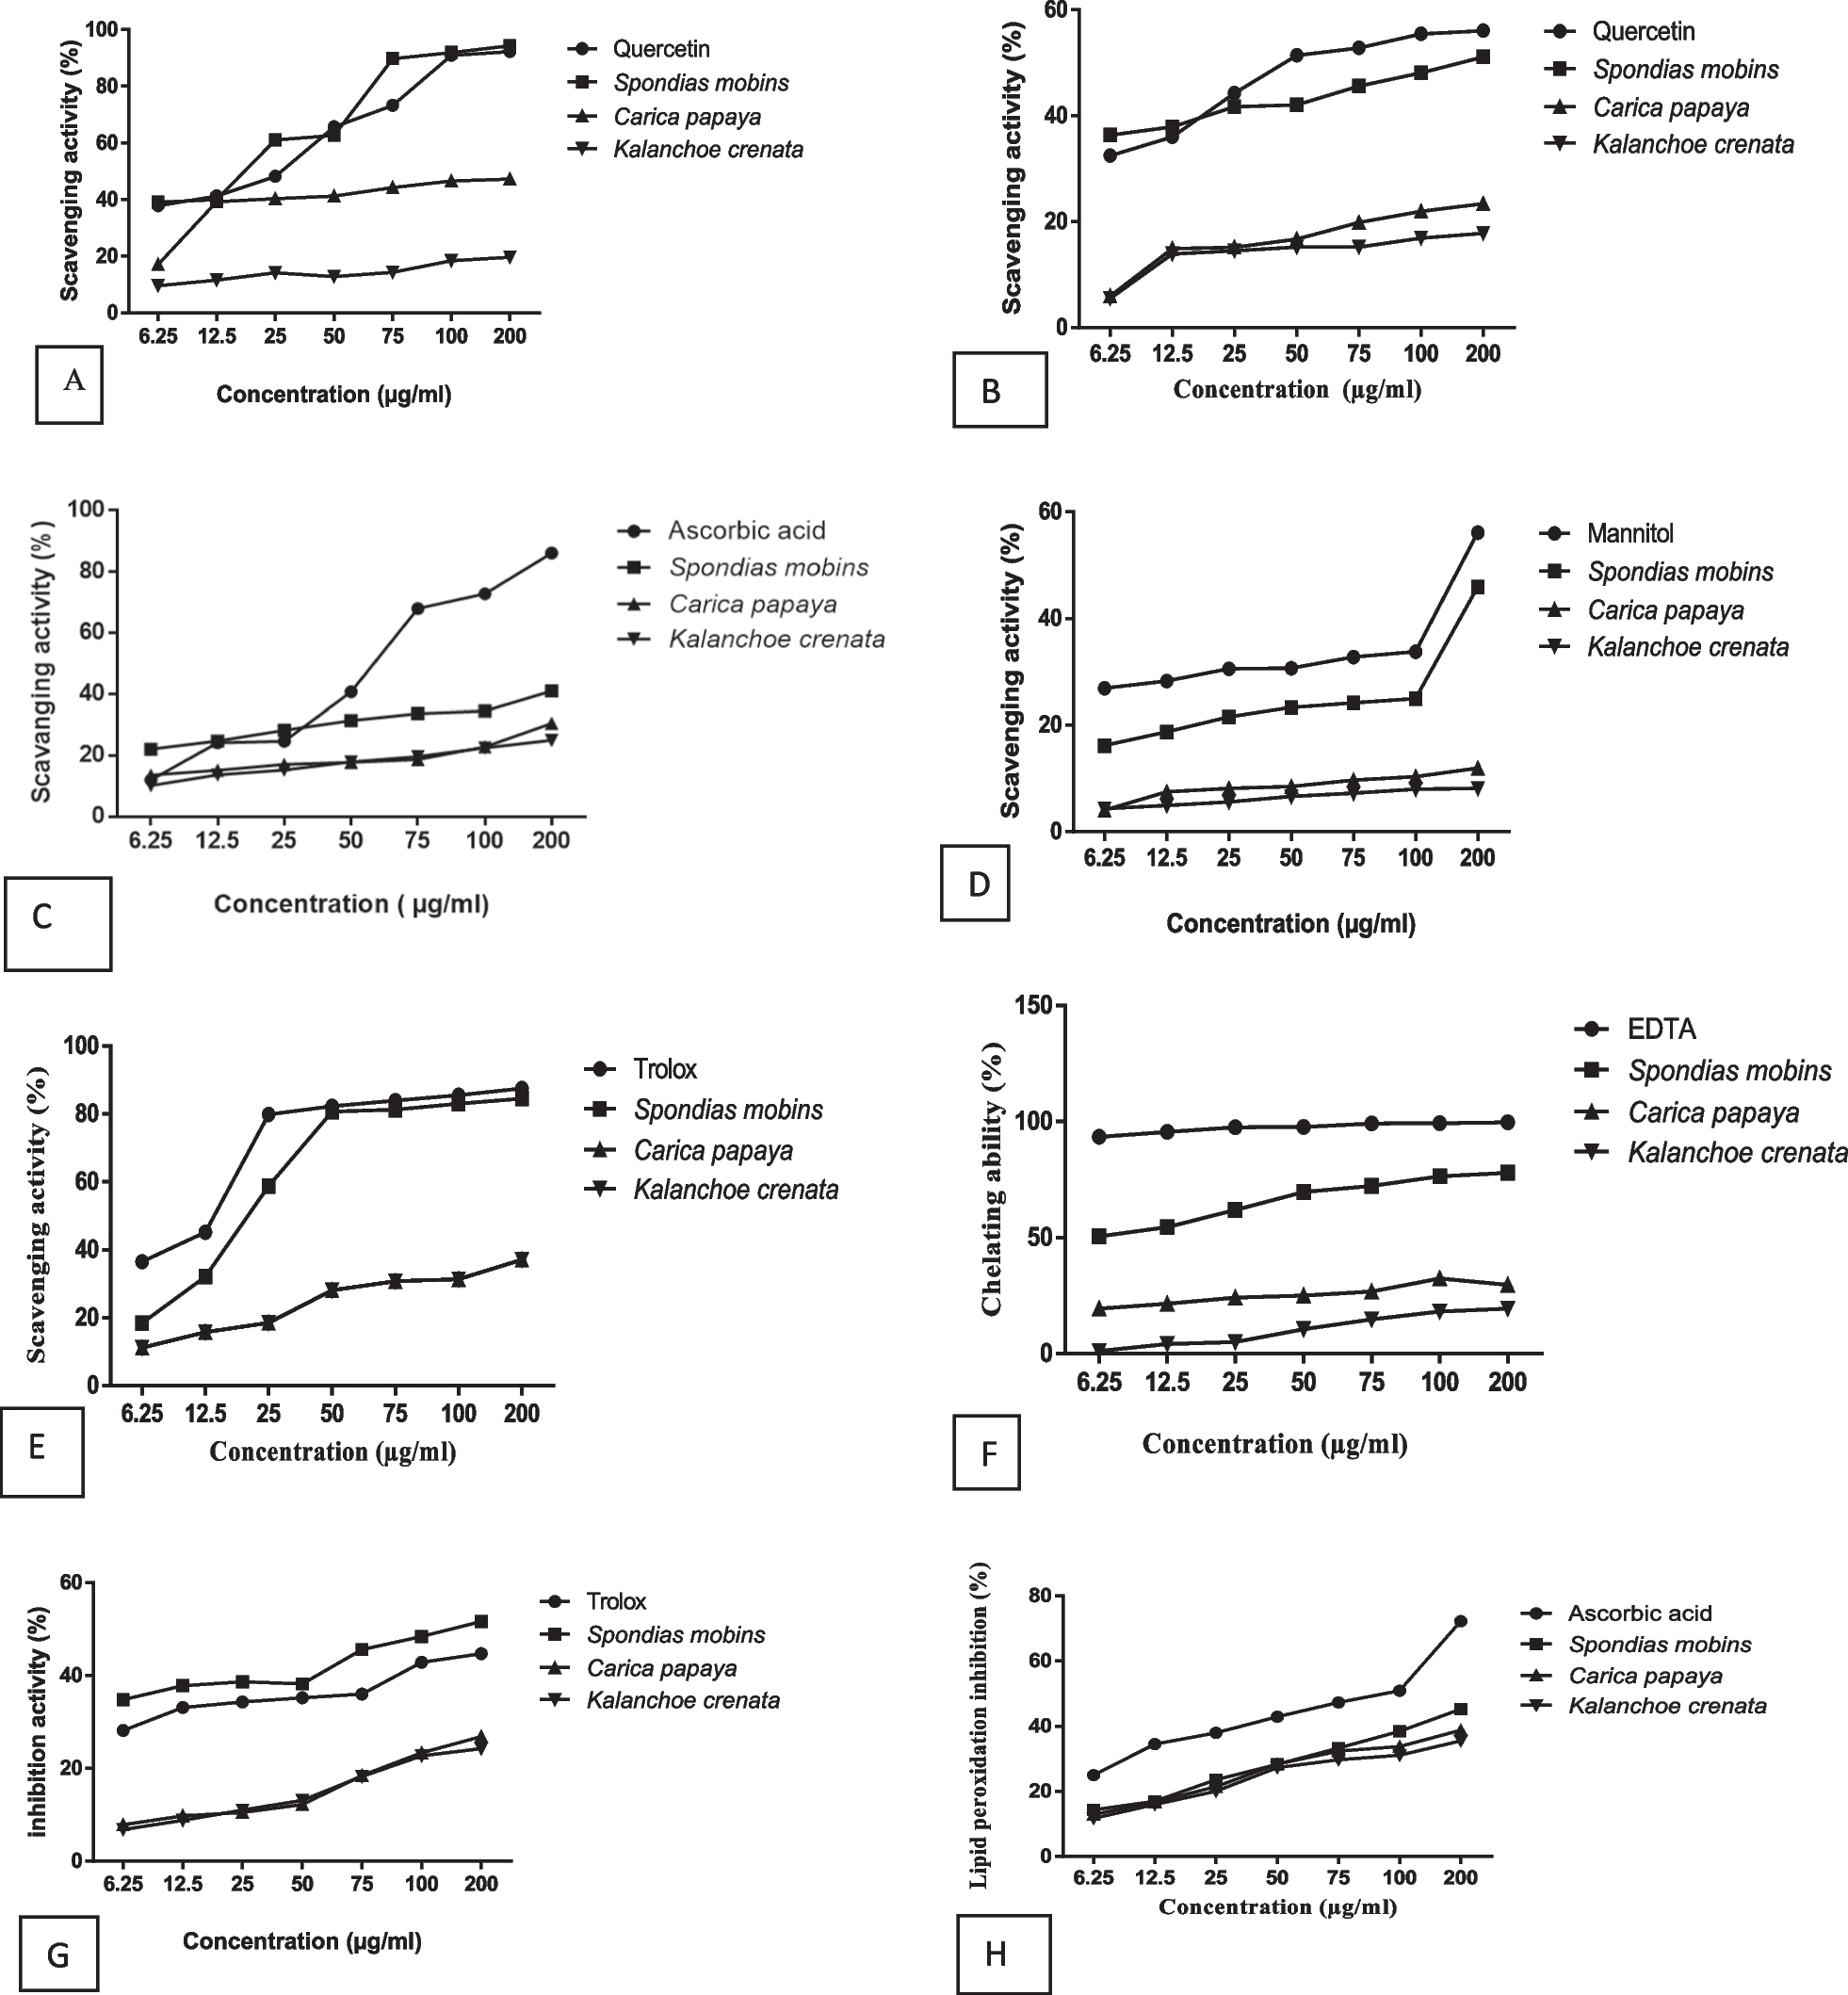
DPPH free radical scavenging activityThe standard approach was used to test the free radical scavenging ability of PFSEs against DPPH (1, 1 diphenyl-2-picrylhydrazyl) with minor modifications [19]. Aliquot series of dilutions (25–200 g/mL) of both LKD successive extracts and reference standard ascorbic acid were made from the stock solution (1 mg/mL). The reaction was started by combining individually the specific concentration of series of dilutions of LKD extracts and standard solution of ascorbic acid (25–200 g/mL) with 5 mL of a DPPH solution that had been prepared in methanol at a concentration of 100 mM/mL. After 30 min of dark incubation, the reaction mixtures were tested for absorbance at 517 nm
$$\% } = \, \left[ }_ - }_} } \right)/}_ } \right]}00$$
The absorbance of control solution is denoted by "A0" in this equation, while the absorbance of test sample is denoted by "A1". The IC50 was determined using ascorbic acid as a control and the regression equation by plotting the percentage inhibition against the relevant values. The results are shown in Fig. 3.
Fig. 3
DPPH radical scavenging activity of the LKD successive extracts
HRBC membrane stabilization assayHRBC membrane stabilization assay was performed to evaluate the anti-inflammatory efficacy [20]. Blood samples were mixed equally with sterile Alsever medium containing (2% (w/v) dextrose, 0.8% sodium citrate, 0.5% citric acid, and 0.42% sodium chloride in water). The blood was then centrifuged for an additional 10 min at a higher speed of 3000 rpm. Isosaline (0.85%, pH 7.2) was used to clean the packed cells after which a 10% (v/v) solution of isosaline was made. The secondary metabolite obtained from the plant extract, 1 mL of phosphate buffer pH 7.4 (0.15 M), 2 mL of 0.36% hyposaline, and 0.5 mL of HRBC suspension were all included in the test mixture. As a benchmark medication, diclofenac was employed. Distilled water(2 mL) was used as the control in place of the hyposaline solution. The test mixtures were centrifuged at 3000 rpm for 10 min after being incubated for 30 min at 37° C. Using a UV–Visible spectrophotometer set to 560 nm, the amount of hemoglobin in the supernatant was calculated [21]. The following equation was used to compute the percentage of hemolysis:
$$}\left( \% \right) \, = \, \left( }/}} \right) \, \times 00$$
$$}\left( \% \right) \, = 00 \, \, \left[ }/}} \right) \times 00} \right]$$
Preparation of nanosuspension by precipitation-sonication methodNanosuspensions were prepared with the Curcumin isolated from LKDCH using the precipitation-sonication method [22]. Briefly, the drug was added in 2 ml acetone and vortexed.To this solution PLGA was added to get the organic phase. The PLGA-CUR solution was then injected rapidly to 20 ml of previously prepared PVA solution followed by sonication for 10 min at 60 amplitude and 0.6 cycles. These precipitated nanosuspensions were then kept overnight under stirring to evaporate out the organic solvent.
留言 (0)