
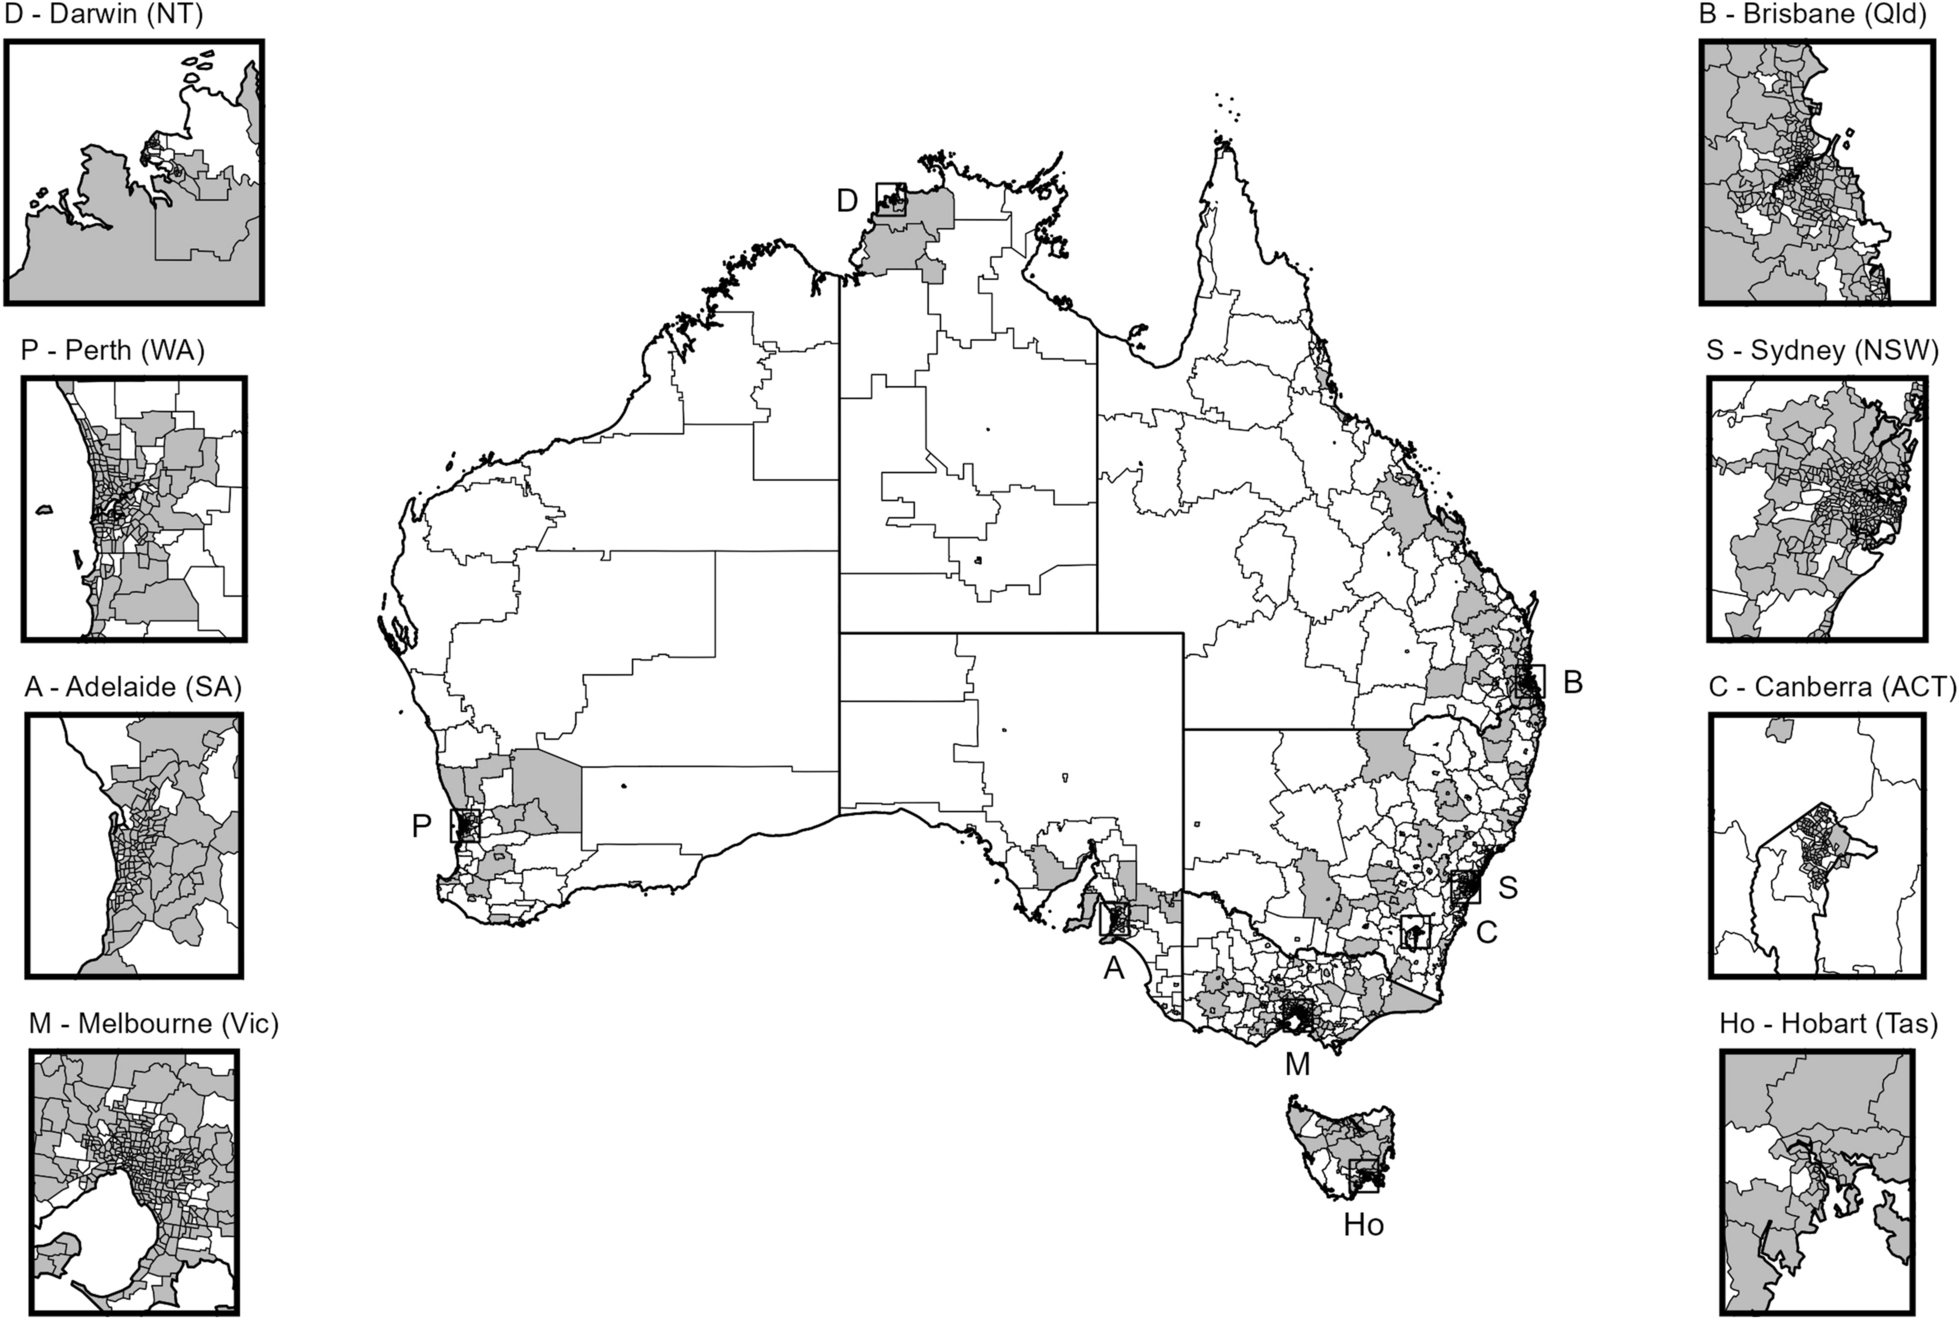
記住我


This study is part of a larger project which aims to develop a national index of playability which can be used to predict the outdoor active play behaviour of children in neighbourhoods across Canada. The output of this process will be used across Canada as part of the calculation of playability. As this project’s outcome was measured at the level of the 6-digit postal code, all metrics from the models developed in this paper are also calculated at the level of the postal code and are made available at https://www.github.com/rdboyes/streetview. The method could be easily adapted to calculate metrics at different levels if required.
The process described below can be broken up into distinct stages. First, a set of points are chosen which cover the geographic area in question (i.e., the area covered by the postal code). Second, the available images from these points are queried from the Google StreetView image API. Third, a convolutional neural network is used to label the objects in the images. Fourth, the presence or absence of objects in the image is decided based on these labels using statistical models. Finally, data from all images obtained in the postal code area are aggregated to the level of the postal code for use as input in future prediction models.
Populations and data sourcesThis study uses training data from Kingston, a small city of 150,000 people in Ontario, Canada and tests the resulting models using data from Vancouver a large city in British Colombia, Canada with a metropolitan area population of approximately 2.5 million. These cities were chosen due to proximity to study authors, their heterogeneous nature to ensure a fair out of sample test, and their availability of municipal data for use as ground truth when assessing the accuracy of the models. This ground truth data was obtained from open data portals and through direct requests to the cities.
The image data for comparison comes from Google’s StreetView image database via the static StreetView API using the R package googleway [15]. The static streetview API allows requests that include a latitude, longitude, and orientation (i.e. the direction the image is facing) and returns an image at the street level for the closest point available. Google StreetView images are not captured at a specific consistent distance apart; the distance between images depends on a few factors, including the equipment used, traffic at the time, and the location of the street. A typical pair of image capture locations would be approximately 25 m apart on a city street. Attempting to use all available images would not be feasible, both because of the extremely high number of images that would be required and because such a sampling strategy would result in many objects appearing in multiple images. Examination of a sampling of StreetView images suggested that the typical distance at which objects were still large enough to detect was approximately 75 to 100 m. Based on this, images were obtained at points every 150 m along every street in the study areas to obtain unique visual information on as many points as possible in each of the targeted postal code areas. For streets shorter than 150 m in length, a single point was queried at the midpoint of the street. At each point chosen by the sampling strategy, 4 images were obtained from the StreetView API corresponding to the cardinal directions. In cities, streets which do not have images are very uncommon, but if images were not available, the points were excluded from the analysis.
Image processingOur image processing strategy was designed to be able to classify each pixel in a StreetView image using categories which would be commonly seen in street-level images. These categories were taken from the labelling of the cityscapes dataset and include person, rider, sidewalk, road, vegetation, terrain, sky, pole, traffic light, traffic sign, car, truck, bus, motorcycle, and bicycle [16]. This gives information on the amount and location of each of these features visible in each of the images obtained from StreetView. Some of these categories were compared directly with available data, including traffic lights, traffic signs, trees, sidewalks, and people; others were collapsed, with bicycle and rider becoming “cyclists” and road, cars, trucks, and motorcycles being combined into “vehicles”; one was excluded because of its rarity in the data and lack of available comparison data (“bus”); and, finally, some were not examined as they had no direct comparison or were deemed unimportant for measurement of the playability environment (“terrain”, “sky”, and “pole”).
To accomplish pixel-level segmentation, we used a deep neural network architecture originally proposed by DeepLab and implemented in tensorflow to analyze neighbourhood images [16]. The network consists of an encoder based on Xception [17] and a decoder which translates the features extracted by the encoder into pixel-level class predictions. The cityscapes datasets provide a small, finely annotated set consisting of 5,000 street-level images and a larger, coarsely annotated set consisting of 20,000 street-level images. Each of these datasets has pixel-level annotations for 19 classes of objects, including vegetation, vehicles, road, sidewalk, people, traffic signs, and traffic lights, anad others [18]. Using these datasets, neural networks previously optimized for detection of generic objects in the imagenet or other large datasets can be retrained to categorize common objects found on the street. The resulting model retains the lower-level layers which allow the recognition of features such as edges, colours, and textures, but interpret these features differently due to retraining of the later layers and the decoder. Our analysis uses a model checkpoint set by DeepLab. For the complete code used to implement all models and algorithms described in this paper, please refer to the github repository, found at github.com/rdboyes/streetview/. An example StreetView image segmentation is shown in Fig. 1.
Fig. 1
Example of pixel-level image segmentation of a representative Google StreetView image
Units of analysisFor each feature we measured, we attempted to quantify the accuracy of the method as it would be used in the assessment of a neighbourhood. Where data were available and appropriate, we calculated a 500-m Manhattan-style buffer around each postal code centroid in the study area, and compared the assessment of each neighbourhood feature from image and from the standard data source. For measures of traffic density that were measured through a single point, buffers were sized in the training data based on the highest correlation with the ground truth data and tested in the test data for accuracy. In urban areas in Canada, six-digit postal code regions can be very small. The use of these buffers standardizes the amount of space covered to more accurately represent the walkable area in the immediate vicinity of a home in those postal codes.
Geographic measurementTreesVancouver and Kingston open data [19, 20] both provide the location of every tree visible from the street in the study area. The target measure for both cities was defined as the number of trees inside of each postal code manhattan buffer, which was predicted using the “vegetation” measure from the StreetView images in the same area.
SidewalksKingston’s open data provides the locations of all town-maintained sidewalks maintained by the city. Each road segment in Kingston was classified using these data as either having a sidewalk or not. If sidewalks were detected in images on a road segment, then the road segment was considered to have a sidewalk according to the StreetView measure. Classification sensitivity and specificity were calculated for the StreetView measure using the municipal data as ground truth. For each postal code area, the target metric was the meters of road length with sidewalks, which was predicted based on aggregating the predictions at the segment level. Equivalent ground truth data were not available in Vancouver. This outcome was predicted using the “sidewalks” measure from the StreetView images.
Density of pedestrians, cyclists, and vehiclesData for traffic counts through intersections were obtained via direct request from the city of Kingston and from the Vancouver Open Data portal. Traffic counts for Vancouver were available in some cases for multiple years, and in these cases, the most recent year’s data was used. Kingston’s measures were an annualized expected traffic count for pedestrians, cyclists, and vehicle traffic. Vancouver’s reported numbers were the total count of traffic first and last 2-h block of the day, representing rush-hour traffic. While these counts of traffic are measured at the level of an intersection, they require StreetView data from a larger area to measure correctly. Forty different buffer sizes were tested in Kingston, ranging from 50 to 2000 m around each of the 576 intersections for which data was available, were tested to determine the range required to obtain the best measure of traffic through intersections available from StreetView data; optimal buffer sizes were selected considering the tradeoff between size and model accuracy, and these same buffer sizes and models were tested in Vancouver. These outcomes were predicted using the “road”, “car”, “truck”, and “person” measures from the StreetView images.
Traffic lights and traffic signsGround truth traffic light and traffic sign data were obtained from the city of Kingston directly and from the Vancouver Open Data portal. The models developed with the Kingston data using the “pole”, “traffic sign”, and “traffic light” pixels in the StreetView images, and were then tested in the Vancouver data. The model in both Kingston and Vancouver targeted the number of traffic signs and traffic lights per postal code area.
Statistical analysisThis study uses three different model architectures—a support vector machine, an XGBoost model, and a linear model—to test the viability of the StreetView point measure in assessing measures of the built environment for use in prediction models. The models use standardized inputs and outputs to increase the likelihood that the models will be transferable to different cities and contexts. Each model is evaluated using three metrics: root mean squared error (RMSE), R2, and mean absolute error (MAE).
Error statistics in both the training and test sets are provided. In the training set, error statistics are calculated using fivefold cross validation, while test set error statistics are simply calculated using the full test set. Data analysis was conducted in R version 4.2.1 using the tidyverse suite of packages for data processing and cleaning and the simple features package for handling geographic data [21,22,23]. The caret package was used for model fitting and evaluation [24]. Python was used for the neural network implementation, with the reticulate R package being used to communicate between the two languages when required [25].
留言 (0)