
記住我

The 143 participants were metabolically characterized directly and 18 months after a weight loss intervention [9, 14]. The complete protocols of this study are described in detail in a previous publication [9]. For our analysis, we selected all participants with biosamples available to determine 5-AVAB relative levels at T-3 and T0. The patients’ characteristics and metabolic profiles are presented in Table 1.
Table 1 Patient characteristics.Baseline analysesValerobetaine levelsThe intervention had a significant effect on 5-AVAB, with log-transformed 5-AVAB peak intensity decreasing slightly from T-3 to T0 (5% change, p = 0.019, two-sided paired t-test).
Metabolic parametersPrior to the standardized weight reduction (T-3), 5-AVAB levels showed no significant association with any metabolic parameters assessed. At T0, however, 5-AVAB levels were moderately associated with BMI (r = 0.192, p = 0.030) and whole body fat mass (r = 0.192, p = 0.030) while negatively correlated with lean body mass (r = −0.237, p = 0.007).
With respect to glucose metabolism, we detected no association with HbA1c levels or estimates of insulin secretion (AUC Insulin/AUC Glucose, disposition index—oral glucose tolerance test) at T0. However, we found a significant association with estimates of the whole body (HOMA-IR (r = 0.207, p = 0.019)) and muscular insulin resistance, which was measured by the gold standard hyperinsulinemic-euglycemic clamp (r = −0.249, p = 0.005). This indicates a relationship between circulating 5-AVAB and an overall decreased insulin sensitivity in humans.
The liver fat score (LFS) was significantly associated with 5-AVAB levels (r = 0.194, p = 0.028) at T0. We observed a similar association with the fatty liver index (FLI) (r = 0.204, p = 0.021). For all correlations, see Table 2.
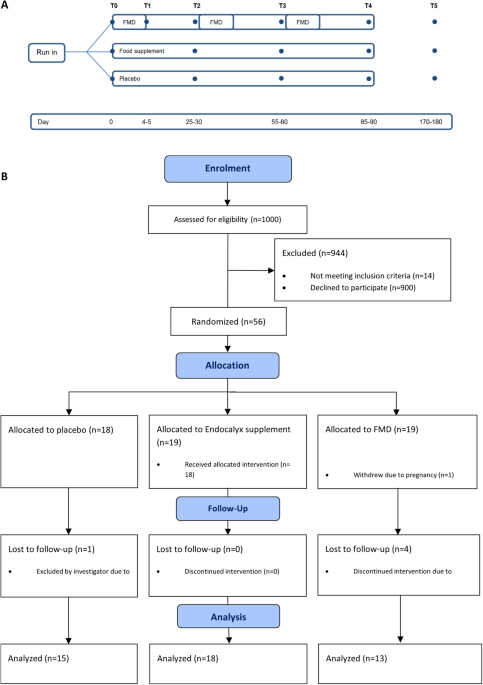
Table 2 Partial correlations.Predictive analysesOf the 143 participants included in the analysis, 104 completed the RCT to the primary endpoint at T18 (46 individuals in the control group and 58 in the intervention group). In correspondence to the original results, BMI was not different between both groups after 18 months (33.1 ± 5.2 kg/m2 vs. 33.6 ± 5.5 kg/m2, p = 0.55).
To analyze the predictive impact of 5-AVAB at T0 on BMI, HbA1c, and LFS 18 months after weight loss, we performed a linear regression analysis adjusting for age, sex, and randomization group. For a second analysis, we additionally adjusted for the baseline level of the respective covariate of interest as well as BMI change from T0 to T18 (BMIT0T18, for HbA1c and LFS).
5-AVAB significantly predicted future HbA1c levels (beta 0.280, p = 0.001). Model specifications with additional corrections and standardized beta coefficients are summarized in Table 3. This effect also persists after additional adjustment for baseline HbA1c and change in BMIT0T18. A dot plot of individual 5-AVAB and HbA1c levels is supplied in Supplemental Fig. 3.
Table 3 Regression analysis: predictors of HbA1c.To evaluate this relationship further, we performed a multinomial logistic regression analysis for 5-AVAB tertiles with respect to the impaired glucose metabolism based on oral glucose load after 18 months (no diabetes vs. impaired glucose metabolism/impaired fasting glucose and diabetes).
This analysis showed an odds ratio of 1.988 (p = 0.019) for impaired glucose metabolism and 3.26 (p = 0.027) for diabetes with increasing 5-AVAB levels. For model specifications, see Table 4.
Table 4 Nominal regression analyses: predictors of impaired glucose metabolism.When looking at the relative progression or remission between normoglycemia, impaired glucose metabolism, and diabetes, we found a progression rate of around 17.0% for the first tertile, while in the third tertile, this percentage doubled to 35.4% (Fig. 1). The corresponding odds ratios and model specifications are presented in Fig. 2 and summarized in Table 5.
Fig. 1: Change in diabetes status: 5-AVAB tertiles.
5-AVAB tertiles calculated from log-transformed valerobetaine values. Diabetes status is classified as 1 = “no diabetes”, 2 = “impaired fasting glucose or impaired glucose tolerance” or 3 = “type 2 diabetes mellitus”. “Progression” is defined as an upward change in status from T0 to T18, and “Remission” is defined as a downward change.
Fig. 2: Risk of diabetes according to circulating 5-AVAB levels.
Results of multinominal logistic regression analyses. A Crude model adjusted for age, sex, and randomization, B Fully adjusted model additionally considering BMI change and T0 diabetes status. 5-AVAB tertiles calculated from log-transformed 5-AVAB values.
Table 5 Nominal regression analysis: predictors of impaired glucose metabolism (progression).We repeated our analysis after the exclusion of patients medically treated for diabetes in order to avoid the confounding effect of the medication on HbA1c levels and to exclude variation due to the potential effect of a metformin-associated increase in 5-AVAB levels [15]. The reported relationship between 5-AVAB levels and HbA1c as well as impaired glucose metabolism persisted in this subset of patients. Additionally, 5-AVAB levels at T0 now showed a significant predictive value for T18 LFS (beta 0.303, p = 0.002). Before the correction, 5-AVAB presented only a trend towards a predictive value (beta 0.179, p = 0.086), which did not reach significance.
留言 (0)