Ethics statement
All procedures were in accordance with all relevant ethical regulations for animal testing and research and the ethical standards of the institutional and the national research committee and with the 1964 Helsinki declaration and its later amendments or comparable ethical standards. Specifically, this study was approved by the Soroka Medical Center Institutional Review Board (IRB approval #5071G) and the Israel Ministry of Health National Helsinki Committee (approval #920100319).
Clinical phenotyping
Affected individuals were examined by senior geneticist, pediatrician, and ophthalmologists. Patients underwent thorough ophthalmic examination, including testing of visual acuity, refractive errors, eye movements, ocular alignment, and examination of the anterior and posterior segment of the eye. For young patients, evaluation of vision was performed based on their fixation behavior, and the eye exam was performed under general anesthesia due to insufficient cooperation. A subset of affected individuals had ocular ultrasound exam and full field electroretinography.
Genomic DNA extraction from whole blood or saliva
Blood or saliva samples were obtained following written informed consent from all individuals studied or their legal guardians. Blood samples (3–10 ml) were collected in BD™ EDTA tubes, and total genomic DNA was extracted using E.Z.N.A.® Blood DNA Kit. Saliva samples were collected in OG-500 Oragene™ Saliva DNA Collection Kit (Oragene™, Ottawa, Ontario, Canada) and genomic DNA was extracted per manufacturer’s instructions.
Linkage analysis
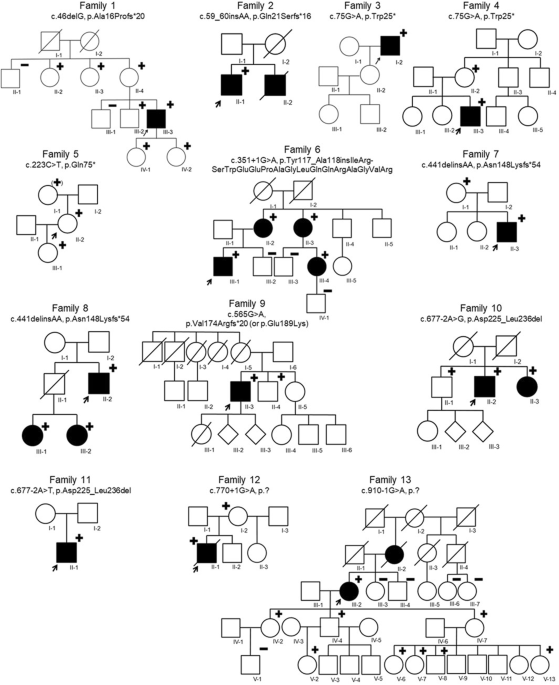
Samples were derived from the 25 members of pedigrees P1 and P2 with marked genotypes (Fig. 1a). Genome-wide linkage analysis was performed as previously described43. In short, using Illumina GSAv2 (Infinium™ Global Screening Array v2.0; Illumina, San Diego, CA, USA) > 665 K markers per sample were genotyped. All informative SNPs were used for subsequent analyses. Homozygosity mapping for both pedigrees (separately and combined) was carried out using Homozygosity-Mapper44, using 309,811 markers spread across all autosomal chromosomes, and was set to retrieve all common homozygous regions shared by the seven available affected individuals, with no lower threshold set for the size of homozygosity loci. Regions of over 50 sequentially identical homozygous markers appearing in at least one healthy control were omitted. Next, multipoint LOD score for both pedigrees was calculated via SUPERLINK ONLINE SNP 1.145 software, zooming into the locus found in the homozygosity mapping (using all segregating SNPs), in groups of 6 SNPs per window. Physical positions are of GRCh37/hg19 genome assembly.
Trio whole genome sequences analysis
Whole Genome Sequencing (WGS) trio of the proband (P1:VI-2, Fig. 1a) and her parents were performed by the Novogene Corporation bioinformatics team (Palo Alto, CA, USA). In short, genomic DNA samples were fragmented to 350 bp inserts, and the libraries were generated using Truseq Nano DNA HT Sample Preparation Kit (Illumina USA). Sequencing was performed using HiSeq X (Illumina, San Diego, CA, USA) and paired-end 150-bp read protocol. The average percentage of Q30 was above 84% and the error rate below 0.05%. At least 90 Gb raw data per sample were obtained. Standard Novogene bioinformatics analysis included alignment with the reference genome (1000 Genomes GRCh37 + decoy human genome) and statistics of sequencing depth and coverage; SNP/InDel, SV and CNV calling, and variants annotation and statistics each using the relevant software (BWA, SAMtools, Picard; GATK, ANNOVAR; Delly, ANNOVAR; control-FREEC, and ANNOVAR in concordance). Data were next analyzed using QIAGEN’s Ingenuity Variant Analysis software (www.qiagen.com/ingenuity, QIAGEN, Redwood City, CA, USA), last accessed December 31, 2020 (Ingenuity Variant Analysis version 7.1.20201218). We excluded irrelevant common variants with an observed allele frequency of more than 1% in any of the public databases (in parentheses- version): 1000 Genomes project (phase3v5b), ExAC (0.3.1), gnomAD (2.1.1), and NHLBI ESP exomes (ESP6500SI-V2), or found in homozygous state in one or more of our in-house WGS controls. We kept all proband sample variants found on chromosome 2 between positions 219821659 and 220384126 (either interpreted as homozygous or heterozygous, without excluding low-confidence variants).
To ensure the reliability of the variants, IGV46,47 was used to assert the variants manually. Variants not truly homozygous in the proband sample and heterozygous in the parents were excluded. Beyond the automated analysis, the entire locus was carefully re-examined against other control genomes using IGV for other segregating and rare structural variants, including indels and possible copy number variations.
The variants were assessed and prioritized initially based on known pathogenic variants found in HGMD pro (v. 2020.3), ClinVar (2020-09-15), and OMIM (July 06, 2020). Next, they were assessed based on gnomAD frequency, gnomAD Jewish frequency, gnomAD homozygous count, 1000 Genomes frequency, in-house WGS homozygous count, and by conservation phyloP p-value (2009–11), CADD Score (v1.6), and Ingenuity’s computed ACMG guidelines classification.
Segregation analysis and population screening
The NHEJ1 intronic variant was further assayed through Sanger sequencing using forward and reverse primers: [F:5’- aggaagctccttgcattgct-3’, R:5’- ataggtctggtggtaggggg-3]. We also applied restriction fragment length polymorphism (RFLP) analysis to both pedigrees and 87 ethnically matched controls, using forward and reverse primers: [F:5’- ggaagctccttgcattgctg-3’, R:5’- gctacctcggatgaggaaca -3’]. RFLP using the restriction endonuclease HphI (New England Biolabs, Ipswich, MA, USA) yielded 82 and 66 bp segments for the wildtype sequence compared with 148 bp for the mutant (uncut). Primers were designed using Primer-Blast48.
Assessment of the NHEJ1 variant
Prediction tools used included MutationTaster49 and Human Splicing Finder50. UCSC genome browser (http://genome.ucsc.edu) was used to study the human chromosome 2q35 locus and the relevant conserved non-coding elements in humans, dogs, chickens and mice, and to convert the genomic location between species (using “view- in other genomes” or retrieving the DNA and performing BLAT)51,52. NCBI’s BLAST (https://blast.ncbi.nlm.nih.gov/Blast.cgi) was used to align the DNA sequences, and for searching in the Zebrafish genome53. Regulatory tracks were presented on UCSC, based on ENCODE, GeneHancer (GeneHancer Hub at the UCSC Golden Path -directed from GeneCards)54,55,56.
Gallus gallus ATAC-seq library preparation and sequencing
Specific-pathogen-free chicken eggs (Charles River Laboratories, catalog 10100329) were incubated in a humidified incubator at 38 °C and collected at embryonic day 4 or 5 (Hamburger Hamilton stage 24 and 26). Eyes were enucleated and washed in cold PBS, and a sheet of RPE from the posterior eye chamber was collected directly into cold ATAC-seq lysis buffer (Active Motif cat. 53150). The RPE from two embryos were collected per biological sample. Biological replicates were carried out in duplicate and ~100,000 nuclei were loaded per reaction. Library preparation was carried out per manufacturer’s instructions (Active Motif cat. 53150), and final libraries were validated on the Agilent Bioanalyzer before sequencing on a lane of HiSeq 4000. Each sample was sequenced to a minimum depth of 80 million 150 base pair paired end reads. Raw reads were quality trimmed using trim galore with the parameters –clip_R1 16 –clip_R2 18 –three_prime_clip_R1 6 –three_prime_clip_R2 457,58 and high-quality reads were aligned to the chicken genome (GRCg6a) using Bowtie 259 with the parameters –very-sensitive -k 5 -p 4059. Biological replicates were collapsed and visualized using Integrative Genomics Viewer46.
Plasmid constructs
The ptkEGFP_v2 and ptkmCherry_v2 backbones were developed and shared by Masanori Uchikawa, as previously described60. Hsp68mp-lacZ backbone was taken from previous studies4. High fidelity Q5® polymerase (New England Biolabs, Ipswich, MA, USA) was used for all PCRs, including insertion of deferent restriction enzymes’ recognition sites in the inserts’ borders and site-directed mutagenesis using the primers appearing below. The Cloning Kit of pJet (Thermo Scientific CloneJET PCR Cloning Kit) and basic cut & paste (sub)cloning were used to attain all constructs (Sup. Table 2). Cloning design and sequence analyses were done using SnapGene software (Insightful Science; snapgene.com). The plasmids for enhancer assays in chicken and mice embryos are based on a minimal promoter that activates the reporting gene only upon insertion of specific tissue-dependent enhancers.
Generation of the constructs for the chicken experiments (“gal-i8-ptkEGFP ver2” and “gal-i8-ptkmCherry ver2”): the genomic region (putative enhancer) of Chicken ‘i8’ was amplified from DT40 extracted DNA (Chicken bursal lymphoma cell line, ATCC) genome using primers 5’-GGTAccggaggagcccaagcacaaat-3’ & 5’- CTCGAGctttctgccctttcactgcc-3’ and inserted into pJet (Thermo Scientific CloneJET PCR Cloning Kit) to be subcloned into the “ptkEGFP_v2” and “ptkmCherry_v2” backbones. Generation of the constructs for the mouse experiments: the two genomic regions (putative enhancers), Mouse “i8” and “i9”, were amplified from the C57BL/6 mouse genome, using primers 5’-ttgaggcagaaggattgtcata-3’ & 5’-agccagaggtcaacatttgagt-3’ (for “mice i8”), and 5’-gctgagatgaatgacagtgagg-3’ & 5’-gtcacacctgatgatctgcatt-3’ (for “mice i9”), as described in Will et al.16, and inserted into blunt cut-open hsp68mp-lacZ4 (to create “mice_i8-Hsp68mp-lacZ”, and “mice_i9-Hsp68mp-lacZ”, accordingly). Site-directed mutagenesis, introducing the human NHEJ1 variant (NM_024782.2): c.588+18131 A > G (or NG_007880.1: g.37317 A > G) to the mouse sequences, was done using primers 5’- atggggCgaagaggagggcaggaattg-3’ and 5’- ctcttcGccccatacagctaggaattagtgg-3’ (for “mice_i8-MUT-Hsp68mp-lacZ”). All plasmids were validated by Sanger sequencing. Plasmids were transformed into competent E-coli and purified using the Presto™ Mini Plasmid Kit (Geneaid, New Taipei City, Taiwan). Large preparations for chicken embryos injections were done using Geneaid Midi/Maxi Plasmid Kit, Endotoxin Free (Geneaid, New Taipei City, Taiwan).
Transgenic chicken embryos enhancer-reporter assay
The transgenic chicken embryos were generated as previously described (https://bio-protocol.org/e1498)61. Briefly, the Chicken ‘i8’ putative enhancer construct (“gal-i8-ptkEGFP ver2” or “gal-i8-ptkmCherry ver2”) was concentrated to 1–2 ug/µl and injected into the optic vesicles of chicken embryos at Hamburger-Hamilton stage 9–12. Injections were performed using borosilicate capillary tubing for injection (FHC, catalog. 30-30-1) made with a micropipette puller. An electrolyte solution of 100 µl of HHBS or Ringer’s Solution was added to embryos before electroporating with an ECM 830 High Throughput Electroporation System using the following settings: 18 V, 50 ms pulse length and 3 pulses, as previously described61. Electroporation was performed with platinum/iridium microelectrodes designed to the previously described dimensions61. Fluorescence was observed 2 and 3-days post-electroporation and visualized on green channel using the Zeiss Discovery V8 and V12 SteREO Microscopes (Carl Zeiss Microscopy GmbH, Jena, Germany). In all cases throughout the study, electroporation of a control ptkEGFP enhancer construct in the absence of the i8 promoter did not result in any observable fluorescence.
Transgenic mouse enhancer-reporter assay
Mouse enhancer assays were carried out in transgenic mouse embryos as previously described4, performed by Cyagen Biosciences (Cyagen US inc.), whose facility meets animal health and welfare guidelines. In short, following validation of the ‘mice embryos’ vectors (mice_i8-Hsp68mp-lacZ, mice_i8-MUT-Hsp68mp-lacZ, mice_i9-Hsp68mp-lacZ, and a negative control- Hsp68mp-lacZ without a putative enhancer), they were bacterial-amplified and purified, linearized and pronuclear injected to C57BL/6NxC57BL/6N mice fertilized oocytes. Oocytes were then transferred into the oviducts of pseudo-pregnant mice. Embryos were retrieved from surrogate mothers at E11.5, genotyped by PCR (primer sequences available upon request), fixed in 4% paraformaldehyde, and X-gal stained for the expression of LacZ in the embryos at E11.5. Empty vector (Hsp68mp-lacZ)-injected embryos served as negative control. Enhancers showing consistent reporter gene expression in the relevant tissue among at least three embryos were defined as positive; putative enhancers assayed were defined as negative (for this embryonic day only) when no reproducible pattern was observed among a minimum of five transgenic, PCR positive and lacZ positive embryos (per x-gal staining in the embryos)27.
Histology studies
Coronal plane sections of the transgenic (and X-Gal stained) mouse embryos’ eyes were obtained by Excalibur Pathology Inc (Norman, OK, USA). Processing included paraffin embedding, sectioning and nuclear fast-red counterstaining.
Reporting summary
Further information on research design is available in the Nature Research Reporting Summary linked to this article.

Comments (0)