
記住我
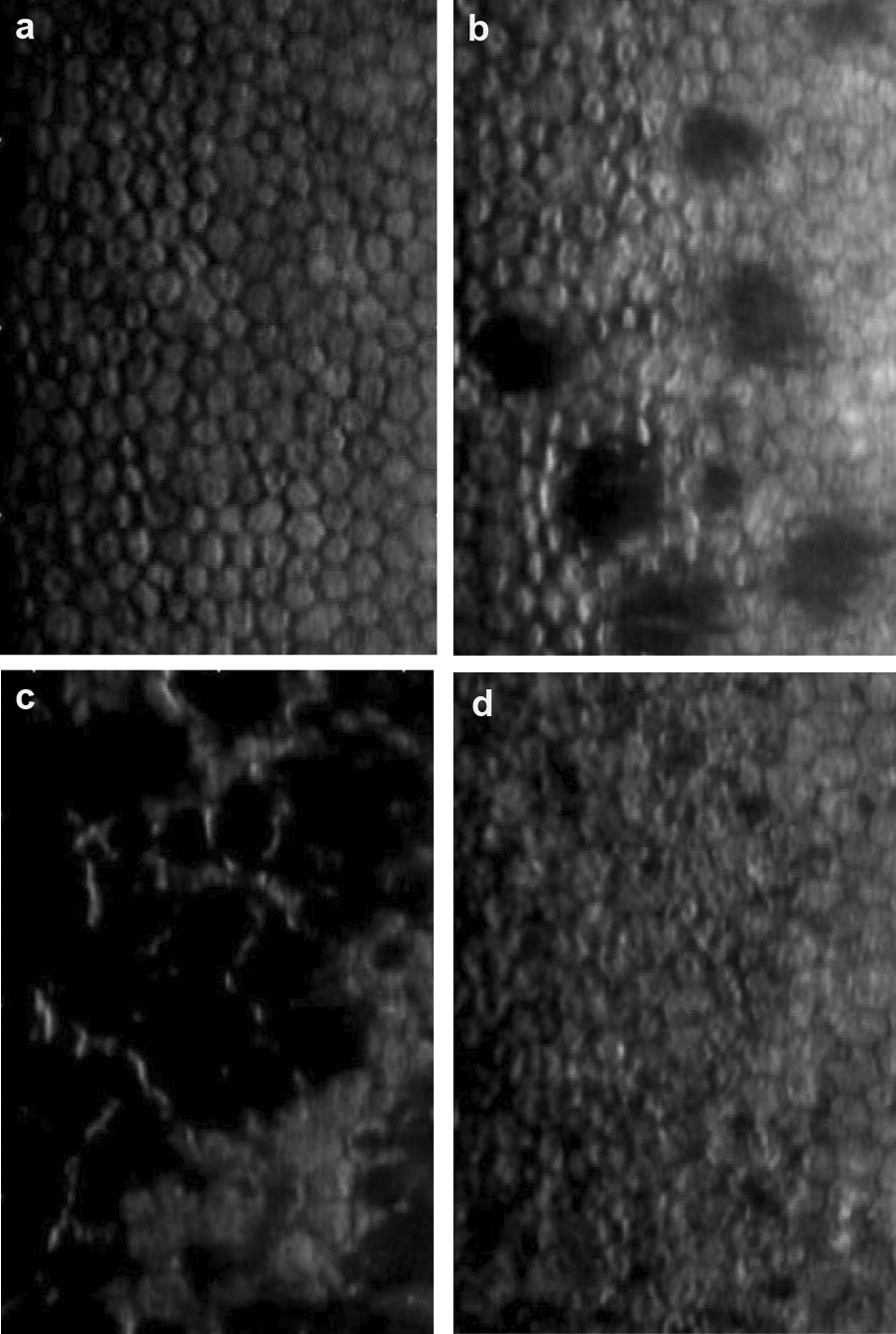


Figure 2 shows the TF-EE and TF-MTFa results obtained with the 3.0 mm pupil and the R, G, B lights, whereas Additional file 1: Fig. S5 shows the same for the 4.5 mm pupil. The polychromatic TF-EEpoly and TF-MTFapoly plots (Fig. 2c and Additional file 1: Fig. S5c), were computed from the experimental R, G, B TF-EE and TF-MTFa curves weighted by the coefficients that would generate (6500 K) W light.
Fig. 2
TF-EE and TF-MTFa measurements obtained in the laboratory experiment for the trifocal diffractive AT LISA tri (a) and FineVision (b) IOLs under R, G, B lights and 3.0 mm pupil; c Polychromatic TF-EE and TF-MTFa curves of both IOLs. TF-EE, through-focus energy efficiency; TF-MTFa, through-focus area under the modulation transfer function; R, red; G, green; B, blue; IOL, intraocular lens
Figure 2 shows that both IOLs have two clear foci, for far and near vision. Between them, EE and MTFa metrics decrease smoothly, yet with a certain trend of recovery for intermediate distances. The curves corresponding to the simulated polychromatic W light are very close to those measured under G (530 nm) illumination.
LCA was measured for each IOL (Fig. 2 and Table 2). Since the on-bench eye model had an achromatic doublet for the artificial cornea, the LCA values can be considered as due to the IOL. LCA was very small and hardly measurable in the far focus of the two IOLs, but it exceeded 1.0 D (negative) in the near focus.
Table 2 Longitudinal chromatic aberration for the far and near IOL foci, obtained from the through-focus energy efficiency values of Fig. 2 (3.0 mm pupil)Quite importantly for our study, the distribution of EE between the lens foci changes remarkably with wavelength (Fig. 2, left column), as it can be expected from the optical path differences introduced by the diffractive step height in wavelengths other than the design [8, 33]. Thus, the R and B curves of the TF-EE differ clearly in opposite directions from the G curve: while the R light greatly benefits the far focus to the detriment of the near, the B light benefits the near focus at the expense of the far. The wavelength dependence of both the optical power and EE influences the contrast and size of the simultaneous images formed at the focal planes, with only one image being focused at any one time with the rest being out-of-focus. This effect is illustrated in Fig. 3 for the AT LISA tri. In the far focus (bottom row), the R image shows the best contrast (highest intensity in the image core and lowest intensity in the surrounding halo), followed by the G image and the B image, the latter showing the worst contrast. In the near focus (top row), however, the energy distribution is the opposite: the R image shows the worst contrast, closely followed by the G image, and the B image shows the best. Moreover, the size of the haloes, determined basically by the out-of-focus images [34], depends on the addition power existing between the far and near foci, which, in turn, depends on the wavelength. Thus, the largest halo corresponds to the highest add power (3.9 D, R light; Fig. 3), whereas the smallest halo corresponds to the lowest add power (2.6 D, B light).
Fig. 3
Red (R), green (G), blue (B) images of a pinhole test at near and far foci for AT LISA tri, 3.0 mm pupil. Energy efficiency (EE) values are provided. In the near focus (top row), the add power (D) is given for R, G, B lights. Front halo images and their halo profiles (right most panel) are presented in logarithmic scale of intensity for the sake of visibility
We calculated the expected VA (logMAR) of the pseudophakic patients under W illumination from the TF-MTFapoly (calculated, in turn, from the R, G, and B TF-MTFa measurements, Fig. 2) taken with a 3.0 mm pupil [3]. Figure 4 shows the expected defocus curves (blue line) for the AT LISA tri and FineVision IOLs. They predict a very good postoperative VA, close to 0.0 logMAR in far vision, which decreases smoothly in intermediate vision with some improvement in near. Defocus is represented at the spectacle plane [35] in Fig. 4. Taken together, a sustained good visual quality (equal or better than 0.2 logMAR) can be expected for the average patient in a depth-of-focus range that goes from infinity to roughly 30 cm from the subject (− 3.0 D defocus). This prediction is intended for comparison with the actual clinical VA outcomes as explained in the clinical experiments.
Fig. 4
Expected visual acuity (VA, logMAR) defocus curves (blue lines) of patients implanted with AT LISA tri (a) and FineVision (b) IOLs under (6500 K) white LED illumination. Actual clinical assessments (mean ± SD) of pseudophakic patients with best distance correction are represented by dots and error bars. In experiment 1, patients enrolled in the AT LISA tri group 1 and FineVision group were assessed in far and (− 3 D) near vision (yellow dots). In experiment 2, patients of AT LISA tri group 2 were further assessed in far and best near vision (red crosses). IOL, intraocular lens; LED, light emitting diode; uc, uncompensated longitudinal chromatic aberration
Clinical experiment 1VA of pseudophakic subjects was tested at two fixed distances—far (0.0 D) and near (− 3.0 D), under successive W, R, G, and B illumination (Fig. 1a, b). Figure 5 shows the average VA outcomes obtained for the FineVision group and the AT LISA tri group 1. The VA results include the joint effects of the EE wavelength dependence of the diffractive IOL and the LCA of the pseudophakic eye. The mean VA outcomes are consistently similar for both trifocal IOLs under all four illuminations although slightly better for subjects with AT LISA tri. Despite the presence of LCA, the VA reached under W light was equal or better than any other colour light in both the far and near vision conditions. The (mean ± SD) values and their statistical significance are given in Tables 3 and 4, respectively. The mean VA values with W illumination are represented with yellow dots in Fig. 4. It is worth remarking the excellent agreement with the predicted values for the AT LISA tri group. The prediction for the FineVision group slightly overestimated the clinical results. In general, the mean VA values are better in far than in near vision for all the illumination conditions, except for the B light (Fig. 5 and Additional file 1: Fig. S6). Moreover, at near distance, the VA with B illumination is as good as the VA achieved with W light, with non-statistically significant difference for both the AT LISA tri (P = 0.57) and FineVision (P > 0.99) groups (Table 4). With R illumination, the visual quality worsens severely in near vision, more than with W and G lights (Fig. 5, Table 3, and Additional file 1: Fig. S6). Note that the good VA achieved at far distance under R light (0.10 ± 0.06 logMAR for AT LISA tri, 0.13 ± 0.06 logMAR for FineVision) drops off dramatically to the worst VA at near (0.38 ± 0.10 logMAR for AT LISA tri, 0.44 ± 0.08 logMAR for FineVision), even worse than the poor VA outcomes obtained at far distance under B light (0.32 ± 0.10 logMAR for AT LISA tri, 0.37 ± 0.09 logMAR for FineVision).
Fig. 5
Mean visual acuity (VA, logMAR) values and standard deviation segments reached by two groups of pseudophakic patients at far and near vision under W, R, G, and B illumination (clinical experiment 1). W, white; R, red; G, green; B, blue
Table 3 Visual acuity (logMAR) values (mean ± SD) obtained in clinical experiment 1 for far (0.0 D) and near (− 3.0 D) visionTable 4 P value for the mean pairwise comparison (Wilcoxon test) of the visual acuity obtained under W, R, G, B lights at far (0.0 D) and near (− 3.0 D) vision for the (AT LISA tri / FineVision) IOLsClinical experiment 2This experiment aims to bring to light the effects of two separate factors: one, the EE wavelength dependence of the IOL foci (determined by the operative diffractive orders) and, the other, the LCA of the pseudophakic eye. We want also to evaluate their relative influence on either far and near vision, as well as to emphasize the possible differences in comparison with the natural phakic human vision.
The experiment consisted of four stages (Fig. 1c) in the VA assessment: two concerned far vision with uncompensated (uc) LCA (stage 1) and compensated (c) LCA (stage 2), and the other two concerned near vision with uncompensated (uc) LCA (stage 3) and compensated (c) LCA (stage 4). For the LCA compensation of every subject in each illumination condition, we used additional trial ophthalmic lenses, with the (± 0.25 D) uncertainty assumed in ordinary clinical examinations.
Note that stage 1 coincided with the first part of the experiment 1, but it was applied to a new group of subjects (namely, AT Lisa tri group 2). In stage 3 (near vision with uncompensated LCA), we determined the refractive addition for the best near distance corrected VA under W light and this refractive addition was kept unchanged with the other illuminations. LCA was individually compensated under R, G, B lights at far vision in stage 2 and at near vision in stage 4.
For the sake of comparison, we present the results (mean ± SD) of the VA outcomes for the AT LISA tri groups 1 and 2 in Fig. 6 and Table 5. The VA values of the AT LISA tri group 1 were obtained with uncompensated (uc) LCA and constant addition of − 3.0 D at near vision.
Fig. 6
Mean visual acuity (VA, logMAR) values and standard deviation segments reached by the AT LISA tri groups at far and near vision under W, R, G, and B lights in the clinical experiments 1 and 2. W, white; R, red; G, green; B, blue; uc, uncompensated longitudinal chromatic aberration (LCA); c, compensated LCA
Table 5 Visual acuity (logMAR) values (mean ± SD) obtained in clinical experiment 2 for far and near visionIn far vision, the AT LISA group 2 (uc) showed, on average, slight hypermetropia under R light (0.26 ± 0.15 D) and moderate myopia under B light (− 0.75 ± 0.11 D). This chromatic difference of refraction was due to the LCA of the pseudophakic eye as a whole and was still similar to the natural LCA of a phakic eye [5]. After proper correction with ophthalmic lenses, they improved their far VA under these colour lights [Fig. 6 and Table 5, group 2 (c)]. Therefore, under R light and with correction of 0.26 ± 0.15 D, they improved from 0.12 ± 0.07 logMAR to 0.03 ± 0.05 logMAR, matching VA under W light; and, more importantly, under B light and with correction of − 0.75 ± 0.11 D, they improved from 0.34 ± 0.10 to 0.08 ± 0.03 logMAR.
The AT LISA group 2 required − 2.53 ± 0.11 D at the spectacle plane (AT LISA has + 3.33 D design add power at the IOL plane) for best near vision under W light. The mean VA values under W light of group 2 (uc) in far and near vision are in excellent agreement with the expected values predicted from the MTF measurements in the optical experiment, as it can be seen in Fig. 4a.
Group 2 (c) with LCA compensated near vision showed worse VA outcomes in general than uncompensated far vision, except for—and this fact is quite remarkable (explained in the discussion section)—under B light. Near VA under B and W lights matched to 0.15 ± 0.06 logMAR (no matter the compensation). In fact, there was no need for further LCA correction in near vision. Only 3 (15%) individuals out of 20 eyes tested experienced a tiny improvement in their VA under R light after a slight ophthalmic correction of − 0.25D, which, in turn, falls within the uncertainty value. The mean VA at near under R light worsened drastically to 0.35 ± 0.09 logMAR and kept almost unchanged (0.34 ± 0.09 logMAR) despite the allowance for compensation. Table 6 contains the P value for the mean pairwise comparisons. It is worth noting that the repeatability of the VA results obtained for the AT LISA groups 1 and 2 (uc) in far vision and similar illumination: the differences between the far VA pairs did not exceed 0.02 logMAR (Table 5). However, the discrepancy between the AT LISA groups 1 and 2 (uc) was larger in near vision, with differences up to 0.07 logMAR for G light (Table 5), very likely because near vision was set at − 3.0 D for the subjects of group 1 whereas, for group 2 (uc), it was determined from the best individual near distance under W light (− 2.53 D on average). Overall, no significant statistical differences were eventually obtained between groups 1 and 2 (uc), neither in far nor in near vision, for all the four illumination conditions (Table 6).
Table 6 P value for the mean pairwise comparison for the visual acuity obtained under W, R, G, B lights at far and near vision for the AT LISA groupsThe comparison between groups 2 (uc) and (c) is more revealing and powerful. LCA compensation turned out to be significant (P < 0.05) in far vision under R light and, particularly important, under B light, for which VA improved very remarkably from 0.34 ± 0.10 to 0.08 ± 0.03 logMAR. No significant improvement with LCA compensation can be reported, however, in near vision under any illuminant (P > 0.05).
We acknowledge as a possible limitation in the comparison of groups 2 (uc) and (c) that data from both eyes of each subject were used in the clinical experiment 2. This fact artificially reduces the variance between data points and may increase the risk of Type I error (false positive). This would be particularly problematic if the P values were near the 0.05 cut-off which is not the case (see Table 6, second row).
留言 (0)