Study population
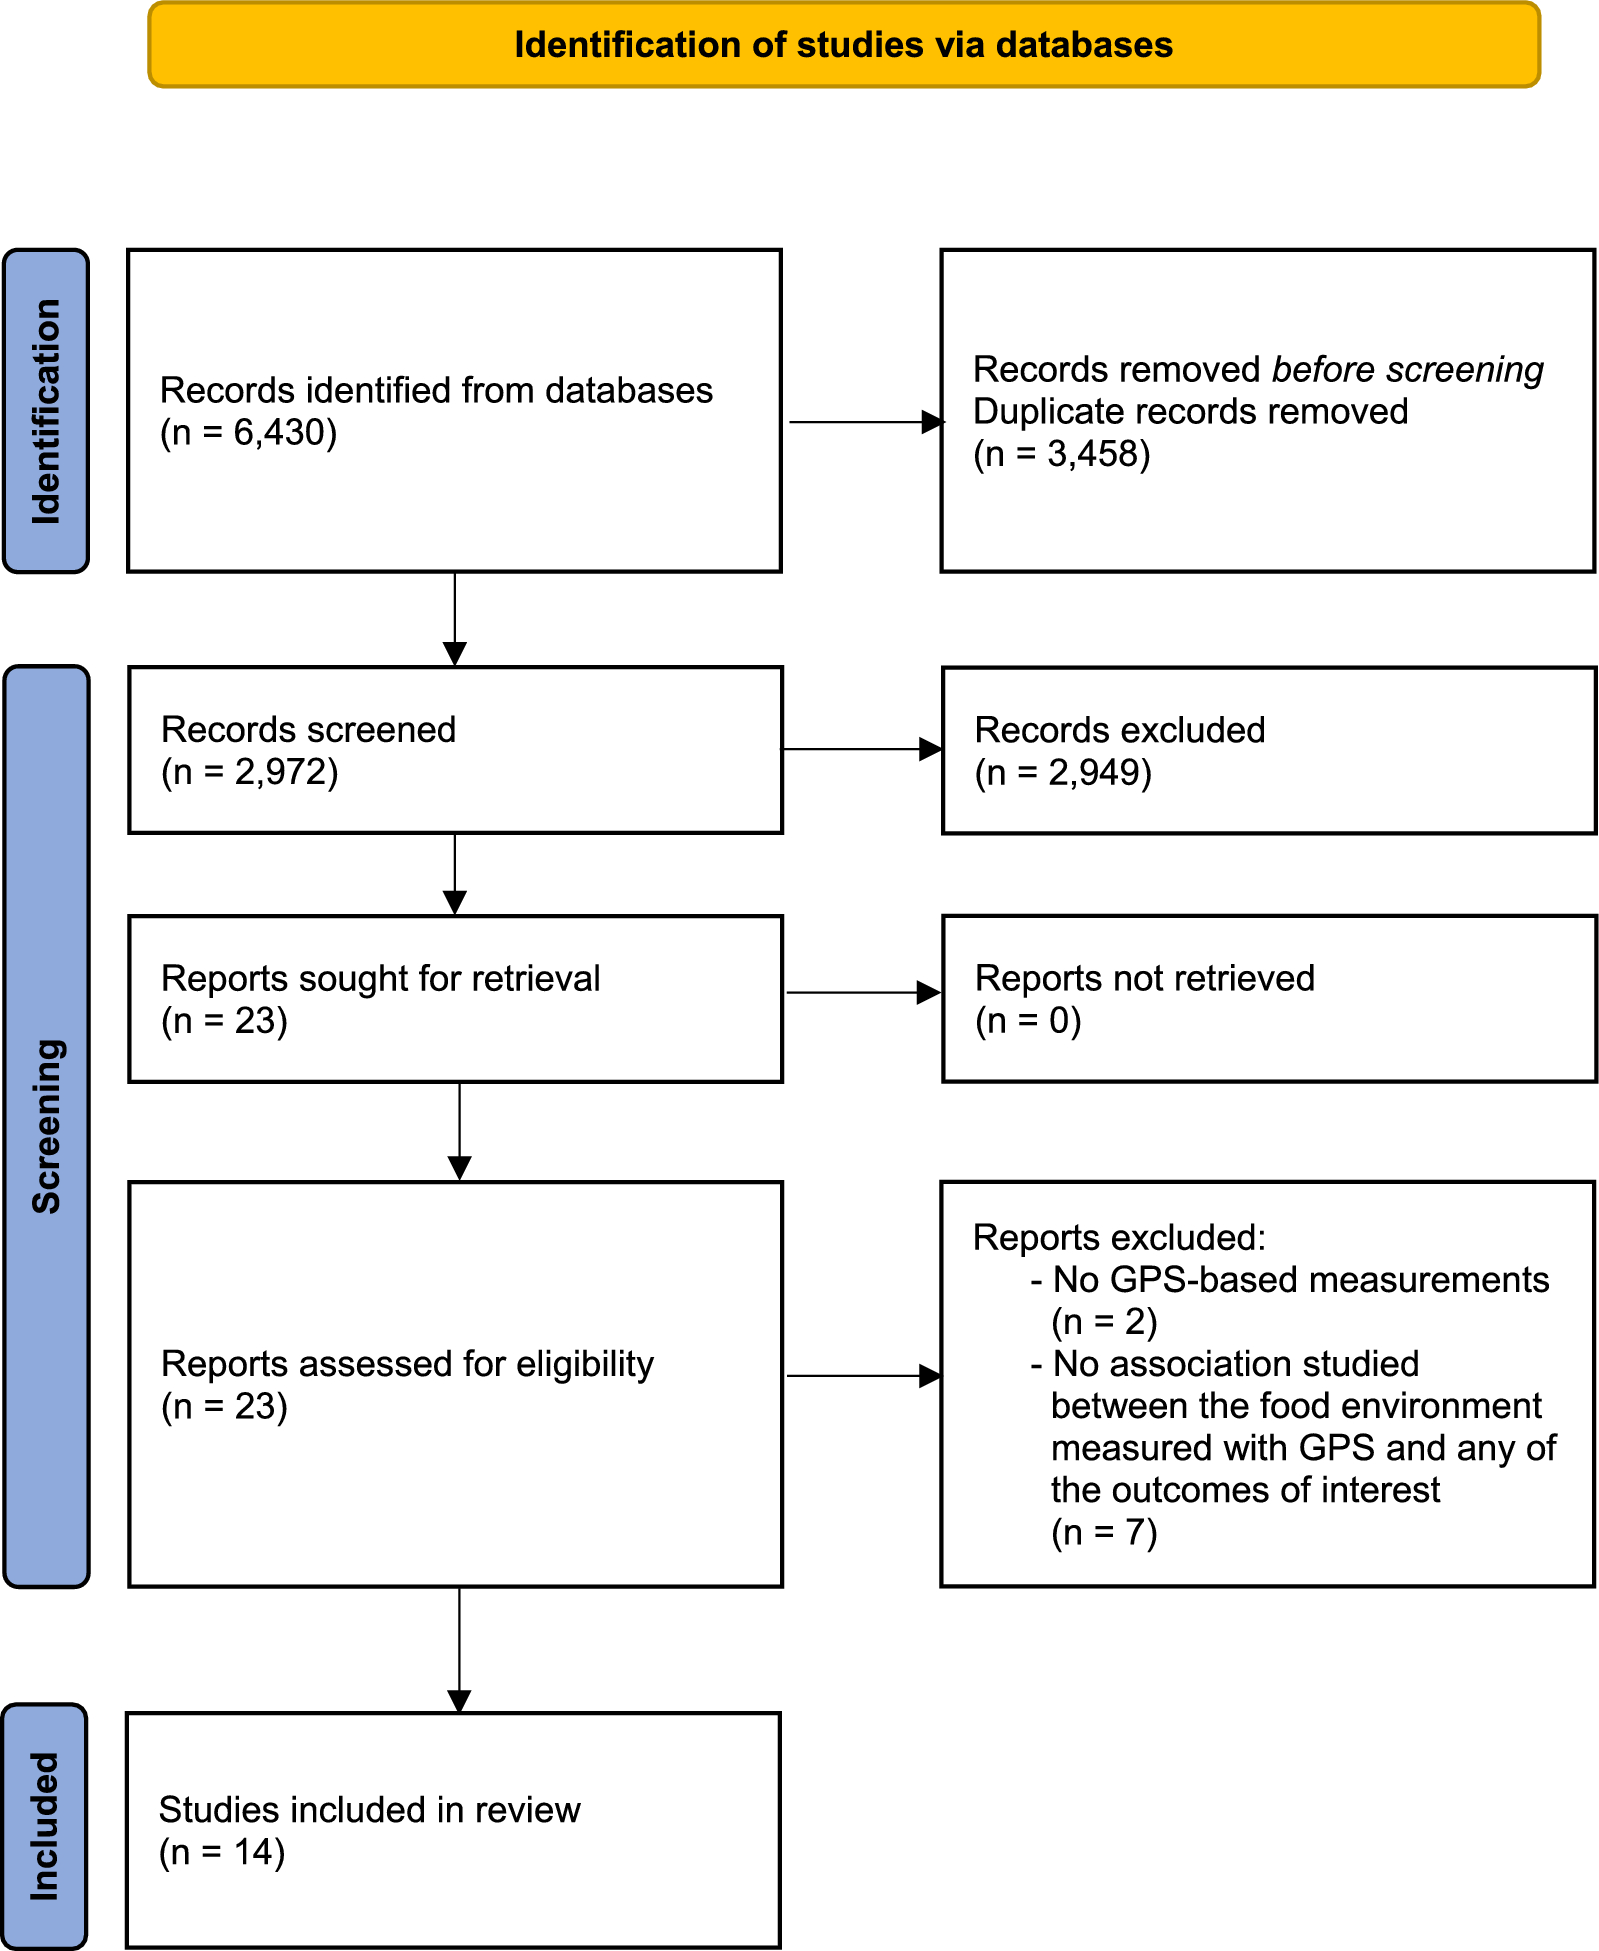
The Chinese Multi-provincial Cohort Study (CMCS) is an ongoing, prospective, population-based cohort study [17, 18]. Initially, 16,811 participants aged 35–64 years were recruited from 16 centers in 11 provinces/province-level regions of China from 1992 to 1993 using a multistage sampling method. First, the centers were selected nonrandomly with the major requirements of having taken part in the Sino-Monitoring Trends and Determinants in Cardiovascular Disease (Sino-MONICA) Project [19] and being able to conduct the study. Among these centers, 12 centers were in urban areas and 4 centers were in rural areas. Then, a stratified random sampling was performed for each gender and age group (35–44, 45–54, and 55–64 years). In 2007–2008, 5961 individuals from seven centers in six provinces/ province-level regions participated in the re-examination. Due to the availability of data on PA facilities, participants from six urban centers of five provinces/province-level regions (Beida center and Shougang center in Beijing, Zhongshan center in Shanghai, Shenyang Angang center in Liaoning, Chengdu Huaxi center in Sichuan, and Daqing center in Heilongjiang) were enrolled in the study. Eventually, 4658 participants were included in this analysis after excluding individuals with established CVD at baseline (n = 404), missing baseline covariate data (n = 158), or identifiable residential addresses (n = 120) (See Additional file 1: Figure S1).
The study was approved by the Ethics Committee of Beijing Anzhen Hospital, Capital Medical University. Written informed consent was obtained from all participants. All research adhered to the tenets of the Declaration of Helsinki.
Exposure assessment
To identify neighborhood PA facilities, we used point of interest (POI) data on the open platform of AutoNavi Map API in 2010. The data included basic information for each POI, such as code, location name, address, latitude, longitude, brand, and business categories, with latitude and longitude being the core attributes of the POI data. The three-level classification standard for a POI in AutoNavi Map was adopted for data classification. In the database, all PA facilities were objectively registered under different categories. As PA facilities, PA/recreational establishments were considered, including gyms, fitness centers, swimming pools, skating rinks, golf courses, and skiing facilities.
We geocoded the residential address of each participant at baseline into spatial coordinates and imported these coordinates into the geographic information system software. A 500-m buffer zone was calculated around each individual’s residence, as it is within the walking distance [20]. Availability of PA facilities, defined as both the presence and the density of PA facilities, was measured within the 500-m buffer zone. The presence of PA facilities was defined as having at least one PA facility in the buffer zone, while the density of PA facilities was defined as the total number of PA facilities within the buffer zone. A 1000-m buffer zone, which was used in previous research [21], was also used for sensitivity analysis for the density of PA facilities, but not for the presence indicator, because only a few participants (n = 266) had no PA facilities within a 1000-m buffer zone.
Covariates
Demographic characteristics, smoking status, alcohol consumption, medical history, and medication history were collected using a standardized questionnaire. Individual-level demographic characteristics included age, sex, education (college or above vs. below college), occupation (intellectuals vs. non-intellectuals), and household monthly income per capita (0–3000 vs. > 3000 yuan). Intellectual occupations included professional or administrative staff, while non-intellectual occupations included workers, farmers, or unemployed. Smoking was defined as consumption of one or more cigarettes per day for at least 1 year. Current drinking was defined as alcohol consumption at least once a week. Height, weight, and blood pressure (BP) data were obtained by trained physicians during a physical examination. Body mass index (BMI) was calculated as weight in kilograms divided by height in meters squared. Overweight/obesity was defined as BMI ≥ 24 kg/m2 [22]. BP was measured three times after 5 min of rest using a calibrated sphygmomanometer, and the average of the second and third readings was recorded. Hypertension was defined as measured systolic BP ≥ 140 mm Hg and/or measured diastolic BP ≥ 90 mm Hg or receipt of antihypertensive medications within 2 weeks. Diabetes was defined as fasting blood glucose ≥ 7.0 mmol/L or previous physician diagnosis. Venous blood samples were collected after at least 8 h of fasting. Levels of fasting blood glucose (FBG) and total cholesterol (TC) were measured on the sample collection day as described previously [18]. Township-level population density for each individual’s residence was determined as the number of people per square kilometer. The township is the smallest administrative unit in China. The means of area and population size of the townships where the study population located were 31.0 km2, and 132,493 persons. The distance to the major road was measured by the Euclidean distance from each participant’s residential address to the major road [23]. Leisure-time PA was recorded as four categories: no PA, mild PA, moderate or high intensity PA for > 30 min on 1–2 days per week, and moderate or high intensity PA for > 30 min on 3 or more days per week in leisure time. In current analyses, we combined the top two categories with moderate or high intensity leisure-time PA for > 30 min at least once a week, and converted leisure-time PA into a binary variable (yes or no).
Outcome assessment
All participants were followed up for incident CVD, coronary heart disease (CHD), and stroke every 1–2 years by active interviews, supplemented by linkage to local vital registration systems and hospital information systems. Acute CHD events included non-fatal acute myocardial infarction and all coronary deaths. Acute stroke events included subarachnoid hemorrhage, intracerebral hemorrhage, or cerebral infarction. Diagnostic criteria for CVD events were based on the World Health Organization-MONICA project and modified according to advances in diagnostic technology for myocardial infarction [18, 19, 24]. All reported events were adjudicated by a panel of physicians that included cardiologists and general physicians.
Sample power estimation
The statistical power was estimated respectively based on the two indicators of availability of PA facilities in 500-m buffer.
(1) For the presence indicator of PA facilities in 500-m buffer.
In this study, presence of PA facilities was significantly associated with a 20% lower risk (HR = 0.80, 95%CI 0.65–0.99) of incident CVD compared with no nearby facilities. The number of CVD cases during the follow-up was 518. The proportion of participants exposed to PA facilities was 78.4%. Assessing an alpha (probability of type I error) of 0.05, the actual sample size of 4658 enabled a statistical power of 0.999.
(2) For the density indicator of PA facilities in 500-m buffer.
In our study, density of PA facilities ≥ 3 was significantly related to a decreased risk of incident CVD (HR = 0.72, 95% CI 0.56–0.92). With an alpha of 0.05 and the number of cases of 518, the actual sample size of 4658 provided a statistical power of 0.999.
Statistical analysis
Continuous variables were presented as mean ± SD for normally distributed variables or median and interquartile range for non-normally distributed variables. Categorical variables were expressed as number and percentage. The baseline characteristics of the study participants were compared using the presence indicator for PA facilities in the 500-m buffer zone.
Time-dependent Cox proportional hazards regression models were performed to estimate the hazard ratio (HR) and 95% confidence interval (CI) of incident CVD with availability of PA facilities. The proportional hazards assumption was tested by evaluating the Schoenfeld residuals [25]. Multivariate analyses included adjustment for variable × follow-up time (log function of time) interactions to account for time-varying confounders that were against the proportional hazards assumption [26]. We entered the indicators for PA facilities as categorical variables by defining their categories based on either counts or presence and absence of PA facilities. The cut-off values of categorical variables for the density indicators within each level were set in a way that ensured sufficient numbers of individuals remained at each level. An unadjusted model (model 1) was performed first. In Model 2, we adjusted for possible confounders including sex, age, education, occupation, household income, smoking, current drinking, levels of BMI, systolic BP, FBG, and TC, use of antihypertensive, glucose-lowering, and statin drugs, and population density. In Model 3, we further adjusted for leisure-time PA. Subgroup analyses were performed for baseline demographic characteristics, traditional CVD risk factors, and leisure-time PA. The HRs between subgroups were compared using the Z-test [27]. We examined the mediation role of leisure-time PA on the association of the presence of PA facilities in 500-m buffer with CVD and stroke.
Additional sensitivity analyses were performed in this study as follows: (a) using the 1000-m buffer zone; (b) excluding participants who experienced events during the first year of follow-up within the 500-m buffer zone (n = 25); (c) further adjusting for distance to the major road from each participant’s residence based on the multivariate models (Model 3); (d) exploring the association of the availability of fitness centers (the main type of PA facilities) with CVD incidence; (e) using the shared frailty models.
Statistical analyses were performed using R software (version 4.1.1). Two-tailed values of P < 0.05 were considered to indicate statistical significance.


留言 (0)