
Remember me
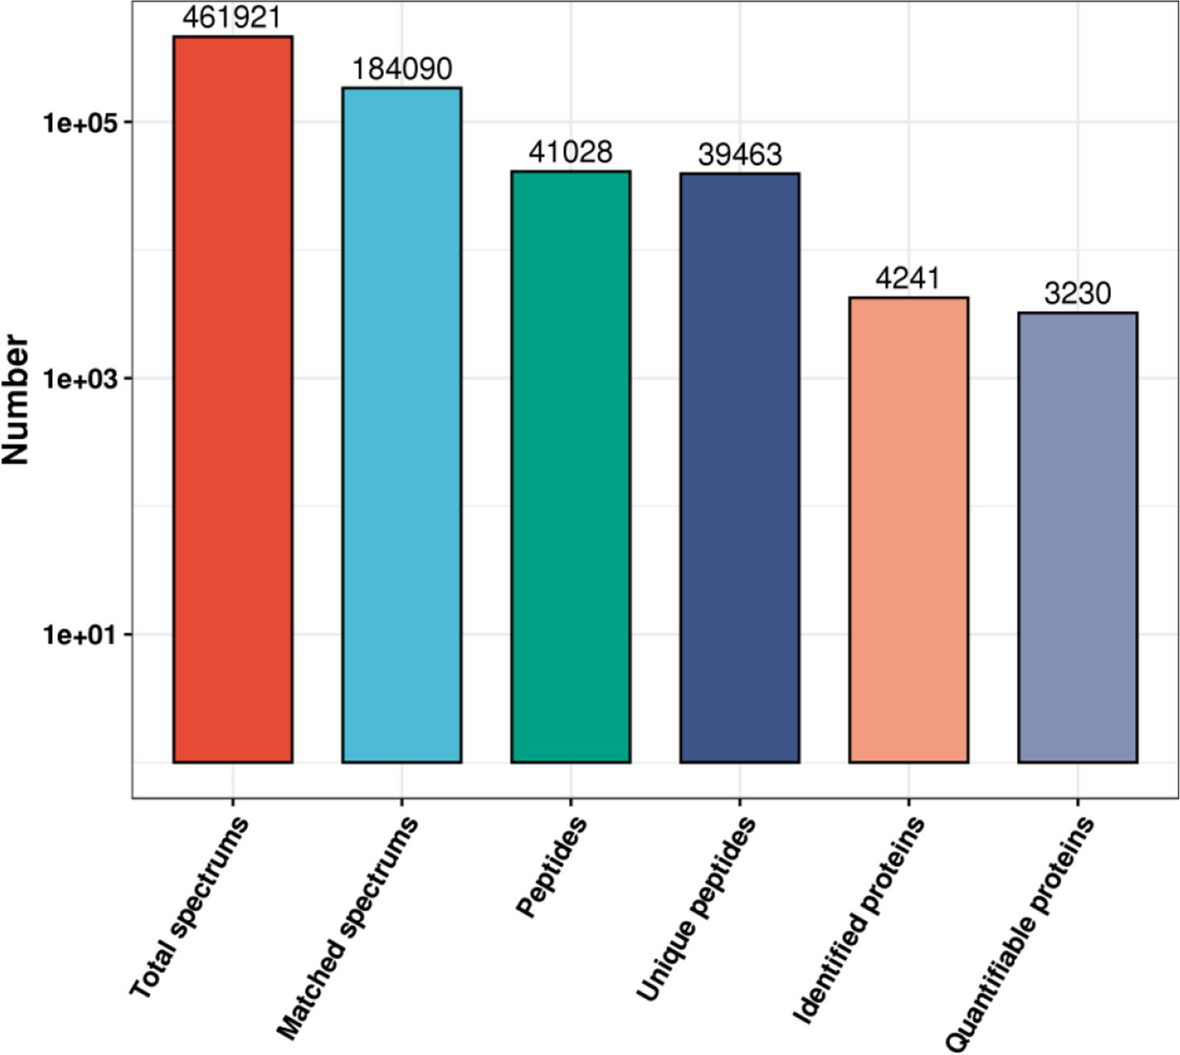


In total, 462,118 spectrograms were obtained by MS. The number of available effective spectrograms was 203,221, and 44.0% of them were utilized. A total of 41,119 peptides were identified by spectrogram analysis, among which 39,679 were specific peptide segments. A total of 4,147 proteins were identified, of which 3,290 were quantifiable (Fig. 1).
Fig. 1
Overview of the mass spectrometry results. Bar plot summarizing the detected peptides and proteins in H1N1-C group and pre-MENK group
Quality control of dataQuality control data showed most peptides were distributed in the range of 7–20 amino acids, the length distribution of peptides identified by mass spectrometry met the quality control requirements (Fig. 2A). Most proteins correspond to more than two peptides. In quantification, a protein corresponding to multiple specific peptides was conducive to increase the accuracy and credibility of the quantitative results (Fig. 2B). Most proteins had coverage below 30%. In the shotgun strategy of mass spectrometry, the mass spectrometry preferentially scanned peptides with higher abundances. Therefore, there was a positive correlation between protein coverage and abundance in the sample (Fig. 2C). The molecular weight of the identified proteins was uniformly distributed in different stages (Fig. 2D). The quality of the results met an acceptable standard based on the peptide length distribution, number distribution, coverage distribution, and molecular weight distribution.
Fig. 2
Peptide distribution. A Peptide length distribution. B Peptide number distribution. C Protein coverage distribution. D Protein molecular weight distribution
DEP analysesCompared with the H1N1-C group, 215 DEPs were identified in the pre-MENK group: 164 proteins had upregulated expression and 51 proteins had downregulated expression with fold change over 1.5 fold (Fig. 3).
Fig. 3
Identification of DEPs between H1N1-C group and pre-MENK group. A The total number of upregulated and downregulated DEPs. B Volcano plot of the identified DEPs between H1N1-C group and pre-MENK group. The red dots denote upregulated DEPs, the green dots denote downregulated DEPs, and the gray dots denote unchanged proteins
Enrichment analyses of DEPsTo ascertain if DEPs had significant enrichment in specific functional categories, we conducted functional-enrichment analysis of DEPs based upon GO and KEGG databases. Notably, the DEPs were significantly enriched for several relevant GO terms, including cellular process, response to stimulus and binding (Fig. 4). The enriched KEGG pathways were shown in Fig. 5. Among them, several macrophage polarization-related pathways were enriched, such as chemokine signaling pathway (mmu04062), cytokine-cytokine receptor interaction (mmu04060) and viral protein interaction with cytokine and cytokine receptor (mmu04061). The main pathway of inducing macrophage polarization was modulated by the interaction with cytokine and cytokine receptor, including CCL3, CCL4 and TNFR2 (Fig. 6).
Fig. 4
GO analysis for the identified DEPs. The DEPs were annotated into three categories based on GO terms, including biological processes, cellular components, and molecular functions. A GO enrichment analysis of the upregulated DEPs. B GO enrichment analysis of the downregulated DEPs
Fig. 5
KEGG pathway enrichment analysis of DEPs. Bubble diagrams displaying KEGG pathways for signifificantly enriched upregulated. A and downregulated. B DEPs. The Y axis showed the IDs and names of enriched pathways, and the X axis showed the converted log2 fold enrichment. The size of the bubbles described the number of DEPs in pathway
Fig. 6
KEGG enrichment pathway. Viral protein interaction with cytokine and cytokine receptor (mmu04061). The red color represents the up-regulated protein
Furthermore, receptor mediated endocytosis and phagosome formation-related pathways were phagosome (mmu04145) and complement and coagulation cascades (mmu04610), both of these pathways indicated that complement receptors and Fc receptors played a crucial role in receptor-mediated endocytosis. In Fc receptor-mediated endocytosis, downstream STX 13, STX7, and Rab7 were involved, while αvβ5 and αvβ3 were involved in complement-mediated endocytosis (Fig. 7).
Fig. 7
KEGG enrichment pathway. Phagosome (mmu04145). The red color represents the up-regulated protein, green color represents the down-regulated protein
The enrichment analyses suggested that pre-MENK regulated macrophages by macrophage polarization and receptor-mediated endocytosis.
Hierarchical clustering analysisAccording to the degree of fold change, DEPs were divided into four groups: “severely downregulated” (Q1, FC ≤ 0.5), “mildly downregulated” (Q2, 0.5 < FC ≤ 0.667), “mildly upregulated” (Q3, 1.5 < F ≤ 2.0), and “severely upregulated” (Q4, FC > 2.0) (Fig. 8A).
Fig. 8
Hierarchical cluster analysis for the DEPs. A The significant thresholds for the DEPs were Fold change > 1.50 or < 0.67 and P < 0.05. The DEPs were divided into four groups from Q1 to Q4 according to the degree of FC. B The Q categories for KEGG pathways. C The Q categories for protein domain. D The Q categories for biological process. E The Q categories for cellular component. F The Q categories for molecular function. The red color indicates stronger enrichment. The blue color indicates weaker enrichment
DEPs with severely upregulated expression were enriched for the “phagosome, complement and coagulation cascades”, “viral protein interaction with cytokine and cytokine receptor”, “cytokine–cytokine receptor interaction”, and “chemokine signaling pathway” (Fig. 8B), which were highly related to inflammatory cytokines, cytokine receptor and chemokines released by macrophages infected with influenza virus. In the clustering analysis for the protein domain, some DEPs with severely upregulated expression were enriched for “pyridine nucleotide-disulfide oxidoreductase”, and “small cytokines (integrin/chemokine), interleukin-8 like” (Fig. 8C). In the clustering analysis using the GO database, DEPs with severely upregulated expression of biological processes were enriched for “neutrophil chemotaxis”, “positive regulation of leukocyte migration”, “leukocyte chemotaxis”, and “leukocyte migration” (Fig. 8D). The clustering analysis of protein domains and biological process illustrated that chemokines induced the migration and activation of leukocyts, which may attribute to the mechanism of MENK up-regulating the antiviral function of macrophages. The main cellular components to be enriched were “endoplasmic reticulum” and “specific granule membrane” (Fig. 8E). The main molecular functions to be enriched were “complement component C3b binding”, “CCR1 chemokine receptor binding”, and “complement binding” (Fig. 8F), which indicated that complements were effective molecules for MENK to regulate the function of macrophages. We synthesized the hierarchical clustering analysis, and found that cytokines, cytokine receptors and chemokines, as well as complement were the main means of MENK to promote macrophage immune response, which were consistent with the results of enrichment analyses of DEPs.
Analyses of protein-interaction networksAccording to confidence score > 0.7 (high confidence), the differential protein interactions were extracted from 215 differential proteins. Visualization of the differential protein interaction network was performed using the R package "networkD3" tool. In order to clearly demonstrate the protein–protein interaction, we screened proteins with the closest interaction relationship and mapped the protein interaction network. In Fig. 9, circles represent differential proteins, and green color represented downregulated proteins, red color represented upregulated proteins. PPI showed close protein interactions with CCL3, CCL4, and TNFR2 in the cytokine-cytokine receptor pathway, and with CR3 (Itgam), upstream and downstream relation among FcγR, Rab7, STX13 and STX7 in the receptor-mediated endocytosis pathway. Protein interaction was also found among CCL3, TNFR2, FcγR and CR3. These proteins were also shown in the KEGG pathway map of viral protein interaction with cytokine and cytokine receptor (mmu04061) and phagosome (mmu04145). The visualization results of PPI are further illustrated that the targets of MENK on macrophages were related to chemokines and receptors with the function of mediating phagocytosis.
Fig. 9
PPI network of the DEPs. Circles represent differential proteins, and different colors represent the differential expression of proteins. The darker the color, the larger the fold of difference
Molecular dockingBased on the data of PPI, and combined with KEGG pathway(mmu04061 and 04145), we evaluated the interaction between MENK and 8 small-molecule core proteins. CCL3, CCL4, TNFR2, CR3, FcγR, Rab7, STX13 and STX7 proteins crystal structures were downloaded from the PDB database, improved by PyMOL, and molecular docking of the target proteins to the related ingredients was performed in AutoDock. Affifinity was the score used by the software to calculate the binding ability. It is generally believed that affinity < -7 kcal/mol indicated stronger binding activity, -7 < affinity ≤ -4 kcal/mol indicated moderate binding activity, affinit > -4 kcal/mol indicated week binding activity [18]. After calculation, it was found that the binding activity of MENK with core proteins were CCL4(-8.88), CCL3(-5.02), TNFR2(-5.86), CR3(-6.7), FcγR(-4.99), Rab7(-6.83), STX13(-4.77) and STX7(-5.06), respectively. Finally, PyMOL software was used to calculate the length of hydrogen bonds, improve and export the pictures. CCL3, CCL4, TNFR2, CR3, FcγR, Rab7, STX13 and STX7 were successfully docking with MENK (Fig. 10 A-H). In addition, we found the hydrogen bonds formed between molecules and represented by yellow dotted lines in the diagrams. These results indicated that the target of MENK fuction may be CCL3, CCL4, TNFR2, CR3, FcγR, Rab7, STX13 and STX7.
Fig. 10
Molecular docking simulation diagram. A MENK-CCL3. B MENK-CCL4. C MENK-TNFR2. D MENK-CR3. E MENK-FCγR. F MENK-Rab7. G MENK-STX13. H MENK-STX7. The MENK is orange stick models and the protein molecules at the docking site are represented as violet stick models. The connected hydrogen bonds are indicated by yellow dotted lines
Comments (0)