
記住我


Exposure to occupational noise is one of the most common occupational risks worldwide.1 It is estimated that approximately 360 million people worldwide experience severe hearing loss.2 More than 6% of the world’s population experiences disabling hearing loss, which could detrimentally affect their life and overall health.3 In addition, it may be more serious in China because of 792 million occupational population.4
As well as inducing adverse effects on the auditory system, occupational noise exposure has also been associated with sleeping disorders5 or hypertension.6 Long-term exposure to relatively high levels of occupational noise causes sustained damage to hair cells and auditory nerve conduction, which is considered to be the key cause of hearing loss.7 Noise-induced hearing loss could bring a lot of inconvenience to people in later life and cause a large social and economic burden.8 Despite noise-induced hearing loss is everlasting and inevitable, it is still avoidable.9
The pathogenesis of occupational noise-induced hearing loss is similar to that of other diseases, and its pathogenesis shows a complex interaction between genetic factors and environmental factors. In addition, individual demographic factors such as age, sex, body mass index (BMI), chronic diseases (eg, hypertension and diabetes mellitus) may influence the degree of hearing loss.10–14 Similar to the immune mechanism of hypertension, many immune molecules are also related to cochlear injury.15,16 Hypertension has become a global health challenge, and there are approximately 28.6% of adults who had hypertension in China.17,18 As population aging, the association between hypertension and hearing loss has been paid more attention in recent years. However, the results of the published reports were inconsistent.
Bilateral high-frequency hearing loss (BHFHL) is a well-known biomarker for exposure to loud occupational noise. Some studies have reported that BHFHL is related to cumulative occupational noise exposure, and BHFHL can be used as an early biomarker of actual personal occupational noise exposure,19–21 but others do not support a uniform relationship.22,23 The association between blood pressure and BHFHL has rarely been evaluated among different hypertension classifications and evidence is limited in China.24–26 In addition, because of the high prevalence of hypertension among Chinese occupational workers, the combined impact of blood pressure and occupational noise exposure on BHFHL is noteworthy.27,28 Therefore, we conducted a cross-sectional study to examine the independent and combined effects of elevated blood pressure and occupational noise exposure on BHFHL in a large size of middle-aged Chinese population, especially to explore the association among different hypertension classifications.
METHODS Study PopulationIn this cross-sectional study, participants were recruited from the cross-sectional survey of key occupational diseases in Chongqing, China, in 2021. The main content of the key occupational disease monitoring project is to estimate the health status of industrial workers in Chongqing by collecting the information of all workers exposed to coal dust, silica dust, asbestos, benzene, lead, noise, and brucella every year. In the face-to-face survey, basic information, occupational history, and health-related issues were investigated, such as age, sex, occupational hazard exposure history, and disease symptoms. During the physical examination, the medical staff carried out various physical examinations, such as blood pressure, hematuria routine examination, and hearing test.
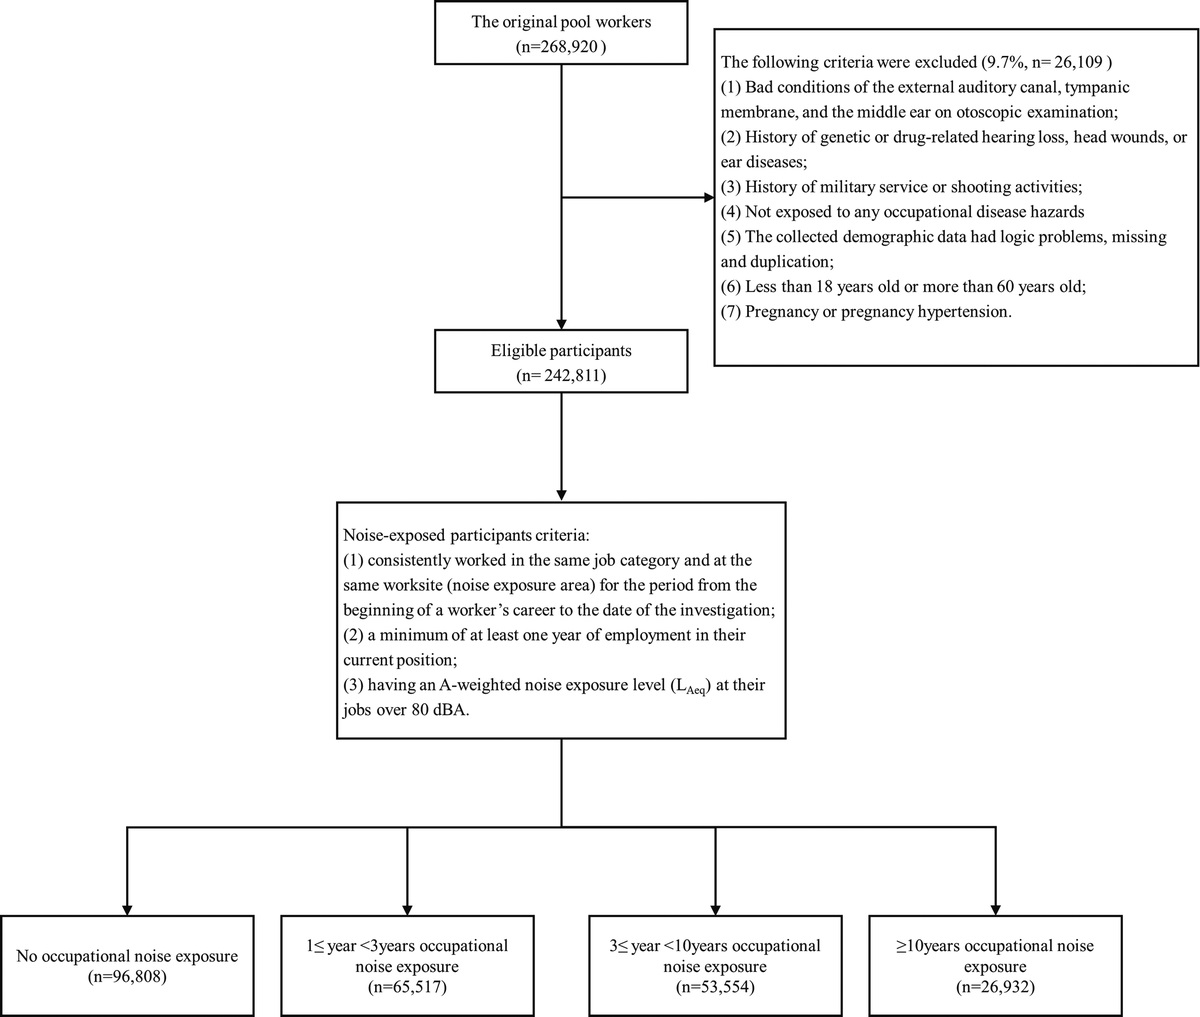
This cross-sectional survey enrolled a total of 268,920 workers under accurate audiometric testing. All participants signed an informed consent form. For inclusion in the study, all participants had to satisfy the following three criteria: (1) no history of genetic or drug-related hearing loss, head wounds, or ear diseases; (2) no history of military service or shooting activities; and (3) good conditions of the external auditory canal, tympanic membrane, and the middle ear on otoscopic examination. The exclusion criteria are as follows: (1) bad conditions of the external auditory canal, tympanic membrane, and the middle ear on otoscopic examination; (2) history of genetic or drug-related hearing loss, head wounds, or ear diseases; (3) history of military service or shooting activities; (4) not exposed to any occupational disease hazards; (5) the collected demographic data had logic problems, missing, and duplication; (6) younger than 18 years or older than 60 years; (7) pregnancy or pregnancy hypertension.
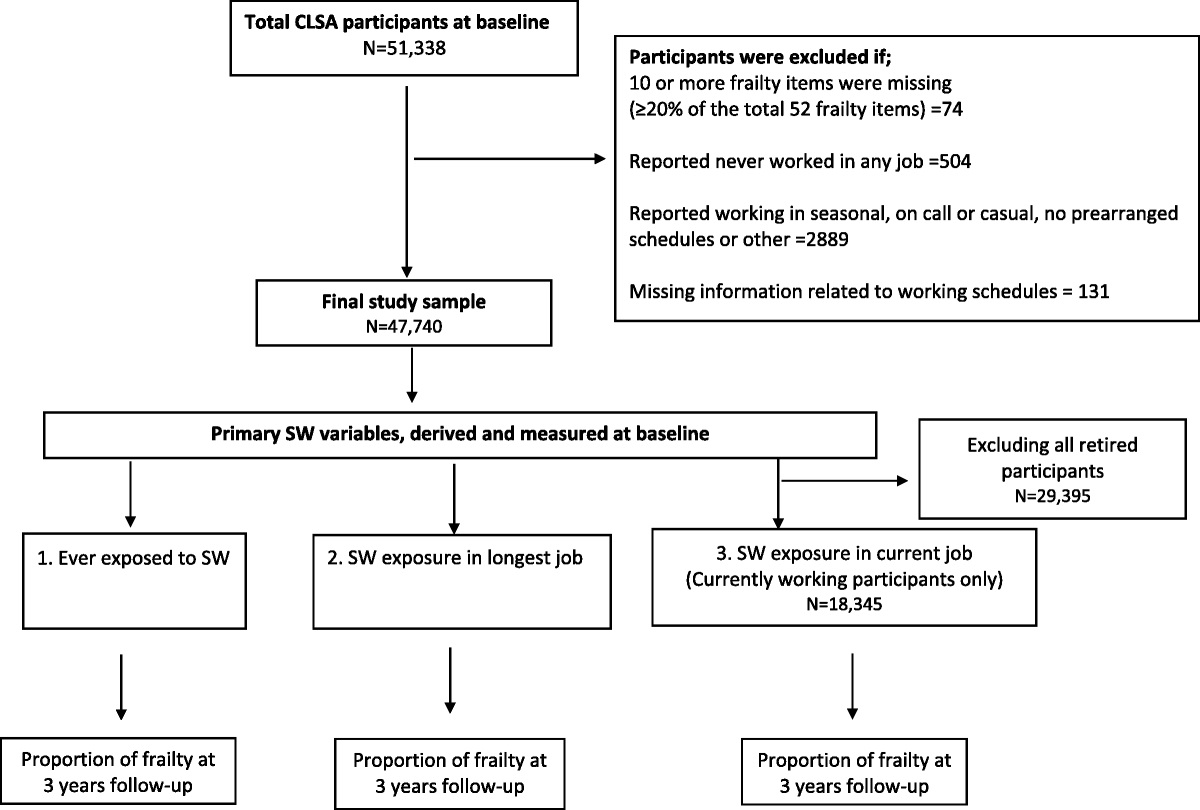
As a result, a total of 242,811 participants were included from the original pool of 268,920 workers. The median age of these participants was 39.25 years (25th percentile to 75th percentile of the age (P25–P75), 29.75–48.92 years), divided into 187,393 males (median age, 37.50 years; P25–P75, 28.58–49.25 years) and 55,418 females (median age, 42.00 years; P25–P75, 34.33–48.33 years). Before the interview and medical examination, all the participants had read the informed consent form. The flow chart of study population selection is shown in Figure 1.
 FIGURE 1:
 The flow chart of study population selection.
Audiometry and Ascertainment of BHFHLParticipants were asked by health technicians to collect detailed hearing exposure information, including ear diseases, ototoxic drug use, ear infection history, and occupational noise exposure history. According to the Chinese Diagnostic Standard for Occupational Noise Deafness (GB 49-2014), medical and health technicians use audiometers to conduct hearing tests in sound insulation rooms of different hospitals. The hearing test equipment of each occupational health examination institution has passed the calibration of the National Institute of Measurement and Testing Technology, and the error between the equipment is controlled within 3%. The workers were free from the occupational noise exposure and at least rest 12 hours, then both left and right ears were tested by a method of ascending pure tones at frequencies of 0.5, 1, 2, 3, 4, and 6 kHz across an intensity range of −10 to 120 dB. BHFTA was calculated as the equations in the attachment.
As BHFTA was calculated using the arithmetic mean of hearing thresholds at 3, 4, and 6 kHz in both the right and left ears, BHFHL was defined as BHFTA ≥40 dB. Similarly, BHFHL at 3, 4, and 6 kHz was also defined as a pure-tone mean of 40 dB or higher in both ears.
Noise Exposure AssessmentThe participants reported their occupational history information through the questionnaire, which included their occupational history, basic information of the company, such as the company’s industry classification, size, and length of service exposed to noise. Noise-exposed participants needed to satisfy additional criteria: (1) consistently worked in the same job category and at the same worksite (noise exposure area) for the period from the beginning of a worker’s career to the date of the investigation; (2) a minimum of at least 1 year of employment in their current position; (3) having an A-weighted noise exposure level at their jobs greater than 80 dBA.
The occupational noise level for each job at workplace was collected from the corporation records. Noise exposure levels for workplaces were divided through the job description and came from local occupational health survey. The occupational noise exposure was defined as exposed to a time-weighted-average noise level of 80 dB (A) for at least a year.29 Therefore, years of occupational noise exposure was divided into four groups: 0, 1 to less than 3, 3 to less than 10, and 10 or more.
Blood Pressure Measurement and Hypertension ClassificationWorkers exposed to occupational noise and meeting the standard scheme were free from noise for 12 hours. After taking a rest in the examination room for more than 15 minutes, the medical staff used a mercury sphygmomanometer to measure the systolic blood pressure (SBP) and diastolic blood pressure (DBP) of patients in a sitting position. Systolic blood pressure and DBP were recorded as the average of three repeated measurements collected at an interval of 1 minute. Hypertension classification was defined as Table 1.30
TABLE 1 - Hypertension Classification Hypertension Classification Blood Pressure No hypertension SBP < 140 and DBP < 90 Grade 1 SBP 140–159 and/or DBP 90–99 mm Hg Grade 2 SBP 160–179 and/or DBP 100–109 mm Hg Grade 3 SBP ≥ 180 and/or DBP ≥ 110 mm HgDBP, diastolic blood pressure; SBP, systolic blood pressure.
Information on sociodemographic characteristics (sex, age, and BMI), occupational hazard exposure, economic type, industry classification, and enterprise size was collected through a questionnaire. As BHFHL varied by age,31 it was classified into the following three groups: less than 40, 40 to less than 50, and 50 or more. Participants were classified into five groups by using the World Health Organization BMI cutoff points (<18.5, 18.5 to <23, 23 to <25, 25 to <30, ≥30 kg/m2), which have been recommended as the international classification of obesity.32 Hypertension was defined as blood pressure ≥140/90 mmHg and classified into three grades as mentioned previously. According to worker exposure to noise, dust, chemical poison, it was divided into four groups. Characteristics of the corporation in which the workers were employed were collected, including economic type (domestic, foreign, other), industry classification (manufacturing, mining, other), and enterprise size (small or micro, medium, large).
Statistical AnalysisSociodemographic characteristic of participants was reported as mean (SD) for continuous variables and as number (percentages) for categorical variables. Univariate analyses were performed to determine BHFHL. Logistic regressions were performed to evaluate the independent and combined associations of occupational noise exposure and blood pressure with BHFHL. Then, the associations were further evaluated with stratified sex and age, based on previous published reports suggesting that age and sex may be important factors for BHFHL.33 The models were conducted with those do no hypertension and no occupational noise exposure as the reference group. We chose covariates that could affect BHFHL according to evidence from published literatures.10,12,23,31 Covariates included age, sex, BMI, occupational hazard exposure, economic type, industry classification, and enterprise size. Tests for trend across groups were examined using ordinal values in separate models. All statistical analyses were performed using SPSS 21.0 software (SPSS, Chicago, Ill). The statistical tests were two-sided, and significance was set at P < 0.05.
RESULTS DescriptiveCharacteristics of the 242,811 participants included in the analysis were reported by categories of BHFHL (Table 2). Among them, 22.8% of participants were females, and 42.0% were younger than 40 years. Overall, 60.1% were exposed to occupational noise or other occupational hazard (59.2% for male, 11,087/187,393; 63.4% for female, 35,128/55,418) and the prevalence of hypertension was 13.2% (14.5% for male, 27,089/187,393; 9.2% for female, 5112/55,418). The prevalence of hypertension in the BMI groups increased gradually (2.7% for <18.5 kg/m2, 399/14,414; 7.5% for 18.5 to <23 kg/m2, 7178/95,429; 13.7% for 23 to <25 kg/m2, 7448/54,299; 20.6% for 25 to <30 kg/m2, 13,952/67,667; 29.3% for ≥30 kg/m2, 3226/11,002). The prevalence of BHFHL among all participants was 8.4% (9.9% for male and 3.6% for female). We observed marked differences in BHFHL prevalence by demographic and working environmental characteristics. Prevalence of BHFHL was higher among men, older than 50 years, moderate BMI (23 to <30 kg/m2) and subjects with hypertension, in the small or micro mining enterprise, under noise, and dust exposure. Subjects with hypertension and those exposed to occupational noise for 10 years or more were more inclined to have BHFHL.
TABLE 2 - Characteristics of Participants by BHFHL Categories Characteristics Total (N = 242,811) BHFHL (n = 20,497) No BHFHL (n = 222,314) P Age, mean (SD), yr 39.17 ± 11.30 47.65 ± 8.10 38.39 ± 11.23 <0.001 Age <0.001 <40 125,340 (51.62) 3,417 (16.67) 121,923 (54.84) 40 to <50 67,646 (27.86) 8,358 (40.78) 59,288 (26.67) ≥50 49,825 (20.52) 8,722 (42.55) 41,103 (18.49) Sex <0.001 Male 187,393 (77.18) 18,491 (90.21) 168,902 (75.97) Female 55,418 (22.82) 2,006 (9.79) 53,412 (24.03) BMI, mean (SD), kg/m2 23.63 ± 3.58 24.13 ± 3.23 23.59 ± 3.60 <0.001 BMI <0.001 <18.5 14,414 (5.94) 522 (2.55) 13,892 (6.25) 18.5 to <23 95,429 (39.3) 7,182 (35.04) 88,247 (39.69) 23 to <25 54,299 (22.36) 5,273 (25.73) 49,026 (22.05) 25 to <30 67,667 (27.87) 6,668 (32.53) 60,999 (27.44) ≥30 11,002 (4.53) 852 (4.16) 10,150 (4.57) Occupational hazard exposure <0.001 Noise 93,946 (38.69) 6,539 (31.9) 87,407 (39.32) Noise, dust 102,065 (42.03) 11,101 (54.16) 90,964 (40.92) Noise, chemical poison 20,436 (8.42) 1,081 (5.27) 19,355 (8.71) Noise, dust, chemical poison 26,364 (10.86) 1,776 (8.66) 24,588 (11.06) Occupational noise exposure <0.001 No 96,808 (39.87) 6,137 (29.94) 90,671 (40.79) 1 ≤ year < 3 65,517 (26.98) 5,165 (25.2) 60,352 (27.15) 3 ≤ year < 10 53,554 (22.06) 5,075 (24.76) 48,479 (21.81) year ≥ 10 26,932 (11.09) 4,120 (20.1) 22,812 (10.26) Blood pressure, mean (SD), mm Hg Systolic blood pressure 126.01 ± 14.97 129.81 ± 16.13 125.66 ± 14.81 <0.001 Diastolic blood pressure 81.03 ± 10.77 83.35 ± 11.23 80.81 ± 10.70 <0.001 Hypertension classification <0.001 No hypertension 210,610 (86.74) 16,088 (78.49) 194,522 (87.5) Grade 1 hypertension 17,894 (7.37) 2,460 (12) 15,434 (6.94) Grade 2 hypertension 10,430 (4.3) 1,430 (6.98) 9,000 (4.05) Grade 3 hypertension 3,877 (1.6) 519 (2.53) 3,358 (1.51) Economic type <0.001 Domestic 217,455 (89.56) 19,548 (95.37) 197,907 (89.02) Foreign 16,323 (6.72) 675 (3.29) 15,648 (7.04) Other 9,033 (3.72) 274 (1.34) 8,759 (3.94) Industry classification <0.001 Manufacturing 188,998 (77.84) 14,713 (71.78) 174,285 (78.4) Mining 10,717 (4.41) 2,076 (10.13) 8,641 (3.89) other 43,096 (17.75) 3,708 (18.09) 39,388 (17.72) Enterprise size <0.001 Small or micro 128,834 (53.06) 12,582 (61.38) 116,252 (52.29) Medium 64,247 (26.46) 4,967 (24.23) 59,280 (26.66) Large 49,730 (20.48) 2,948 (14.38) 46,782 (21.04)Table 3 presented the odds ratios (ORs) and 95% confidence intervals (95% CIs) for the effect of occupational noise exposure on BHFHL. Compared with participants not exposed to occupational noise, the risk of BHFHL was significantly higher among noise exposure duration for 10 years or more group (OR, 1.29; 95% CI, 1.23–1.35), after adjusting for potential confounders. Stratified analyses revealed that the association between the longest noise exposure duration group (≥10 years) and BHFHL was significant in different sex and age group. In addition, they were more pronounced in females (OR, 1.38; 95% CI, 1.18–1.60) and those younger than 40 years (OR, 1.57; 95% CI, 1.36–1.80). Meanwhile, the association was also found among males (OR, 1.29; 95% CI, 1.23–1.34).
TABLE 3 - Odds Ratios (95% CIs) of BHFHL by Occupational Noise Exposure Occupational Noise Exposure n Model 1* Model 2† Model 3‡ Total No 96,808 Ref Ref Ref 1 ≤ year < 3 65,517 1.27 (1.22–1.32) 1.04 (1.00–1.08) 1.03 (0.99–1.07) 3 ≤ year < 10 53,554 1.55 (1.49–1.61) 1.06 (1.01–1.10) 1.07 (1.02–1.11) year ≥ 10 26,932 2.67 (2.56–2.78) 1.26 (1.20–1.32) 1.29 (1.23–1.35) P for trend <0.001 <0.001 <0.001 Sex Male No 76,518 Ref Ref Ref 1 ≤ year < 3 48,498 1.30 (1.25–1.36) 1.03 (0.99–1.07) 1.02 (0.98–1.07) 3 ≤ year < 10 40,420 1.61 (1.54–1.67) 1.05 (1.01–1.10) 1.07 (1.02–1.11) year ≥ 10 21,957 2.69 (2.57–2.81) 1.25 (1.20–1.31) 1.29 (1.23–1.34) P for trend <0.001 <0.001 <0.001 Female No 20,290 Ref Ref Ref 1 ≤ year < 3 17,019 1.42 (1.27–1.60) 1.14 (1.02–1.29) 1.10 (0.97–1.23) 3 ≤ year < 10 13,134 1.54 (1.36–1.74) 1.09 (0.96–1.23) 1.08 (0.95–1.22) year ≥ 10 4,975 2.17 (1.88–2.52) 1.30 (1.12–1.51) 1.38 (1.18–1.60) P for trend <0.001 0.005 0.001 Age group, y <40 No 61,497 Ref Ref Ref 1 ≤ year < 3 34,912 1.84 (1.69–2.00) 1.54 (1.41–1.68) 1.53 (1.41–1.67) 3 ≤ year < 10 23,767 2.20 (2.02–2.41) 1.44 (1.32–1.58) 1.51 (1.38–1.66) year ≥ 10 5,164 3.21 (2.81–3.67) 1.46 (1.27–1.67) 1.57 (1.36–1.80) P for trend <0.001 <0.001 <0.001 40 to <50 No 22,636 Ref Ref Ref 1 ≤ year < 3 18,012 0.90 (0.85–0.96) 0.97 (0.91–1.03) 0.96 (0.90–1.02) 3 ≤ year < 10 16,041 0.81 (0.76–0.86) 0.88 (0.83–0.94) 0.89 (0.83–0.95) year ≥ 10 10,957 1.13 (1.06–1.21) 1.07 (1.00–1.14) 1.10 (1.03–1.18) P for trend 0.515 0.908 0.364 ≥50 No 12,675 Ref Ref Ref 1 ≤ year < 3 12,593 0.90 (0.84–0.96) 0.94 (0.88–1.00) 0.92 (0.86–0.99) 3 ≤ year < 10 13,746 1.08 (1.01–1.15) 1.11 (1.04–1.19) 1.10 (1.03–1.18) year ≥ 10 10,811 1.32 (1.23–1.41) 1.28 (1.20–1.36) 1.29 (1.21–1.38) P for trend <0.001 <0.001 <0.001*Unadjusted.
†Adjusted for age/sex.
‡Adjusted for age/sex, hypertension, BMI, occupational hazard exposure, economic type, industry classification, enterprise size.
The effect of hypertension status on BHFHL was revealed in Table S1, https://links.lww.com/JOM/B262. Compared with no hypertension, participants with hypertension had higher risk of BHFHL (OR, 1.07; 95% CI, 1.03–1.11). Stratified analyses indicated that the association was significant in males (OR, 1.06; 95% CI, 1.02–1.11) and all age groups. Besides, it was not significant in females either (OR, 1.13; 95% CI, 0.99–1.28).
To explore whether the risk varied by classification of hypertension, the association between hypertension and BHFHL was evaluated in Table 4. The odds ratios increased with the increasing grade of hypertension from grade 1 to 2, and the grade 2 hypertension got the highest risk (OR, 1.28; 95% CI, 1.05–1.56). Compared with no hypertension, participants with grade 1 hypertension had higher risk of BHFHL (OR, 1.14; 95% CI, 1.09–1.20). Stratified analyses indicated that the association was significant both in males (OR, 1.13; 95% CI, 1.08–1.19) and females (OR, 1.24; 95% CI, 1.05–1.46) with grade 1 hypertension. Besides, the association between grade 1, grade 2 hypertension, and BHFHL was also found among the youngest age group (<40) but the other age groups (40 to <50, ≥50).
TABLE 4 - Odds Ratios (95% CIs) of BHFHL by Hypertension Classification Hypertension Classification n Model 1* Model 2† Model 3‡ Total No 210,610 Ref Ref Ref Grade 1 17,894 1.93 (1.84–2.02) 1.15 (1.09–1.20) 1.14 (1.09–1.20) Grade 2 10,43
留言 (0)