
Remember me


Injury is the leading cause of morbidity and mortality in children and adolescents in the USA [1]. A child’s overall risk of injury-related morbidity and mortality is significantly impacted by their social determinants of health, and in particular, their socioeconomic status (SES). Children from socioeconomically disadvantaged backgrounds often experience a disproportionate and inequitable burden of injury [2••]. As such, SES may be an upstream target for interventions aimed at both preventing injury and closing the equity gap. The goal of this review is to 1) discuss how SES is evaluated or defined in the pediatric trauma literature and then 2) to explore how SES impacts pediatric injury-related outcomes.
Measuring Socioeconomic StatusSocioeconomic status is a complex concept. The term is often used interchangeably with others such as social class, social stratification, or social status. SES is the term used most frequently in the trauma literature and thus the term we will use throughout this report. SES is determined by various social and economic factors that usually include measures of income, wealth, education, employment, area of residence, and more [3, 4]. These measures can also be evaluated at an individual-level, family-level, or neighborhood-level, all of which influence health outcomes [4]. Therefore, before examining how SES impacts injury outcomes, it is worth briefly discussing how SES is commonly measured in the trauma literature. Indeed, individual- or family-level SES is rarely directly evaluated; instead the most common measures of SES utilized are insurance status as a proxy for family-level SES, and neighborhood-level characteristics obtained from census data based on a child’s home address.
Information on insurance status is widely available and therefore commonly used as a proxy for family-level SES in the USA. In the USA, the most common form of insurance is that provided by an employer, while those who are unemployed or those employed part-time or in low-wage positions are more likely to have public insurance or no insurance [5]. Figure 1 shows the relationship between poverty and insurance coverage for children in 2021. Based on data from the National Health Interview Survey, among children from families living below the federal poverty level, only 8.9% had private insurance coverage, while 87.8% had public insurance. That is nearly reversed for children from families with incomes double the federal poverty level or more, where 16.3% and 80.7% had public and private insurance, respectively [5]. As such, insurance status and the distinction between no insurance, public insurance, and private insurance can be used as a proxy to evaluate for associations between family-level SES and health outcomes.
Fig. 1
Health insurance coverage for children (age 0–17 years) by family income level for 2021
There are several potential caveats of using insurance as a proxy of family SES. First, while poverty is correlated with insurance status, there are still families with public insurance or no insurance that live well above the federal poverty level, or families with private insurance who live below the federal poverty level, and thus there is a risk of misclassification. Second, insurance can also directly impact access as a potentially important driver for disparate health outcomes aside from associations with SES. It can be difficult to parse out whether an association between insurance status and a health outcome is the result of an issue with access or an association with SES. However, in understanding the epidemiology of pediatric injury, associations between frequency and severity of injury with health insurance almost certainly reflect the impact of SES (whether family-level or neighborhood-level) as there isn’t a clear pathway through which healthcare access should impact risk of injury. On the other hand, in the post-discharge setting, for example when evaluating access to or utilization of rehab services, insurance status may indeed impact access to care beyond any associations with SES.
The other measures of SES most often used in research on pediatric injury are area-level socioeconomic measures, generally obtained through geocoding a patient’s home address and linking it to US census data or census data–derived measures. Examples can include single measures like the median income for a zip code, or percentage in poverty, or can include composite measures or indices of socioeconomic deprivation like the Area Deprivation Index (ADI) or Social Vulnerability Index (SVI). These metrics can link to health outcomes through at least two mechanisms. First, these measures are proxies for the impact of neighborhood social determinants of health or neighborhood-level SES on health outcomes. This is particularly relevant in trauma as a child’s built environment and neighborhood context impact their risk of injury. Second, individual- or family-level SES can also have a significant impact on health outcomes and area-level measures are often correlated with the individual- or family-level SES of residents that live in the area. As such, associations between area-level measures of SES and health outcomes may be partially driven by associations of individual- or family-level SES with those same outcomes. However, if area-level measures are used explicitly to evaluate individual- or family-level SES, there is a significant risk of bias as area-level measures may not accurately reflect the SES of all the individuals who live in the area. Therefore, it may be more appropriate to use area-level measures to evaluate the impact of neighborhood-level social determinants of health.
There are two aspects to area-level measures of SES that are worth further discussion — the first is the difference between single measures (like median income) and composite indices (like the ADI), and second is the choice of geographic unit used to define neighborhood. Single measures like median income are often used in national databases, including the Agency for Healthcare Research and Quality databases such as Kids’ Inpatient Database (KID) or the National Inpatient Sample (NIS), along with others like the Pediatric Health Information System (PHIS) database. On the other hand, composite indices of socioeconomic deprivation have been used by single institution studies, as well as regional consortiums like the Pediatric Emergency Care Applied Research Network (PECARN) or the Midwest Pediatric Surgical Consortium (MWPSC) [6, 7•, 8•]. Single measures may be more intuitive or easier to interpret; for example, it may be simpler to understand the difference in median income between two areas compared to the difference in a deprivation index value. However, deprivation indices like the ADI or SVI combine multiple aspects of SES, including measures of income, education, employment and more, and thus are more comprehensive. Indices allow researchers to use a single tool to evaluate the combined effect of multiple aspects of SES on health. Furthermore, because they are more comprehensive, deprivation indices may have a stronger relationship with health outcomes than single area-level measures of SES [9,10,11].
The second aspect of area-level measures to discuss is the choice of geographic unit (e.g., census tract vs zip code) that the study uses to define neighborhood. Many local or regional studies use census block groups or census tracts, while national studies are often limited to broader zip code or county-level assessments. Census block groups and census tracts are much smaller areas and are generally more homogenous with respect to environmental and population characteristics [12]. As such, they are usually a more accurate or representative measure of neighborhood. On the other hand, zip codes for instance, are far more variable. They are based on postal routes, not distinct “neighborhoods” or areas. Given their size, they may include multiple distinct and socioeconomically different neighborhoods within them. Therefore, assigning socioeconomic indicators at the zip code level or the even broader county-level may mask local variability and bias results [13,14,15]. However, zip codes are often simpler to acquire and all national databases we are aware of use data at the zip code level, partially to ensure data is de-identified. Studies using zip code or county-level data can still be very useful, but particularly with negative results, it is important to recognize the potential of masked heterogeneity to bias results towards the null. As such, the use of these larger area levels can be a notable limitation.
There are opportunities to build on the current literature and evaluate additional aspects of SES. For example, while there is significant literature exploring associations between insurance status and pediatric injury, there has been a limited evaluation of the impact of other individual- or family-level measures of SES like a caregiver’s education, income or housing. And looking at neighborhood-level SES, there is a lack of national data available at the more accurate census tract level. Furthermore, most national databases only evaluate median income as a single measure of SES, with more limited research on other aspects of neighborhood context.
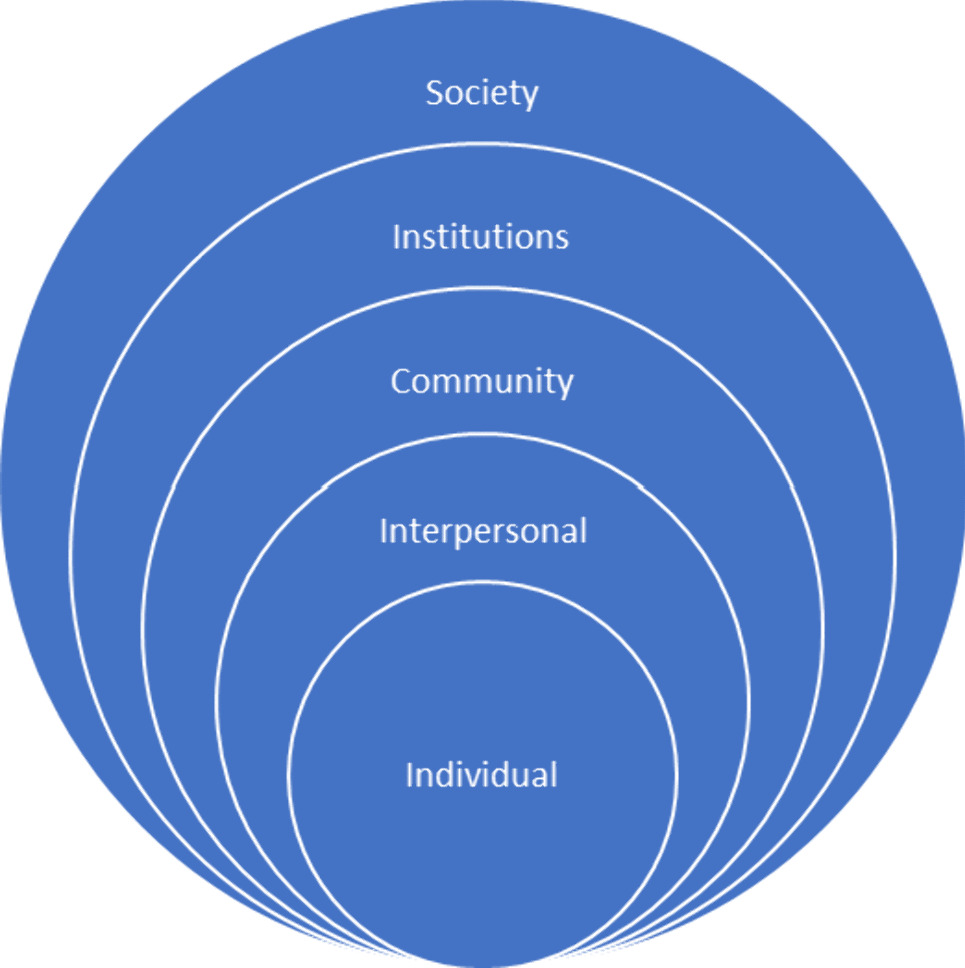
Socioeconomic Status as a Driver of Inequities in Pediatric InjuryThere are notable inequities in pediatric injury based on a child’s SES. Differences in SES can lead to injury inequities in at least three broad ways (Figure 2): [1] through differences in injury risk and epidemiology including frequency and severity of injuries, [2••] through differences in care post-injury, including potential biases in care and access to healthcare resources, and [3] through differences in the child’s and family’s ability to respond to, recover, and thrive post-injury. This report will explore each of these potential drivers.
Fig. 2
Socioeconomic factors as drivers of inequities in pediatric injury
Injury EpidemiologyDifferences in the frequency and severity of injuries that children experience based on their SES is one of, if not the most important driver of inequities in pediatric injury. In particular, there are significant differences in the mechanism of injury (MOI) and intent of injury for injuries that children experience based on their SES. Children from disadvantaged backgrounds experience a disproportionate burden of firearm-related injuries and motor vehicle-related injuries. Children from disadvantaged backgrounds also experience a greater burden of injuries resulting from interpersonal violence. For example, in national data including both adult and pediatric populations, lower SES was associated with increased age-adjusted overall injury related mortality. It was also associated with both firearm-related injury mortality and motor vehicle collision (MVC)-related mortality [2••]. This study used three different indices, with clear associations between all three indices and all three mortality outcomes.
Firearm InjuriesLooking at firearm-related injuries specifically, there are clear associations at the national, regional, and single institution levels between both insurance status and neighborhood socioeconomic measures with rates of pediatric firearm-related injury. Using the National Emergency Department Sample database, both lower zip code level median income and public insurance were risk factors for firearm-related injury among children [16]. Similarly, using national data through the CDC’s Firearm Injury Surveillance Through Emergency Rooms (FASTER) program, greater deprivation, as measured by the SVI, was associated with much higher rates of firearm-related injury [17]. In Colorado, neighborhoods with higher rates of firearm-related injuries had lower median incomes and higher levels of poverty compared to median state levels [18]. Within PECARN, both census tract level socioeconomic deprivation and public insurance/self pay status were risk factors for presentation with a firearm-related injury [16]. Lastly, multiple single institution level studies have demonstrated a significant association between SES and risk of firearm-related injury using both insurance status and measures of neighborhood-level SES [19•, 20, 21, 22•]. For example, our group found that while children from the highest deprivation index quintile experienced only 25% of all injury-related hospitalizations, they experienced 57% of all firearm-related hospitalizations and 70% of all firearm-related hospitalizations from assault [19•]. Children from the neighborhoods in the highest quintile of socioeconomic deprivation had 30 times the risk of firearm injury compared to children from the lowest quintile of socioeconomic deprivation. Similarly, those admitted after firearm-related injury were much more likely to have public insurance [19•].
Motor Vehicle–Related InjuriesChildren from socioeconomically disadvantaged neighborhoods may also experience higher rates of motor vehicle-related injuries including both MVCs and pedestrians struck by motor vehicles, though additional research corroborating these trends is needed. In the California-Mexico border region, children from areas of greater deprivation, as measured by quintiles of ADI, had higher rates of both MVCs and being struck by motor vehicles. On the other hand, children from the areas of lower deprivation had higher rates of sports-related and non-motorized vehicle-related injuries. Specifically, children from neighborhoods in the most deprived quintile had double the rate of motor vehicle-related injury admissions (32% vs 15%) and half the rate of non-motorized and sports-related injury admissions (6% vs 12% and 4% vs 11%, respectively) [23••].
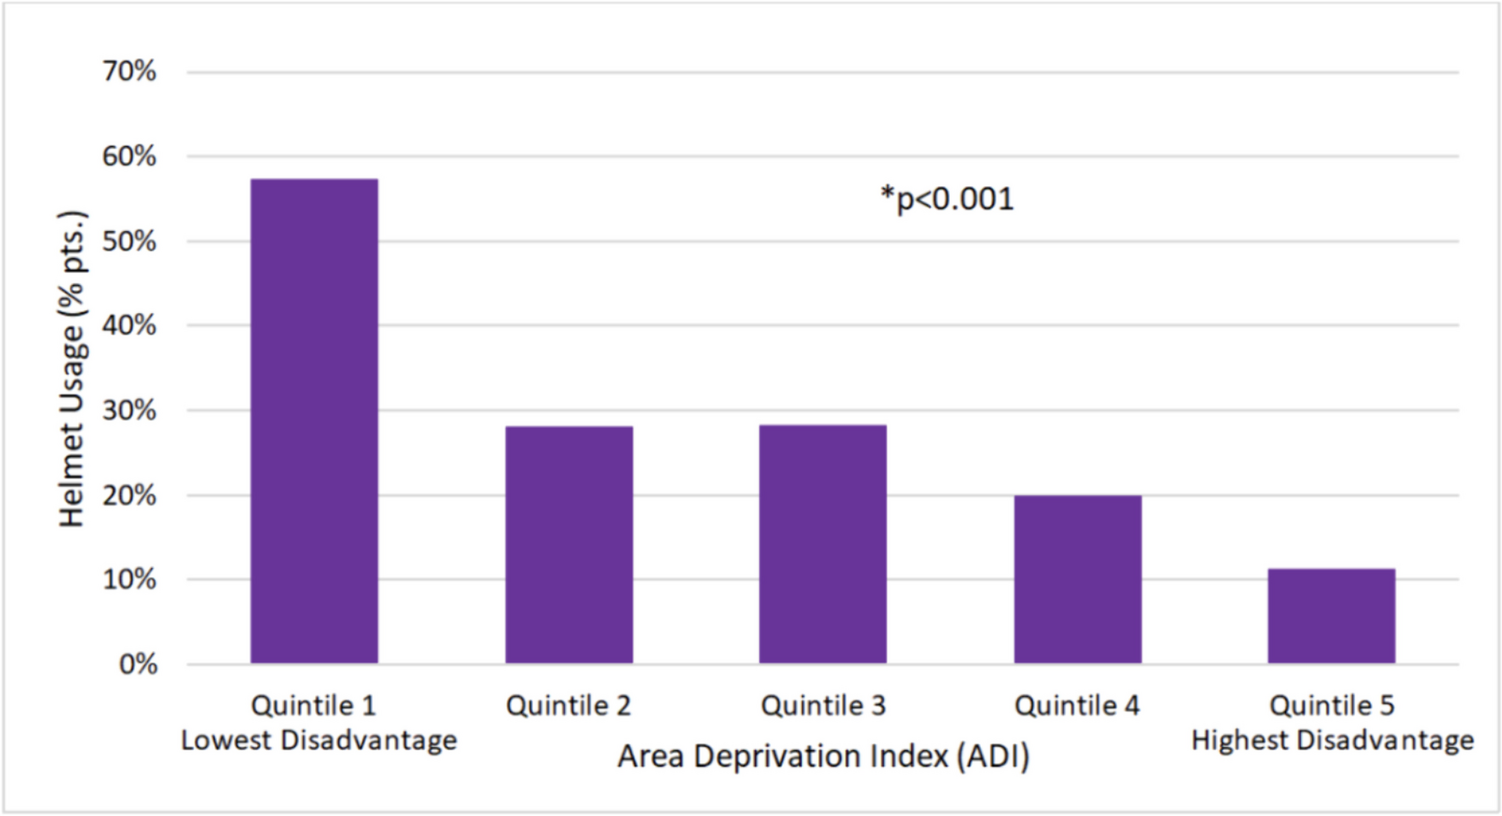
The authors further evaluated the pedestrian versus motor vehicle and bicycle versus motor vehicle cases by linking the data with traffic safety data to understand risk factors and their relationship with neighborhood deprivation [24, 25]. Along with ADI being independently associated with the rate of pedestrian struck by motor vehicle-related injury admission, children from more disadvantaged areas had more injuries occur during dark streetlight conditions and more injuries occur closer to home (within 0.5 mile). Regarding bicylcle versus motor vehicle cases, more than 80% of collisions occurred in areas without a bike lane and children from more disadvantaged areas were less likely to wear helmets. These results highlight how a child’s neighborhood context impacts their risk of injury and how neighborhood-level socioeconomic deprivation can impact this risk. One limitation of these studies is that the associations are based on admission rates for each MOI instead of population-level risk. Nevertheless, the findings are significant and demonstrate how children from more socioeconomically deprived neighborhoods experience more injuries than their peers in more affluent areas.
Violence-Related InjuriesAlong with the disparities in types of injury based on MOI, children from lower socioeconomic backgrounds also experience a greater burden of injuries related to interpersonal violence, including non-accidental trauma (NAT) or child physical abuse (CPA). This report will use the term CPA. For example, both insurance status and area-level socioeconomic status have been associated with risk of CPA and subsequent negative outcomes. Nationally, approximately 85% of patients admitted for CPA had either public insurance or no insurance [26]. Patients admitted after CPA also experienced disparate outcomes based on insurance status. For example, those with no insurance had 3.3 times greater odds of mortality than those with public insurance [27]. And even after controlling for Injury Severity Score (ISS) and Glasgow Coma Scale, those with public or no insurance seem to experience higher mortality rates compared to those with private insurance [27,28,29,30]. There are similar reported outcomes based on measures of area-level SES. In the California-Mexico border region, there were higher rates of CPA with increasing ADI quintile, and the highest quintile had nearly three times the rate of CPA-related admissions as the lowest quintile (7.2% vs 2.6%) [23••]. In a multi-institutional study, lower neighborhood median income quartile was associated with increased mortality from CPA [29].
Along with higher rates of CPA, children from disadvantaged backgrounds also experience higher rates of other forms of violent injury. In a single level 1 pediatric trauma center, greater census tract level socioeconomic deprivation was significantly associated with higher rates of any form of interpersonal violence-related injury admission [31]. In firearm injuries, area-level socioeocnomic deprivation is often associated with higher rates of assault [6, 16, 19, 21]. In an assessment of a state-wide registry in Ohio, children with public insurance had three times the risk of assault-related injury compared to children with private insurance, and assault victims were much more likely to arrive at the hospital greater than 24 hours after the injury compared to those presenting with non-assault-related injuries (OR 1.95) [32].
When evaluating child maltreatment more broadly, a systematic review found higher rates of child maltreatment and abuse based on family- and area-level poverty rates [33•]. Families from socioeconomically disadvantaged backgrounds may have fewer social and economic supports that can help caregivers cope with acute and chronic stressors. When faced with these stressors, child maltreatment or abuse may be a maldadaptive response, highlighting at least one connection between socioeconomic deprivation and risk of child maltreatment and CPA [34]. Furthermore, policy level initiatives aimed at supporting low income families have the potential to reduce the rates of child abuse and maltreatment, highlighting how SES may be an upstream target amenable to intervention. For example, for every $1000 increase per child in the Earned Income Tax Credit (EITC) and Child Tax Credit, state level rates of reported maltreatment decreased by an estimated 5% [35••]. Refundable EITCs were responsible for an estimated 13% reduction in abusive head trauma admissions in children younger than 2 years of age [36].
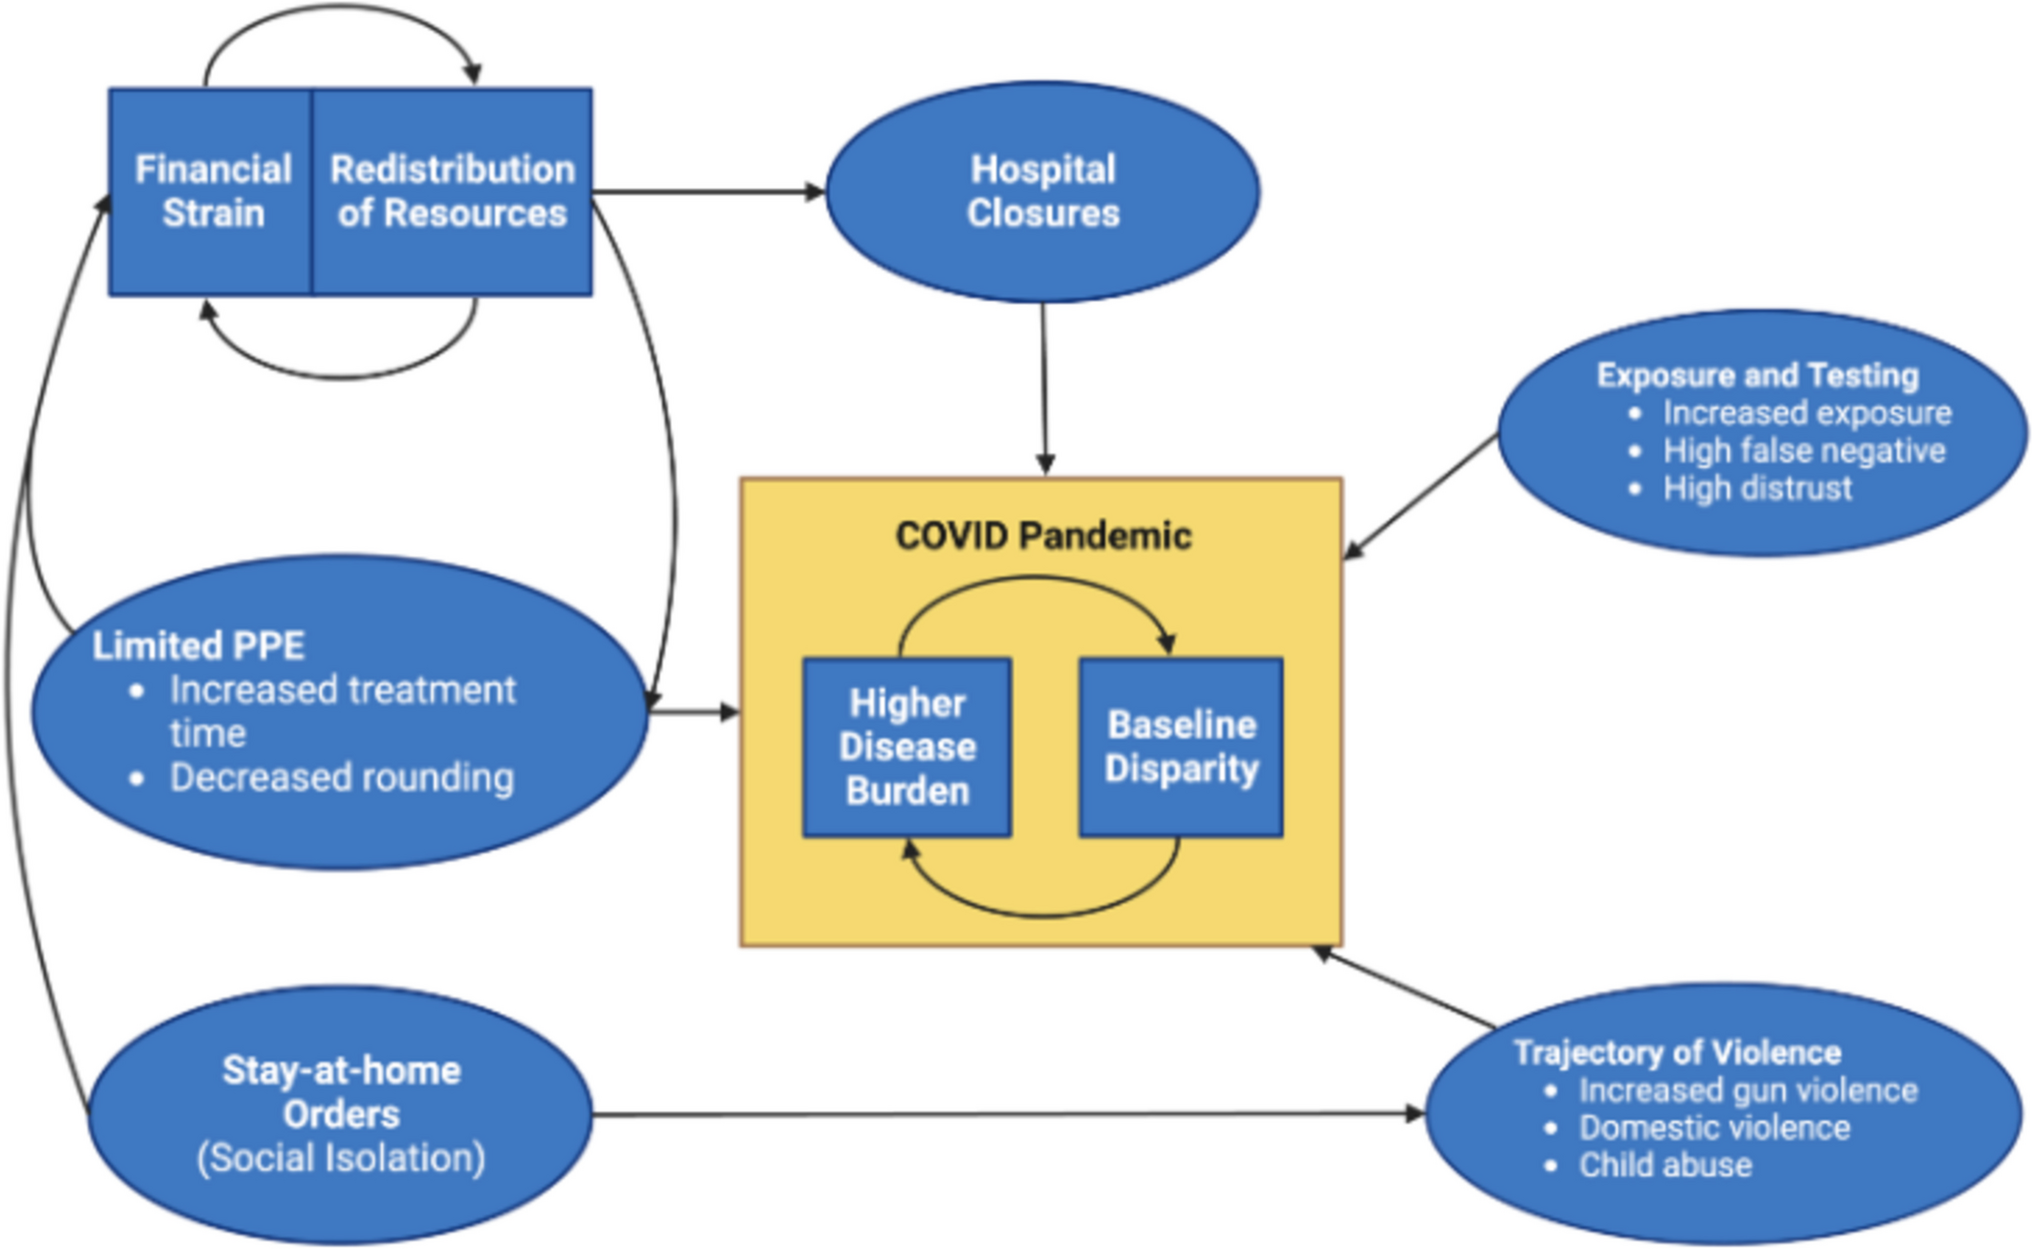
Vulnerability to External StressorsChildren from socioeconomically disadvantaged backgrounds may also be the most vulnerable to significant changes in external stressors. For example, during the COVID-19 pandemic, both pediatric injury rates overall and rates of CPA increased, but the increased rates of both disproportionately occurred in children from the most vulnerable neighborhoods, as measured by the SVI at the census tract level [7•, 8•]. Similarly, the burden of firearm injuries as a percentage of all trauma evaluations has increased recently, but this has particularly impacted children from the most socioeconomicaly deprived neighborhoods [18].
Differences in Care Post-InjuryInequities in injury outcomes can also result from differences in care post-injury including as a result of potential bias or differential access to resources. There are clear differences in overall risk of mortality after pediatric injury based on a child’s SES. For example, in a systematic review and meta-analysis that included both adult and pediatric patients, those without insurance had 22% higher odds of mortality [37]. This study did not control for injury type or clinical co-variates, but in a similar evaluation of pediatric trauma patients using the NTDB, there was a higher mortality rate in injured self-pay patients compared to those with insurance after controlling for ISS and type of injury (penetrating vs blunt) [38]. Others report similar findings with higher mortality rates based on insurance status even after attempting to control for confounding factors [39, 40].
There may also be differences in other outcomes after injury based on SES, including triage destinations, pain management outcomes, TBI outcomes, and access to rehabilitation. When evaluating triage destinations after pediatric injury, those with private insurance were more likely to be initially triaged to a pediatric trauma center while those without insurance were more likely to initially present to an adult facility and require subsequent transfer to a pediatric trauma center [41, 42]. There are differences in analgesia use after injury for children based on insurance status, as those with public insurance may be less likely to receive opiates compared to those with private insurance [43, 44]. When looking at neighborhood socioeconomic status, children from more deprived neighborhoods, evaluated using zip code level ADI, report worse pain and quality of life outcomes after upper extremity fracture [45, 46]. Children from disadvantaged backgrounds also experience worse outcomes after TBI, possibly as a result of greater severity in initial presentation or differences in care post-injury [47, 48]. For every $10,000 increase in the median income for a child’s home zip code, their odds of mortality after TBI decreased by 6% (OR 0.96). Lower income is also associated with increased risk of ballistic TBI which may be a potential driver or confounder for the noted inequity in mortality [49••]. Lastly, insurance status can also impact access to and utilization of rehab services after injury. For example, Medicaid expansion as part of the Affordable Care Act was associated with an increase in discharge to inpatient rehabilitation after pediatric injury, particularly for children from zip codes with the lowest median incomes [50•]. Furthermore, children with private insurance are more likely to utilize inpatient rehab services [51], and inpatient rehab consultation is a significant predictor for outpatient utilization [52].
It can often be difficult to determine if differences in post-injury outcomes result from differences in the severity of injury or from differences in the care received post-injury. It is possible that epidemiological differences and differences in injury severity may still confound the results above and explain many of the inequities, particularly in mortality rate and TBI outcomes. For example, in adult trauma using a state-wide registry, SVI was initially associated with significantly higher mortality rate in an unadjusted model. However, after adjusting for co-variates available to claims data, the association became weaker. After further adjusting for multiple robust co-variates available to trauma registries including, for example, a patient’s shock index, mechanism of injury, and need for blood transfusions, there was no longer an association between SVI and mortality [53••]. Therefore, the association between deprivation and mortality may be mediated by initial presenting characteristics. Further research is needed to determine if these findings are replicated in the pediatric population.
Child’s Ability to Recover and Thrive Post-InjurySocioeonomic disparities may also impact a child’s ability to recover and a family’s ability to support recovery so that they can thrive post-injury. Children from socioeconomically disadvantaged backgrounds are at greater risk for poor recovery incuding a higher risk of readmission, recidivism, and development of acute stress disorder (ASD) and post-traumatic stress disorder (PTSD). Among both adult and pediatric patients admitted for injury, both lower median income quartile and public insurance were associated with readmission at 6 months. In particular, those with Medicare insurance had an adjusted 1.65 times higher odds of readmission compared to those with private insurance, which was a higher odds for readmission than for any other factor evaluated aside from leaving against medical advice (adjusted OR 1.85) [54]. Similarly, after injury in children, both public insurance and zip code level median income are risk factors for recidivism [55]. Additionally, among children who experienced firearm-related injuries, those with repeat firearm-related injuries were more likely to live in zip codes with higher rates of unemployment, vacant housing, poverty levels and lower school enrollment [56].
Chidren from lower socioeconomic backgrounds and those with lower social support are also at higher risk of developing PTSD. Among US adolescents, exposure to interpersonal violence and poverty were both independent risk factors for developing PTSD [57]. In a large meta-analysis, both low family-level SES and several measures of family social support were risk factors for PTSD in children and adolescents [58]. In a review of trauma populations specifically, low SES was a risk factor for PTSD [59]. It is also important to consider a child’s entire social context. While not in a trauma population specifically, parental PTSD has been correlated with a child’s response to an acute stressor and their risk of developing post-traumatic stress symptoms, highlighting the need to consider and engage a child’s caregiver(s) [60].
One potential driver for how socioeconomic status can impact a child’s ability to recover post-injury relates to how they handle the stress of the traumatic event and in particular, their risk of developing toxic stress. Children from lower socioeconomic backgrounds are at higher risk for a history of early adverse childhood experiences (ACEs). Lower SES may also contribute to neurodevelopmental inequities. All of this may impact a child’s future ability to cope and respond to a stressful event like an injury, increasing their risk for developing toxic stress [61•, 62, 63, 64•]. Ensuring that children and their families have necessary social supports can help prevent a toxic stress response and enable them to recover well. This highlights the difference between equality and equity and the need for trauma centers to employ best practices related to trauma informed care [65]. Equality seeks similar care for all patients, while equity seeks similar outcomes for all patients, recognizing that some patients may require additional supports and resources to achieve the same outcome. Indeed, children from socioeconomically disadvantaged backgrounds deserve the same opportunity to recover and thrive after injury.
Comments (0)