


Remember me
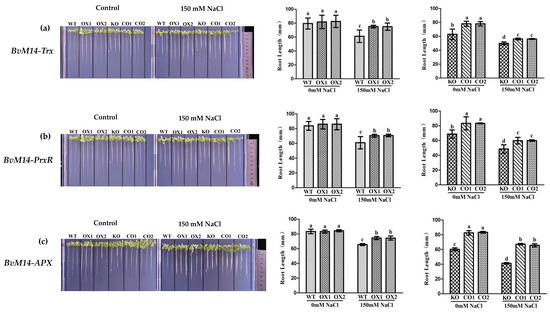
Figure 1. Effects of salt stress on the root length of seedings with different genotypes (WT, OX, KO, and CO): (a) Root length of WT and Trx-related plants under salt stress; (b) root length of of WT and PrxR-related plants under salt stress; (c) root length of WT and APX-related plants under salt stress. Data were analyzed by Duncan’s analysis of variance, and different lowercase letters (a, b, c, d) indicate differences in root length.
Figure 1. Effects of salt stress on the root length of seedings with different genotypes (WT, OX, KO, and CO): (a) Root length of WT and Trx-related plants under salt stress; (b) root length of of WT and PrxR-related plants under salt stress; (c) root length of WT and APX-related plants under salt stress. Data were analyzed by Duncan’s analysis of variance, and different lowercase letters (a, b, c, d) indicate differences in root length.
Figure 2. Effects of salt stress on the phenotype and biomass: (a) Phenotype of WT and APX-related plants under salt stress; (b) phenotype of of WT and DHAR3-related plants under salt stress; (c) phenotype of WT and MDHAR-related plants under salt stress; (d,g) biomass of WT and APX-related plants under salt stress; (e,h) biomass of of WT and DHAR3-related plants under salt stress; (f,i) biomass of WT and MDHAR-related plants under salt stress. Data were analyzed by Duncan’s analysis of variance, and different lowercase letters (a, b, c, d) indicate differences in fresh and dry weight.
Figure 2. Effects of salt stress on the phenotype and biomass: (a) Phenotype of WT and APX-related plants under salt stress; (b) phenotype of of WT and DHAR3-related plants under salt stress; (c) phenotype of WT and MDHAR-related plants under salt stress; (d,g) biomass of WT and APX-related plants under salt stress; (e,h) biomass of of WT and DHAR3-related plants under salt stress; (f,i) biomass of WT and MDHAR-related plants under salt stress. Data were analyzed by Duncan’s analysis of variance, and different lowercase letters (a, b, c, d) indicate differences in fresh and dry weight.
Figure 3. H2O2 contents of WT and GOX, PrxR, Trx, APX, DHAR3, and MDHAR transgenic plants under salt stress: (a) GOX-related plants; (b) PrxR-related plants; (c) Trx-related plants; (d) APX-related plants; (e) DHAR3-related plants; (f) MDHAR-related plant. Data were analyzed by Duncan’s analysis of variance, and different lowercase letters (a, b, c) indicate differences in H2O2 contents.
Figure 3. H2O2 contents of WT and GOX, PrxR, Trx, APX, DHAR3, and MDHAR transgenic plants under salt stress: (a) GOX-related plants; (b) PrxR-related plants; (c) Trx-related plants; (d) APX-related plants; (e) DHAR3-related plants; (f) MDHAR-related plant. Data were analyzed by Duncan’s analysis of variance, and different lowercase letters (a, b, c) indicate differences in H2O2 contents.
Figure 4. The GSH contents of WT and GOX, PrxR, Trx, APX, DHAR3, and MDHAR transgenic plants under salt stress: (a) GOX-related; (b) PrxR-related; (c) Trx-related; (d) APX-related; (e) DHAR3-related; (f) MDHAR-related plants. Data were analyzed by Duncan’s analysis of variance, and different lowercase letters (a, b, c, d) indicate differences in GSH contents.
Figure 4. The GSH contents of WT and GOX, PrxR, Trx, APX, DHAR3, and MDHAR transgenic plants under salt stress: (a) GOX-related; (b) PrxR-related; (c) Trx-related; (d) APX-related; (e) DHAR3-related; (f) MDHAR-related plants. Data were analyzed by Duncan’s analysis of variance, and different lowercase letters (a, b, c, d) indicate differences in GSH contents.
Figure 5. Analyses of relative gene expression and enzyme activities in GOX-related plants under salt stress: (a–f) Expression of antioxidative genes (BvM14-CAT, BvM14-PrxR, BvM14-Trx, BvM14-APX, BvM14-DHAR3, and BvM14-MDHAR) in WT and GOX-related plants under salt stress; (g–l) antioxidant enzyme activities (BvM14-CAT, BvM14-PrxR, BvM14-Trx, BvM14-APX, BvM14-DHAR3, and BvM14-MDHAR) in WT and GOX-related plants under salt stress. Data were analyzed by Duncan’s analysis of variance, and different lowercase letters (a, b, c, d, e) indicate differences in gene expression and enzyme activities.
Figure 5. Analyses of relative gene expression and enzyme activities in GOX-related plants under salt stress: (a–f) Expression of antioxidative genes (BvM14-CAT, BvM14-PrxR, BvM14-Trx, BvM14-APX, BvM14-DHAR3, and BvM14-MDHAR) in WT and GOX-related plants under salt stress; (g–l) antioxidant enzyme activities (BvM14-CAT, BvM14-PrxR, BvM14-Trx, BvM14-APX, BvM14-DHAR3, and BvM14-MDHAR) in WT and GOX-related plants under salt stress. Data were analyzed by Duncan’s analysis of variance, and different lowercase letters (a, b, c, d, e) indicate differences in gene expression and enzyme activities.
Figure 6. Analyses of relative gene expression and enzyme activities in PrxR-related plants under salt stress: (a–c) Analysis of the expression of antioxidative genes (BvM14-CAT, BvM14-APX, and BvM14-Trx) in WT and PrxR-related plants under salt stress; (d–f) antioxidant enzyme activity (BvM14-CAT, BvM14-APX, and BvM14-Trx) in WT and PrxR-related plants under salt stress. Data were analyzed by Duncan’s analysis of variance, and different lowercase letters (a, b, c, d) indicate differences in gene expression and enzyme activities.
Figure 6. Analyses of relative gene expression and enzyme activities in PrxR-related plants under salt stress: (a–c) Analysis of the expression of antioxidative genes (BvM14-CAT, BvM14-APX, and BvM14-Trx) in WT and PrxR-related plants under salt stress; (d–f) antioxidant enzyme activity (BvM14-CAT, BvM14-APX, and BvM14-Trx) in WT and PrxR-related plants under salt stress. Data were analyzed by Duncan’s analysis of variance, and different lowercase letters (a, b, c, d) indicate differences in gene expression and enzyme activities.
Figure 7. Analyses of relative gene expression and enzyme activities in APX-related plants under salt stress: (a,c) Analysis of the expression of antioxidative genes (BvM14-DHAR3 and BvM14-MDHAR) in WT and APX-related plants under salt stress; (b,d) antioxidant enzyme activity (BvM14-DHAR3 and BvM14-MDHAR) in WT and APX-related plants under salt stress. Data were analyzed by Duncan’s analysis of variance, and different lowercase letters (a, b, c, d, e) indicate differences in gene expression and enzyme activities.
Figure 7. Analyses of relative gene expression and enzyme activities in APX-related plants under salt stress: (a,c) Analysis of the expression of antioxidative genes (BvM14-DHAR3 and BvM14-MDHAR) in WT and APX-related plants under salt stress; (b,d) antioxidant enzyme activity (BvM14-DHAR3 and BvM14-MDHAR) in WT and APX-related plants under salt stress. Data were analyzed by Duncan’s analysis of variance, and different lowercase letters (a, b, c, d, e) indicate differences in gene expression and enzyme activities.
Figure 8. Regulatory networks of the six antioxidant enzymes in the BvM14: (a) The role of BvM14-GOX, BvM14-PrxR, BvM14-Trx, BvM14-APX, BvM14-DHAR3, and BvM14-MDHAR gene in antioxidant enzyme system; (b) the TF binding motifs in the promoter regions of BvM14-GOX, BvM14-PrxR, BvM14-Trx, BvM14-APX, BvM14-DHAR3, and BvM14-MDHAR; (c) localization of the more frequent cis-acting elements among the BvM14-GOX, BvM14-PrxR, BvM14-Trx, BvM14-APX, BvM14-DHAR3, and BvM14-MDHAR in the promoter regions. The cis-regulatory elements presented are labled with different colors and illustrated on the right side. The TATA-box and CAAT-box are not shown. (The dashed line indicates the transcript level and the solid line indicates the activity level; the arrows indicates positive; the lines indicates negative).
Figure 8. Regulatory networks of the six antioxidant enzymes in the BvM14: (a) The role of BvM14-GOX, BvM14-PrxR, BvM14-Trx, BvM14-APX, BvM14-DHAR3, and BvM14-MDHAR gene in antioxidant enzyme system; (b) the TF binding motifs in the promoter regions of BvM14-GOX, BvM14-PrxR, BvM14-Trx, BvM14-APX, BvM14-DHAR3, and BvM14-MDHAR; (c) localization of the more frequent cis-acting elements among the BvM14-GOX, BvM14-PrxR, BvM14-Trx, BvM14-APX, BvM14-DHAR3, and BvM14-MDHAR in the promoter regions. The cis-regulatory elements presented are labled with different colors and illustrated on the right side. The TATA-box and CAAT-box are not shown. (The dashed line indicates the transcript level and the solid line indicates the activity level; the arrows indicates positive; the lines indicates negative).
Comments (0)