
Remember me


Sickness absence (SA) and disability pension (DP) have consequences for society, for insurance agencies, for employers, and for the individual, in terms of financial losses, productivity losses, and a higher risk for future SA/DP.1,2
There is very little research about SA/DP among white-collar workers in the trade and retail industry, even though the trade and retail industry employs about 10% of those in activity (ie, employed, self-employed, or studying) in Sweden.3 Aside from one study on all privately employed white-collar workers in Sweden,4 most research on white-collar workers have used the Whitehall-II study of civil servants, of which the majority are white-collar workers,5–7 and the Helsinki Health Study of municipal workers, which includes both white-collar and blue-collar workers,8,9 both of which only include public employees. These studies have found differences in SA by sociodemographic and socioeconomic factors among white-collar workers.6,10 The aforementioned study on privately employed white-collar workers in Sweden also found differences by sociodemographic factors and branch of industry.4
Very little is known about SA in the trade and retail industry, despite its size.11 The trade and retail industry in general has relatively low rates of SA compared with other branches of industry.12 However, white-collar workers in the trade and retail industry comprise a range of different jobs, from executives and managers, to call-center operatives and administrative staff, and it is quite likely that the average numbers hide a large heterogeneity.
Some previous studies have found that SA rates are generally lower among white-collar workers than blue-collar workers.10,13 Although previous research has to a large extent focused on occupational groups with high SA rates, occupational groups with lower rates make up a substantial part of the labor market, and their SA has great implications for their companies, society, and themselves.4 In many countries, women have higher SA rates than men.14 Studies on the entire population have found differences in SA/DP by job-related factors such as job demands/job control15–21 and the size of the workplace.22 However, the extent to which this is also the case for privately employed white-collar workers is still unknown.
Currently, more than 100 different measures of SA are used in the literature.23–25 These mirror the challenges of SA research, such as skewed distributions of both the incidence and duration of SA, that many people have recurring events, that SA spells can be of different durations and grade, and that both incidence and duration matters, among others. The different measures use both different numerators (spells, days, individuals, etc) and different denominators (individuals at work, insured individuals, total individuals in the population etc). Different measures will lead to different results in the same data, for example, regarding gender differences in SA.4,26 Therefore, it is important to use several measures in studies of SA/DP.
The aim was to investigate future SA and/or DP in a cohort of white-collar employees in the trade and retail industry.
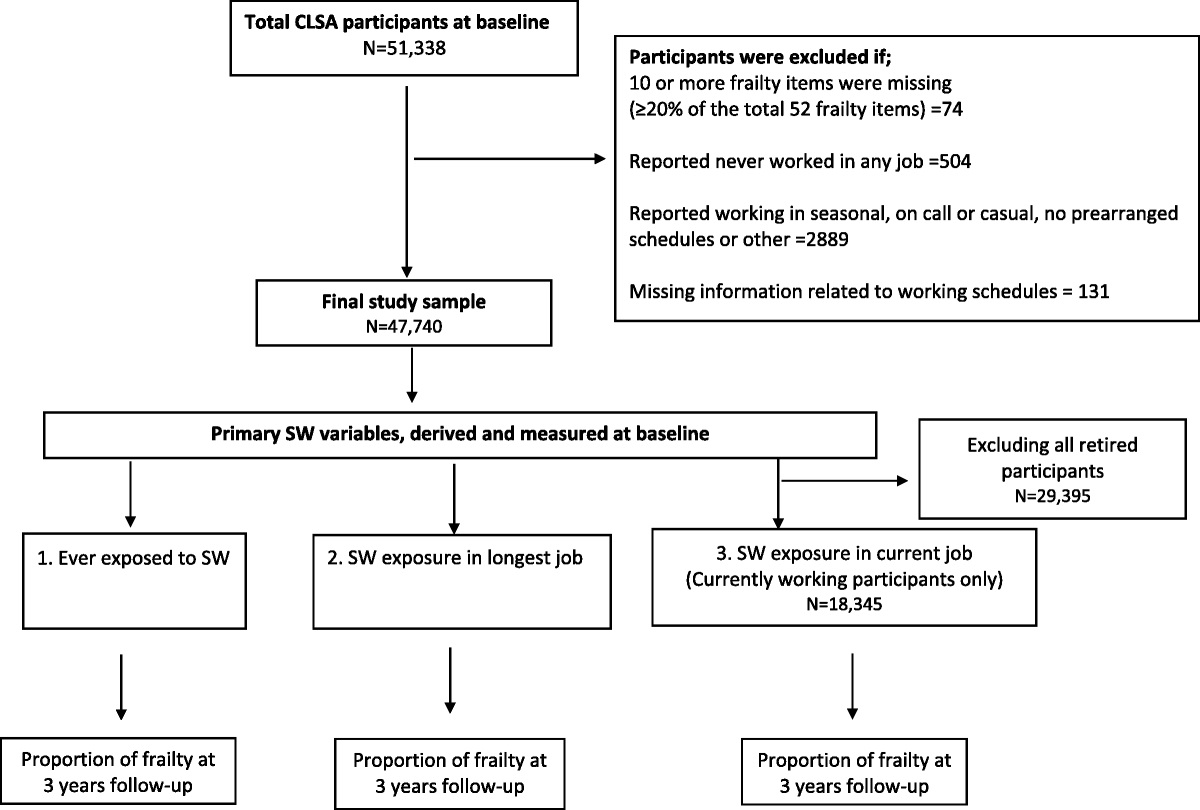
METHODSThis is a population-based prospective cohort study of SA/DP in 2010 to 2016 among the white-collar workers who in 2012 were aged 18 to 67 years and privately employed in the trade and retail industry, using different measures of their SA/DP.
Data and Study PopulationWe used microdata from 3 nationwide Swedish administrative registers, linked at individual level by the use of the personal identity number (a unique 10-digit number assigned to all residents in Sweden): (1) Longitudinal Integration Database for Health Insurance and Labour Market Studies held by Statistics Sweden; (2) MicroData for Analysis of the Social Insurance database held by the Social Insurance Agency; and (3) the Cause of Death Register held by the National Board of Health and Welfare.
The study population was all who were aged 18 to 67 years and registered as living in Sweden in both 2011 and 2012, had an occupational code according to the Swedish Standard for Occupational Classification that indicated a white-collar occupation, were employed at a private sector company in the trade and retail industry according to the Swedish Standard Industrial Classification, and during 2012 had income from work, parental benefits, and/or SA/DP that amounted to at least 7920 SEK (75% of the necessary income level to qualify for SA benefits from the Social Insurance Agency). The limit of 75% of the minimum income to qualify for SA benefits was set because, in many cases, SA benefits cover about 75% of the work income; without this adjustment, people with low incomes and long-term SA might have fallen below the minimum income level to be included in the study.27 Those who had full-time DP all of 2012 were excluded, whereas those who had SA or partial DP were included. This gave a cohort of 192,077 individuals.
In all analyses, individuals were excluded from the year after they emigrated or died, and they were also excluded from the analyses for a year if they did not have income from work, parental leave benefits, or SA/DP that year that exceeded 75% of the minimum income needed to qualify for SA benefits.
VariablesWe used information on the following variables from 2012 unless otherwise noted: sex: woman or man; age: 18 to 24, 25 to 34, 35 to 44, 45 to 54, 55 to 64, or 65 to 67 years; country of birth: Sweden, other Nordic country, other EU25, or rest of world including missing; educational level: compulsory school (≤9 years or missing), high school (10–12 years), or college/university (≥13 years); family situation: married/cohabiting with children at home, married cohabiting without children at home, single with children at home, or single without children at home; and type of living area: large city (Stockholm, Gothenburg, or Malmö), medium-sized town (>90,000 inhabitants within 30 km of city center), or small town/rural (<90,000 inhabitants within 30 km of city center).
For information on job demands/job control, we used a psychosocial job exposure matrix28 (for more details, see Ref. 29). We categorized individuals into 9 groups: high demands/high control, high demands/medium control, high demands/low control, medium demands/high control, medium demands/medium control, medium demands/low control, low demands/high control, low demands/medium control, and low demands/low control. Workplace size was categorized into 1 to 9 employees, 10 to 49 employees, 50 to 99 employees, 100 to 499 employees, and ≥500 employees.
Branch of industry in 2016 based on Swedish Standard Industrial Classification was categorized as follows: trade and retail, manufacturing, services, transport, construction and installation, care and education, or restaurants and hotels. Change of occupation between 2012 and 2016 based on Swedish Standard for Occupational Classification was categorized as follows: change within occupational category or no change, change of occupational category within the same major occupational group, change to a higher major occupational group (eg, from 2 to 1), change to a lower major occupational group (eg, from 1 to 2). Occupational sector in 2016 was categorized into municipal, region, state, private, or other.
Diagnosis-specific SA/DP was categorized into the following diagnosis groups: mental diagnoses (International Classification of Diseases, Tenth Revision, codes F00–F99 and Z73), musculoskeletal diagnoses (M00–M99), injuries (S00–T98 and V01–Y98), cancer (C00–D48), cardiovascular diagnoses (I00–I99), pregnancy-related diagnoses (among women: O00–O99 and N96), or other diagnoses (all other diagnoses, including missing).
MeasuresWe calculated the following SA/DP measures:
annual numbers and prevalence of people with SA/DP in 2010 to 2016 annual mean number of SA/DP net days per person in 2010 to 2016 annual mean number of SA/DP net days per person with SA/DP in 2010 to2016 annual mean number of SA/DP net days in different diagnosis groups in 2010 to 2016 odds ratios (ORs) for having SA/DP in 2016.We also ran sensitivity analyses for the ORs of having SA/DP in 2016, excluding all those who had any SA or DP in 2012.
The project was approved by the Regional Ethical Review Board of Stockholm, Sweden.
Public SA Insurance in SwedenAll people living in Sweden 16 years or older with an income from work or unemployment benefits are covered by the national public SA insurance and can claim SA benefits for a reduced work capacity due to disease or injury, without an upper age limit, although some restrictions to the length of SA apply after the age of 65 years. After a first qualifying day, the employer provides sick pay for days 2 to 14 of the SA spell, after which SA benefits are paid by the Social Insurance Agency. Those who are self-employed have more qualifying days. Those who are unemployed get SA benefits from the Social Insurance Agency after the first qualifying day. A physician certificate is required after 7 days of self-certification. In this study, data on SA with benefits from the Social Insurance Agency were used. Sickness absence spells ≤14 days were not included in the study, so as not to introduce bias regarding those who might have been unemployed. Sickness absence spells could be ongoing for years. All residents in Sweden aged 19 to 64 years, whose work capacity is permanently or long-term reduced because of disease or injury, can be granted DP from the Social Insurance Agency. Sickness absence benefits cover 80% of lost income, and DP benefits cover 64% of lost income, both up to a certain level.
Both SA and DP can be granted for part time or full time (25%, 50%, 75%, or 100% of ordinary work hours); this means that people can be on partial SA and DP at the same time. Therefore, we used net days so that partial days of SA/DP were combined. The number of net days were calculated using the number of gross days with benefits multiplied by the extent of absence (ie, 25%, 50%, 75%, or 100%), for example, 2 days of absence for 75% were counted as 1.5 net days.
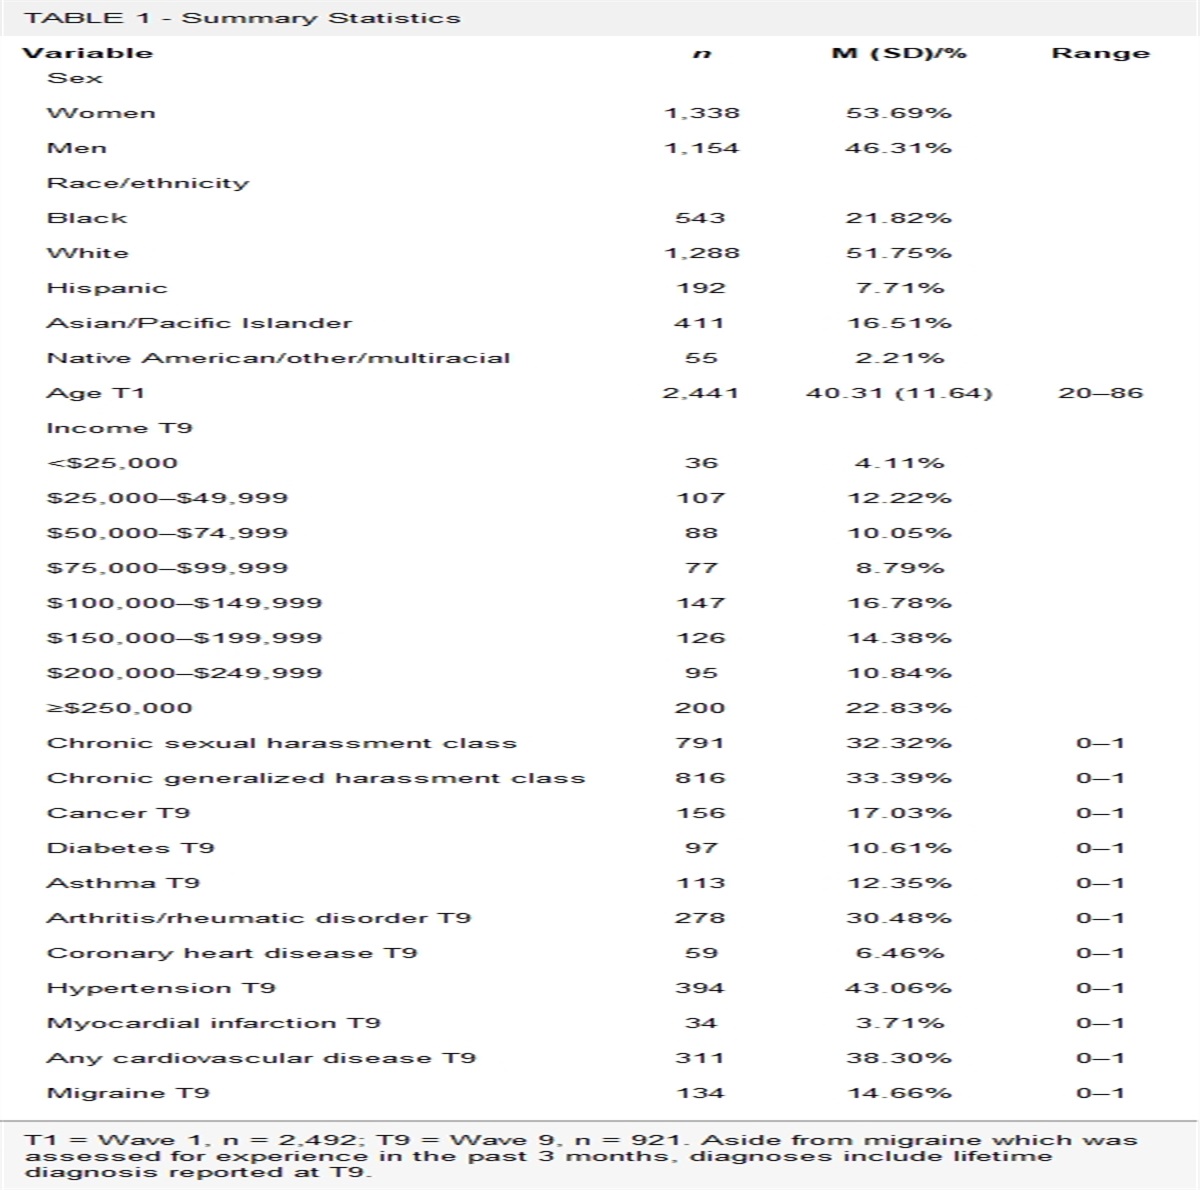
RESULTSTable 1 shows the sociodemographic characteristics of the cohort in 2012. There was a slightly higher proportion of men (55.56%), and the vast majority were aged 25 to 64 years.
TABLE 1 - Sociodemographic and Work-Related Information on the Study Cohort of Privately Employed White-Collar Workers at Baseline in 2012 Total Women Men n % n % n % All 192,077 100 85,356 100 106,721 100 Sex Women 85,356 44.44 Men 106,721 55.56 Age 18–24 y 8145 4.24 4485 5.25 3660 3.43 25–34 y 40,881 21.28 20,277 23.76 20,604 19.31 35–44 y 60,739 31.62 26,864 31.47 33,875 31.74 45–54 y 50,160 26.11 20,759 24.32 29,401 27.55 55–64 y 29,607 15.41 11,986 14.04 17,621 16.51 65–67 y 2545 1.32 985 1.15 1560 1.46 Type of living area Large city 99,445 51.77 46,242 54.18 53,203 49.85 Medium-sized town 60,893 31.70 25,431 29.79 35,462 33.23 Small town or rural 31,739 16.52 13,683 16.03 18,056 16.92 Educational level, y Elementary (0–9 y) 14,612 7.61 4778 5.60 9834 9.21 High school (10–12 y) 99,554 51.83 42,259 49.51 57,295 53.69 University/college (>12 y) 77,911 40.56 38,319 44.89 39,592 37.10 Country of birth Sweden 175,508 91.37 76,709 89.87 98,799 92.58 Other Nordic country 4243 2.21 2324 2.72 1919 1.80 Other EU-25 3457 1.80 1685 1.97 1772 1.66 Rest of the world 8869 4.62 4638 5.43 4231 3.96 Family situation Married/cohabiting without children 25,595 13.33 11,344 13.29 14,251 13.35 Married/cohabiting with children 96,068 50.02 40,530 47.48 55,538 52.04 Single without children 58,416 30.41 25,457 29.82 32,959 30.88 Single with children 11,998 6.25 8025 9.4 3973 3.72 No. employees at workplace 1–9 51,896 27.02 24,275 28.44 27,621 25.88 10–49 75,935 39.53 31,032 36.36 44,903 42.08 50–99 22,688 11.81 9626 11.28 13,062 12.24 100–499 32,752 17.05 15,948 18.68 16,804 15.75 ≥500 8806 4.58 4475 5.24 4331 4.06 Job control/demands Low control, low demands 21,967 11.44 16,854 19.75 5113 4.79 Low control, medium demands 16,930 8.81 11,406 13.36 5524 5.18 Low control, high demands 25,128 13.08 21,968 25.74 3160 2.96 Medium control, Low demands 20,444 10.64 8894 10.42 11,550 10.82 Medium control, medium demands 21,919 11.41 6558 7.68 15,361 14.39 Medium control, high demands 21,663 11.28 12,486 14.63 9177 8.60 High control, low demands 21,614 11.25 2404 2.82 19,210 18.00 High control, medium demands 25,177 13.11 1641 1.92 23,536 22.05 High control, high demands 17,235 8.97 3145 3.68 14,090 13.20The majority among both women and men lived in large cities (Stockholm, Gothenburg, or Malmö) and were born in Sweden. A very small proportion (5.60% of women and 9.21% of men) had only elementary education, whereas 44.89% of women and 37.10% of men had at least some college/university education. The majority were married/living with partner with children younger than 18 years living at home, but more than twice the proportion of women (9.40%) than men (3.72%) were single with children living at home.
Supplementary Figure 1, https://links.lww.com/JOM/B149, shows the distribution of job demands/control for all and for women and men in a kernel density plot. Among the entire population, the distribution seemed fairly even; however, although the level of demands was equally distributed among women and men, there were far more women in jobs with low control and far more men in jobs with high control.
Figure 1 shows the proportions of women and men who had at least some SA/DP during each of the study years 2010 to 2016. Each year, the proportions who had SA/DP were higher among women (8%–13%, depending on year) than men (3%–6% depending on year). The proportion of the cohort who had SA/DP increased slightly between 2010 (8% of women and 4% of men) and 2016 (15% of women and 6% of men).
 FIGURE 1:
 Proportions of white-collar workers in the trade and retail industry in the 2012 cohort who had any SA/DP, in each of the years 2010 to 2016, stratified by sex. DP, disability pension; SA, sickness absence.
Figure 2 shows the annual mean number of SA/DP days per person (A) and per person with SA/DP the respective year (B) during 2010 to 2016. The mean number of SA/DP days increased each year, from 6.6 mean days among women in 2010 to 13.5 in 2016 and from 2.7 to 5.7 among men, except for a slight dip in 2014 among both women and men. Women had more SA/DP days than men each year, and the increase in SA/DP days was slightly larger among women than men.
 FIGURE 2:
 Mean number of SA and DP days per employed person and year (A) and per person with SA/DP in the respective year (B). DP, disability pension; SA, sickness absence.
The annual mean number of SA/DP days per person with SA/DP was, as expected, much higher than the number of net days per employed person but also increased from 80.7 mean days among women in 2012 to 100.3 in 2016 and from 73.9 to 96.0 days among men, with a slight dip in 2014. There were larger sex differences in the mean number of SA/DP days per employed person than the mean number of SA/DP days per person with SA/DP.
In Figure 3, the annual mean number of SA/DP days is presented by diagnosis groups. The mean number of days increased over the studied years among both women and men, especially days due to mental diagnoses. The increase in the other diagnosis groups was smaller, leading to mental diagnoses constituting an increasing proportion of SA/DP days.
 FIGURE 3:
 Mean number of net days with SA and DP, respectively, per person and year in different diagnosis groups. DP, disability pension; SA, sickness absence.
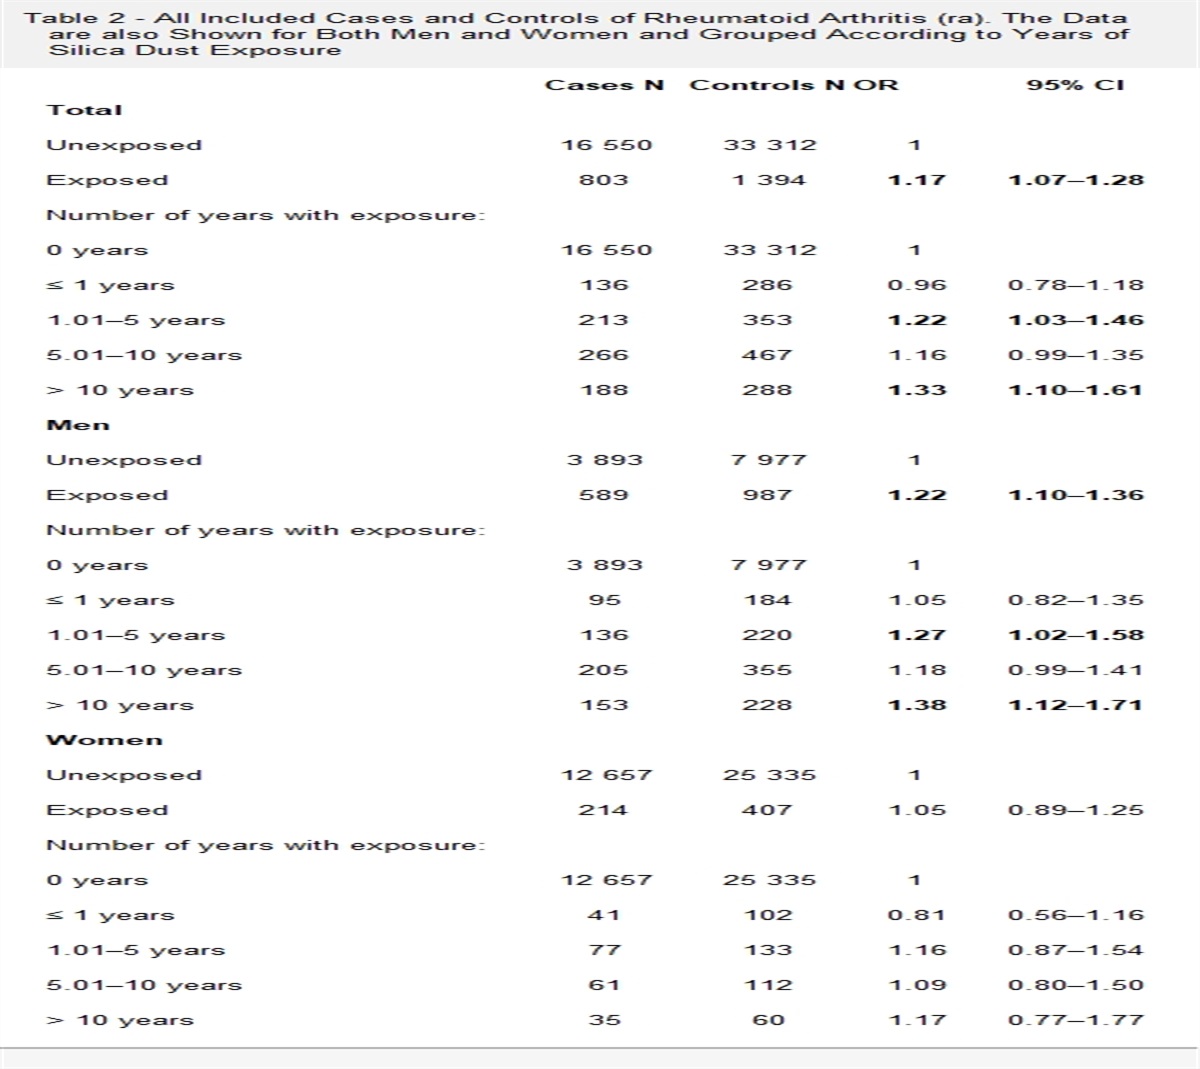
Table 2 presents OR and 95% confidence intervals (CIs) for the risk of having SA/DP in 2016. Men had a lower risk than women of such SA/DP (OR, 0.46; 95% CI, 0.44–0.49). Those who were aged 65 to 67 years in 2012 were much less likely to have SA in 2016 (OR, 0.09; 95% CI, 0.05–0.18) than those aged 35 to 44 years. Otherwise, the ORs by age were relatively close to 1, rarely over 1.50 or under 0.67, with one exception: OR for men aged 55 to 64 years was 1.80 (95% CI, 1.64–1.97).
TABLE 2 - Crude and Mutually Adjusted ORs and 95% CIs Over the Association Between Sociodemographic and Job-Related Factors in 2012 With SA and/or DP in 2016 Total Women Men Crude OR (95% CI) Adjusted OR (95% CI) Crude OR (95% CI) Adjusted OR (95% CI) Crude OR (95% CI) Adjusted OR (95% CI) All 192,077 85,356 106,721 Sex Women Ref Ref Men 0.42 (0.40–0.43) 0.46 (0.44–0.49) Age 18–24 y 0.94 (0.86–1.02) 0.84 (0.76–0.93) 0.84 (0.76–0.93) 0.85 (0.75–0.96) 0.86 (0.73–1.02) 0.76 (0.63–0.91) 25–34 y 1.04 (0.99–1.09) 1.01 (0.96–1.06) 1.03 (0.98–1.09) 1.05 (0.99–1.12) 0.89 (0.82–0.97) 0.88 (0.81–0.96) 35–44 y Ref Ref Ref Ref Ref Ref 45–54 y 1.22 (1.17–1.27) 1.19 (1.13–1.24) 1.18 (1.12–1.24) 1.09 (1.03–1.16) 1.38 (1.29–1.47) 1.36 (1.27–1.47) 55–64 y 1.11 (1.06–1.16) 1.28 (1.02–1.36) 0.91 (0.85–0.97) 0.97 (0.89–1.06) 1.55 (1.44–1.67) 1.80 (1.64–1.97) 65–67 y 0.04 (0.02–0.08) 0.09 (0.05–0.18) 0.04 (0.01–0.08) 0.07 (0.03–0.18) 0.06 (0.03–0.15) 0.14 (0.05–0.37) Type of living area Large city (Stockholm, Gothenburg, Malmö) Ref Ref Ref Ref Ref Ref Medium-sized town (>90,000 inhabitants) 1.10 (1.06–1.14) 1.07 (1.03–1.11) 1.14 (1.08–1.19) 1.07 (1.01–1.12) 1.19 (1.12–1.25) 1.07 (1.00–1.14) Rural (<90,000 inhabitants) 1.27 (1.21–1.32) 1.15 (1.10–1.21) 1.27 (1.21–1.34) 1.15 (1.08–1.23) 1.37 (1.28–1.46) 1.14 (1.05–1.23) Educational level Elementary (≤9 y) 1.51 (1.43–1.60) 1.64 (1.53–1.75) 1.54 (1.42–1.67) 1.54 (1.40–1.69) 2.20 (2.02–2.40) 1.83 (1.65–2.02) High school (10–12 y) 1.30 (1.26–1.35) 1.29 (1.25–1.34) 1.28 (1.23–1.34) 1.22 (1.17–1.28) 1.66 (1.57–1.76) 1.51 (1.41–1.61) University/college (>12 y) Ref Ref Ref Ref Ref Ref Birth country Sweden Ref Ref Ref Ref Ref Ref Other Nordic countries 1.24 (1.12–1.37) 1.01 (0.98–1.23) 1.06 (0.93–1.19) 1.08 (0.94–1.24) 1.30 (1.10–1.55) 1.16 (0.96–1.41) Other EU25 0.99 (0.88–1.12) 0.98 (0.86–1.12) 0.96 (0.83–1.11) 1.01 (0.87–1.19) 0.9 (0.73–1.11) 0.94 (0.74–1.20) Rest of the world 1.27 (1.19–1.36) 1.24 (1.15–1.34) 1.17 (1.08–1.28) 1.17 (1.07–1.29) 1.15 (1.02–1.3) 1.35 (1.18–1.54) Family situation Married/cohabitant without children at home Ref Ref Ref Ref Ref Ref Married/cohabitant with children at home 0.93 (0.89–0.98) 0.90 (0.85–0.96) 0.98 (0.92–1.05) 0.83 (0.77–0.90) 0.89 (0.83–0.96) 1.00 (0.91–1.10) Single without children at home 1.04 (0.99–1.10) 1.06 (1.00–1.13) 1.06 (0.99–1.13) 1.00 (0.92–1.09) 1.02 (0.94–1.10) 1.17 (1.06–1.29) Single with children at home 1.69 (1.58–1.81) 1.18 (1.10–1.28) 1.47 (1.36–1.60) 1.13 (1.02–1.24) 1.28 (1.12–1.46) 1.26 (1.08–1.46) SA in 2012
Comments (0)