
Remember me


The upper urinary tract (UUT) consists of the kidneys and ureters. Its primary function is to collect and transport urine to the bladder, where it is stored and excreted periodically to eliminate biological waste from the human body (Elbadawi, 1996; Fowler et al., 2008; Hickling et al., 2015). The functioning and performance of the UUT underpins the integrity of the human urogenital system, having a significant impact on individual health and well-being. Malfunctions and complications of the UUT can happen at all stages of life, for reasons such as congenital anomalies, urinary tract infections (UTIs), urolithiasis (i.e., urinary stones), and cancers (e.g., kidney cancer and ureteral cancer), all of which require urological interventions. This has motivated the development of many models to gain insight into the various physiological and pathological characteristics of the UUT to address scientific and clinical questions.
Of all approaches, fluid mechanical modeling serves a pivotal role in the study of the UUT. The primary fluid medium within the UUT is urine, whose behavior is governed by well-known fluid mechanical principles, and faithful modeling of the flow environment underpins (mechano-)biological investigations of the UUT. Over the past few decades, a number of theoretical, computational, and experimental efforts have contributed to the realization of anatomically and physiologically meaningful models, and the methodologies adopted by these works are of archival value.
In this article, we focus on the historical evolution of fluid mechanical models of the UUT derived via complementary approaches. To elucidate the basis of all modeling work, we first summarize the physiological and mechanical characterizations of the UUT, and provide the parameter values required to calibrate any fluid mechanical model. Subsequent discussions are divided into three sections based on each modeling approach, that is, reduced order methods, computational methods, and experimental methods. As such, we aim to provide a comprehensive overview of the subject for engineers, scientists, and clinicians interested into fluid mechanical modeling of the UUT, calling forth new perspectives to go beyond the status quo.
2 PHYSIO-MECHANICAL CHARACTERIZATIONSThe UUT is a multi-organ and dynamic system, which requires a large number of parameters to fully describe its mechanical and physiological characteristics. Clinically relevant models depend on selecting physiologically meaningful values for each associated parameter. In this section, we present physiological values from the literature for the fundamental mechanical parameters of the UUT (e.g., geometries, pressures, and flow rates), and briefly discuss the physio-mechanical characteristics of each organ. Note that, all values are taken from the human UUT unless otherwise stated.
2.1 KidneysThe kidneys are responsible for the production and collection of urine. Each kidney contains around one million functional units (nephrons) that amass urine through a branched collecting system that drains into the renal calyces. All calyceal branches connect to the renal pelvis, and the ureteropelvic junction (UPJ) connects the renal pelvis to the proximal (i.e., close to the kidney) ureter (Figure 1(a)). Mechanical and mathematical characterization of renal physiology have been reviewed by Bykova and Regirer (2005) and Spirka and Damaser (2007), where the circulation of blood and mass transfer in the nephron are discussed. In the current context, that is, to study the urine flow within the UUT, the kidney is often treated as a boundary condition (BC) for the ureter, where the intraluminal renal pelvic pressure (RPP) and inlet flow rate are most relevant parameters.

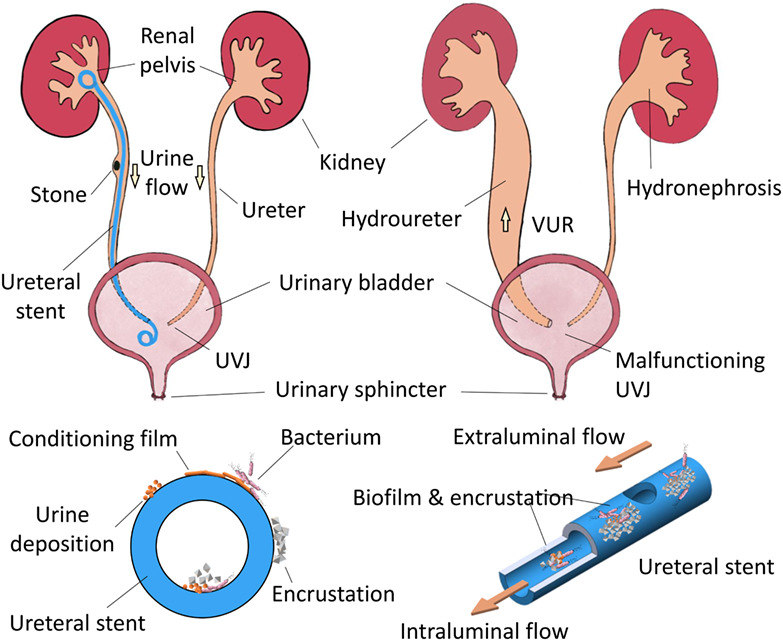
Illustration of the urinary tract under various physiological and pathological conditions. (a) On the left: a ureter obstructed by an urinary stone and implanted with a Double-J (DJ) stent to maintain drainage. The two pigtails are situated in the renal pelvis and bladder, respectively. On the right: a healthy ureter. (b) On the left: a ureter with congenital ureterovesical junction (UVJ) malfunction, causing primary vesicoureteral reflux (VUR). The VUR, which is the retrograde ascension of urine flow, may induce hydroureter and hydronephrosis. On the right: a ureter with congenital UVJ obstruction, which impedes the drainage of urine and leads to hydronephrosis. (c) Cross sectional view of the ureteral stent. Stages of biofilm and encrustation formation are illustrated on the stent surface. (d) Three dimensional view of the ureteral stent showing a side hole, which is designed to promote exchange between intraluminal (within the lumen of the stent) and extraluminal (between the external surface of the stent and the ureter wall) urinary flows. Structures comprising both biofilm and encrustation can be formed on both internal and external surfaces of the stent, causing further complications for patients
The actual value of the RPP averages about 12–15 cm H2O (Rattner William et al., 1957; Walzak & Paquin, 1961), and is generally considered to be below 20 cm H2O for healthy individuals. The urine production rate has been shown to vary between 0.3 and 2.4 ml/min for each kidney (Ohlson, 1989), and might be significantly higher for people with pathological conditions such as polyuria and diabetes mellitus.
In terms of relevant dimensions, in a study of 665 adults from 30 to 70 years old (Emamian et al., 1993), 87% of the subjects have transverse diameters of the renal pelvis smaller than 10 mm. The lower limit is not reported, but the average transverse diameter of the fetal renal pelvis (12–25 weeks) has been reported as 3.6 mm (Lobo et al., 2011). The anteroposterior diameter of renal pelvis measures approximately 5 mm at age 18–19, with an upper limit (95 percentile) of 15 mm (Chitty & Altman, 2003; Schaeffer et al., 2016). In the presence of obstruction and subsequent hydronephrosis, the anteroposterior diameter can reach up to 21–38 mm with patient age between 6 weeks and 16 years (Mesrobian, 2009). In the context of fluid mechanical modeling, the renal pelvis is usually treated as a solid boundary, and it is physiologically reasonable to assume a circular cross section of approximately 10 mm in diameter. In the case of oncological patients, tumor growth in the kidney will dynamically alter the regional tissue composition and the geometry of UUT, which will in turn affect its fluid mechanical performance. Thence, the material properties of the renal pelvis, such as Young's modulus and Poisson ratio, should be considered when modeling certain physio-pathological conditions (Chen et al., 2013).
2.2 BladderThe urinary bladder, or simply bladder, is considered as part of the lower urinary tract (LUT), and has been examined quite extensively in urodynamic studies to diagnose and better understand LUT symptoms. In the context of UUT modeling, the bladder compartment is typically introduced as a BC, and its storage volume and pressure profiles are of primary interest.
The bladder is a hollow, distensible organ, which receives urine drained from both ureters and voids periodically (referred to as micturition) through the urethra. The storage volume of bladder varies largely between individuals, but is generally assumed to be around 500 ml (Bykova & Regirer, 2005). According to a retrospective study of 976 urodynamic records from individuals with no pathological conditions, the voided volume averages at 508 (±225) ml for males and 468 (±203) ml for females, which is an indication of the bladder capacity (Alou's et al., 2010). Further, the bladder capacity has been reported to decrease with age, and can be affected by other diseases (Dionne Ananias et al., 1987). Notably, there is often a small postvoid residual urine volume in the normal bladder. The postvoid volume is generally smaller than 50 ml (Alloussi et al., 2010), and increased residual volumes can cause urinary tract infections (the larger the volume the higher the risk).
The bladder wall is comprised of smooth muscle fibers oriented in different directions. These smooth muscles are collectively known as the detrusor muscle. The true bladder pressure is usually defined as the detrusor pressure, which is calculated by subtracting the intra-abdominal pressure (IAP) from the intravesical pressure (IVP). From conventional urodynamic tests, the IAP is usually taken as the intrarectal pressure, measured with a catheter inserted at least 10 cm into the rectum (McCarthy, 1982). The IVP is the pressure inside the bladder, which is usually measured with a catheter inserted through the urethra. The normal IAP at rest averages at about 8 cm H2O for healthy individuals, and increases to higher baseline levels from supine to standing position (Schäfer et al., 2002). The baseline IAP is also reportedly higher for morbidly obese patients (De Keulenaer et al., 2009).
The detrusor pressure varies during the two defined stages of bladder function, that is, the filling phase, and the voiding phase. The viscoelastic properties of the bladder wall allow for increases in bladder volume with little change in detrusor pressure. During the filling phase, the detrusor muscle stays relaxed, and the detrusor pressure remains small (roughly between 2 and 5 cm H2O). During the voiding phase, the detrusor muscle contracts, causing a rise in detrusor pressure especially in men due to the greater hydraulic resistance offered by the prostate. In the retrospective study of Alloussi et al. (2010), the detrusor pressure at maximum flow rate during micturition is reported as 38.3 (±11.5) cm H2O for males and 32 (±10.6) cm H2O for females, with averaged (peak) flow rates through the urethra higher than 24 ml/s.
A final consideration about bladder physiology relates to its temporal dynamics, which is linked to the urine production rate, and the outflow rate through the urethra. The duration of the filling phase varies largely with the activity of the individual, and can be easily accelerated (decelerated) by increasing (decreasing) the fluid intake. For healthy individuals, the voiding time has been reported to be around 40 s (Alloussi et al., 2010), provided that both bladder capacity and voiding flow rate are within the normal range.
2.3 UretersThe ureters are long collapsible fibromuscular tubes that pass urine from the kidneys to the bladder. The proximal ureter starts at the UPJ, and the distal (i.e., close to the bladder) ureter obliquely enters the bladder wall at the ureterovesical junction (UVJ). The ureter passes through the detrusor muscle and travels submucosally for 1.5–2 cm before entering the bladder lumen at the ureteral orifice (Hickling et al., 2015). This creates a valve-like mechanism when the IVP is applied to the UVJ, preventing urine from flowing back up into the ureter (Juskiewenski et al., 1984).
The length of the ureter is approximately 22–30 cm (Hickling et al., 2015), and its diameter varies from 1 to 6 mm with an average of 1.8 mm as measured 1–2 cm below the UPJ (Zelenko et al., 2004). The diameter is physiologically smaller at the UPJ, UVJ, and where the ureters turn medially and cross the common iliac vessels. In the case of urolithiasis with obstruction, the diameter has been shown to vary between 1 and 20 mm with an average of 7 mm (Zelenko et al., 2004), but could potentially exceed this range depending on the pathological condition.
The intraluminal pressure of the ureter is similar to that of the renal pelvis in healthy ureters, averaging at 13.5 cm H2O in midureter, and 13 cm H2O in the lower third of the ureter (Rattner William et al., 1957). These values can be substantially increased in presence of an obstruction (either internal or external) or implanted stent (Cormio et al., 1994; Rattner William et al., 1957; Shao et al., 2009). In some cases, urine flow is modeled as a pressure driven flow with fixed BCs, such that the pressure difference between UPJ and UVJ is prescribed. Considering the values given above, the pressure difference, that is, subtracting IVP from RPP, falls in the order of 2 cm H2O during the filling phase.
Regarding the structural properties of the ureter, the cross section of contracted human ureter resembles a stellate shape. The thickness of the ureter wall, including epithelium, lamina propria, and muscularis, measures about 1 mm (Wolf et al., 1996). However, it significantly thickens and stiffens with age (Sokolis, 2020; Sokolis et al., 2017). In various UUT studies, ureters are often simplified to straight circular tubes, neglecting the stellate lumen shape.
Finally, to model the compliance of the ureter wall, the distensibility becomes relevant, which is defined as the change in diameter due to the intraluminal pressure (Equation 12), and it has been reported as 2 cm H2O/mm (Griffiths, 1987). The reported elastic modulus of human ureter is 3.48 ± 0.47 MPa along the longitudinal direction, and 2.31 ± 0.46 MPa in the circumferential direction (Rassoli et al., 2014). These values are important to model the wall dynamics of the ureter, especially in the presence of peristaltic waves.
2.4 Ureteral peristalsisIn the human ureter, smooth-muscle cells located near the renal pelvis (Figure 1(a), (b)) border are thought to act as the pacemakers of ureter peristalsis, which is a traveling contraction wave that drives the flow of urine from the kidneys to the bladder (Rasouly & Lu, 2013). These waves are mostly monophasic, traveling at speeds of approximately 2–3 cm/s, and are typically 6–10 cm in length (Griffiths, 1987, 1989). The peristaltic wave happens about 1–8 times per minute in normal human, and averages about three times per minute (Edmond et al., 1970; Weinberg & Maletta, 1961). According to the measurement taken from 17 healthy adult females, the maximum pressure amplitude averages 17.5 cm H2O in the midureter, and 22 cm H2O in the lower ureter (Rattner William et al., 1957). From other studies (i.e., Griffiths, 1987, 1989; Weinberg & Maletta, 1961), this peak pressure value varies between 15 and 50 cm H2O in normal humans, and is generally larger toward the lower part of ureter.
Note that the ureteral peristalsis is strongly affected by the presence of an implanted ureteral stent, even ceasing completely, as concluded from several experiments using porcine models (Kinn & Lykkeskov-Andersen, 2002; Venkatesh et al., 2005). Retrograde peristalsis, aberrant waves, and incomplete contractions have all been reported. In the study by Venkatesh et al. (2005), all peristaltic movements were stopped regardless of the stent size. Due to the anatomical similarity between porcine and human UUT (Sampaio et al., 1998), it is reasonable to conclude that the same applies to the human UUT. In fact, Mosli Hisham et al. (1991) reported that for patients with indwelling double-pigtail stents the peristaltic waves were sluggish and averaged to 1–2 waves per minute. Therefore, it is common to neglect the peristalsis in fluid mechanical models of stented ureter, especially in experimental investigations. A summary of the values of various parameters used in previous models associated with the ureter is given in Tables A2 and A3 for reference.
2.5 Ureteral stentUreteral stents, as an integral part of modern urologist's armamentarium, are indispensable devices often used to drain UUT in the case of obstruction or to avoid obstruction after an intervention as a complement to Shock Wave Lithotripsy (SWL) or kidney transplant (Haleblian et al., 2008). In spite of their common use and various design upgrades since their first introduction in the 1960s (Donahue et al., 2018; Khoo et al., 2018; Mosayyebi, Manes, et al., 2018; Zimskind Paul et al., 1967), pain, bladder irritation, flank pain due to reflux, and sexual dysfunction associated with implanted stents significantly compromise patients' quality of life (Ringel et al., 2000; Shaw et al., 2005), and may cause serious infections (Scotland et al., 2019). For some patients, such as those with advanced malignant obstruction, or those not fit for definitive surgery, long-term stenting is required. The usual maximum lifespan of an indwelling long-term ureteral stent is approximately 6 months. However, the real lifespan is often reduced due to a range of complications, which include biofilm formation and infection, obstruction and encrustation. These necessitate more frequent stent replacements, sometimes every few weeks, which is inconvenient for the patient and places an increased burden on the healthcare system. The development of biofilm and encrustation on stent surfaces (Figure 1(c), (d)) therefore remains one of the most challenging topics in both research and clinical studies of the UUT (Ramachandra et al., 2020; Ramstedt et al., 2019; Sali & Joshi, 2020), and UUT models are often developed to investigate aspects of ureteral stents and their performance.
The state-of-the-art ureteral stents are polymer stents about 24–32 cm in length and 1–2 mm in outer diameter with a circular cross section. Other cross-sectional shapes have also been documented such as multiple shallow grooves on the surface or a three- or four-edged stellate shape (Birch et al., 1988). They usually feature pigtails on each end (Figure 1(a)) as a feature to prevent dislocation, and side holes are often distributed along the whole length of the stent to promote the exchange of intraluminal and extraluminal flows (Figure 1(d)), although the efficacy of side holes is still debatable.
As an alternative to polymer stents, metallic stents are sometimes favored in the case of extrinsic ureteral compression for their higher tensile strength (Hendlin et al., 2012; Khoo et al., 2018). In recent years, research into biodegradable stents has become more active (Barros et al., 2018; Soria et al., 2018; Zhu et al., 2017), driven by the need to eliminate the problem of forgotten stents and reduce the number of hospital visits. The current investigations are however primarily focused on the material degradation and stent migration as the stent dissolves. To the best of the authors' knowledge, there is no available report on the fluid mechanical performances of biodegradable stents over time.
To study the performance of stents in a systematic way, various models have been deployed to date under different assumptions. Generally, bench-top in-vitro models allow rapid testing for a range of clinical scenarios, where stents of various material properties and geometries can be tested as is with minimal assumptions. In comparison, both reduced order models and computational models treat indwelling stents as rigid, circular, and hollow tubes. Generally, the geometry and configuration of side holes are faithfully replicated in computational models, and simplified to permeable walls in reduced order models. A summary of the stent parameters previously investigated in UUT models is given in Table A4 for reference.
Furthermore, to evaluate the impact of indwelling time on stent integrity and drainage performance, the material property of stents (especially its variation over time) becomes relevant (Arkusz et al., 2020). Such variation depends not only on the material fatigue caused by body movements, but also on the chemical composition of urine, which promotes the development of biofilm and encrustations and potentially compromises the integrity of the stents (Shilo et al., 2020).
2.6 UrineHuman urine is not sterile. As a biological waste, it typically contains a wide range of metabolic breakdowns from food, drinks, drugs, and so on, as well as bacterial by-products (Tang, 2017). As a result, the mechanical properties and chemical composition of urine incorporate both intrasubject and intersubject variability. Artificial urine (AU) is therefore often used as the working fluid for most modeling studies to ensure reproducibility. Recipes of AU compositions can be found in Greenwood and O'Grady (1978), Tunney et al. (1996), Schlick and Planz (1998), Mosayyebi, Manes, et al. (2018), Khandwekar and Doble (2011), Barros et al. (2015), Cauda et al. (2017).
The mechanical properties of AU are similar to that of water (and normal urine) with a density of approximately 1 g/cc and dynamic viscosity of 0.01 g/(cm s), and are generally taken as constant. If temperature effects are of interest, the previously reported monotonic variation of kinematic viscosity from 0.011 g/(cm s) at 37°C to 0.007 g/(cm s) at 42°C might be considered (Inman et al., 2013). The working temperature for AU is generally set to be within 35–40°C to simulate the human environment (Cauda et al., 2017, Choong et al., 2000, Chua et al., 2017, Mosayyebi, Manes, et al., 2018, Mosayyebi, Yue, et al., 2018). The pH value of normal human urine averages around 6 (Tang, 2017), and various studies have prescribed pH values between 5 and 9 (Chua et al., 2017; Hobbs et al., 2018; Schlick & Planz, 1998) to study the chemical or biological characteristics of urine. Table A5 summarizes the parameters of (artificial) urine previously used in various UUT models.
2.7 Pathological changesThe UUT is subject to a range of congenital anomalies and acquired pathological conditions. As such, the physio-mechanical characterization of the UUT is subject to differences in terms of topology, pressure, material properties, and so on. This section discusses some of the common conditions and briefly points out the possible changes of various parameters resulting from anomalies and pathological conditions in a qualitative manner.
Congenital anomalies of the UUT are one of the major concerns among pediatric urology. Common anomalies of the ureter and associated junction structures (e.g., ureterocele) ultimately leads to abnormal urine transport such as obstructions and primary vesicoureteral reflux (VUR), which is the retrograde ascension of urine from bladder back into the ureters. These conditions eventually cause dilation of the renal pelvis (i.e., hydronephrosis) and the affected ureters (i.e., hydroureter or megaureter), as illustrated in Figure 1(b). In such cases, both the change of the junction structure (e.g., restricted opening) and the increase of intraluminal pressure in the UUT need to be considered.
Acquired pathological conditions such as urolithiasis (Figure 1(a)) and upper tract tumors can both impede the normal transport of urine in the UUT, and often require long-term stenting. In the presence of indwelling stent, the normal peristalsis of the ureter wall is reduced or stopped, and the intraluminal pressure is considerably increased (Shao et al., 2009). Furthermore, the presence of stent prevents the UVJ from closing properly and causes secondary VUR (Mosli Hisham et al., 1991), which in turn leads to increased pressures in the ureter and renal pelvis. Notably, due to the extra resistance caused by prostate in male patients, the detrusor pressure during voiding is usually higher than that of women. Therefore, men are more likely to feel the reflux, which is often associated with pain.
Another crucially important issue is the development of biofilm and encrustations over time on the surfaces of inserted urological devices. As the foreign materials are in contact with urine, a layer of absorbed biological substances forms on the material surfaces, referred to as the conditioning film. This film alters the surface roughness and topology of the stent, facilitating adhesion and colonization of various microparticles and microorganisms (Ramstedt et al., 2019; Scotland et al., 2019). This process eventually leads to the formation of biofilm and encrustations on material surfaces (Figure 1(c)). As the biofilm and encrustation grow, the intraluminal flow can be completely hindered (Figure 1(d)). With increasing population of microparticles and microorganisms, the Newtonian viscous fluid model of urine fails, and multiphase, non-Newtonian formulations might be more appropriate (Chrispell & Fauci, 2011; Jiménez-Lozano et al., 2011; Riaz & Sadiq, 2020).
3 REDUCED ORDER METHODSOne approach to develop theoretical models of the fluid inside a (stented) ureter is to exploit the disparate length scales inherent in the system to obtain reduced models that retain the key physics, but are simpler to solve than full computational models. These models can be used to reveal the underlying mechanisms of the system, and complement full computational simulations in anatomically realistic geometries.
In this context, lubrication theory is often exploited to derive reduced models of the UUT. The use of lubrication theory is motivated by the small aspect ratio of the ureter (i.e., ratio of radius to length is small) and small Reynolds number which allows fluid inertia to be neglected (Carew & Pedley, 1997; Cummings et al., 2004; Lykoudis & Roos, 1970; Roos & Lykoudis, 1971). In the lubrication regime, the flow is predominantly in the axial direction, and the pressure does not vary in the transverse direction. The model geometry is often taken to be axisymmetric or 2D Cartesian.
In most fluid mechanical models of the UUT, the urine is typically modeled as an incompressible Newtonian fluid. Such flow is governed by the continuity equation and the Navier–Stokes (N–S) equations. For the axisymmetric case (no variation in the azimuthal direction and no azimuthal flow), the governing equations are given in the cylindrical polar coordinate system as∂w∂z+1r∂ru∂r=0∂p∂z=μr∂∂rr∂w∂r∂p∂r=0(1)
where (z, r) are the axial and radial coordinates with corresponding velocity components (w, u), μ is dynamic viscosity, and p is the fluid pressure. The governing equations must be solved subject to appropriate BCs. Lykoudis and Roos (1970), and Roos and Lykoudis (1971) derived perhaps the earliest reduced order models for the UUT. They modeled the healthy ureter as an axisymmetric tube, and peristalsis of the ureter wall by prescribing the local shape of the ureter wall distal to the collapse as r = h(z − ct), where h ∼ zn is a polynomial function of z, n is an arbitrary constant (n ≥ 1), and c is the speed of the traveling wave (as shown in Figure 2(a)). In a Lagrangian axisymmetric coordinate system moving with the wave speed c, the wave appears stationary and the wall moves leftward with speed c. The governing Equations (1) are solved subject to:w=−catr=hz,(2)
∂w∂r=0atr=0,(3)
u=0atr=0.(4)
When a catheter is inserted into the ureter (Roos & Lykoudis, 1971), the governing Equations (1) become subject to w = − c at r = h(z), w = − c at r = a, and u = 0 at r = a, where a is the radius of the catheter and a ≤ b, b being the ureter radius in the collapsed state (Figure 2(a)). Schematic sketch for the general setup of reduced models. Different parts of the urinary tract are color coded. (a) Unstented ureter with travelling waves, and the geometry of the reduced ureter model (Lykoudis & Roos, 1970), where c is the wave speed of the peristaltic wave, b is the radius of the occluded ureter, h is the local radius of the expanded ureter. (b) Stented ureter with prescribed renal pelvis and bladder pressures (Pk and Pb, respectively) as BCs (Cummings et al., 2004; Siggers et al., 2009). The stent is modeled with permeable walls to incorporate the effect of side holes. Encrustations are also included by the local variation of stent geometry
While Roos and Lykoudis (1971) and Lykoudis and Roos (1970) considered the pressure distribution within the ureter due to prescribed peristaltic waves of the ureter wall, their model neglected the bladder and kidney. As a result, a major limitation of these models is that they cannot be used to describe clinical conditions such as reflux. Additionally, material properties of the stent, ureter walls, and so on are overlooked. This was remedied by Cummings et al. (2004), who proposed the subsequent model to study reflux within stented ureters. The setup of the model is shown in Figure 2(b). In this case, the fluid domain consists of the fluid inside the stent (intraluminal), and the fluid between the stent and the ureter wall (extraluminal). One of the advantages of this model is the inclusion of side holes by assuming constant permeability λ of the stent wall. Scenarios with different number of side holes on the stent can be modeled by varying the permeability. The BCs state that the inner and outer radial velocities across the stent wall are equal, and no-slip conditions are enforced (no tangential velocity) on either side of the stent walls, that is,
Schematic sketch for the general setup of reduced models. Different parts of the urinary tract are color coded. (a) Unstented ureter with travelling waves, and the geometry of the reduced ureter model (Lykoudis & Roos, 1970), where c is the wave speed of the peristaltic wave, b is the radius of the occluded ureter, h is the local radius of the expanded ureter. (b) Stented ureter with prescribed renal pelvis and bladder pressures (Pk and Pb, respectively) as BCs (Cummings et al., 2004; Siggers et al., 2009). The stent is modeled with permeable walls to incorporate the effect of side holes. Encrustations are also included by the local variation of stent geometry
While Roos and Lykoudis (1971) and Lykoudis and Roos (1970) considered the pressure distribution within the ureter due to prescribed peristaltic waves of the ureter wall, their model neglected the bladder and kidney. As a result, a major limitation of these models is that they cannot be used to describe clinical conditions such as reflux. Additionally, material properties of the stent, ureter walls, and so on are overlooked. This was remedied by Cummings et al. (2004), who proposed the subsequent model to study reflux within stented ureters. The setup of the model is shown in Figure 2(b). In this case, the fluid domain consists of the fluid inside the stent (intraluminal), and the fluid between the stent and the ureter wall (extraluminal). One of the advantages of this model is the inclusion of side holes by assuming constant permeability λ of the stent wall. Scenarios with different number of side holes on the stent can be modeled by varying the permeability. The BCs state that the inner and outer radial velocities across the stent wall are equal, and no-slip conditions are enforced (no tangential velocity) on either side of the stent walls, that is,
wi=we=0,ui=λpe−pi=ue,atr=a,(5)
where the subscript i and e denote intraluminal and extraluminal flow, respectively, and a is the radius of the stent. Note that, pi and pe are reduced pressures, where the effect of gravity and ambient body pressure are removed (Cummings et al., 2004; Siggers et al., 2009). Furthermore, to model the compliant ureter, Cummings et al. (2004) introduced a stiffness function k(z), which quantifies how difficult it is to stretch the ureter radially. The dependence on z allows variations in the local stiffness values to model physiological conditions such as obstruction, where the local stiffness is large. The ureter wall is then modeled using a linear elastic model, such thatkzbz,t−baz=pi,forpi>0atr=b,(6)
where b(z, t) is the internal radius of the ureter as a function of axial location z and time t, and ba(z) is the radius of the ureter at ambient state (note, however, this is a linear approximation of the nonlinear wall). Based on the previous study of Knudsen et al. (1994), the stiffness can be estimated as k = 41 cm H2O/mm2.The axial BCs are given by the reduced renal pelvis pressure Pk and the bladder pressure Pb, which are nondimensionalized to remove the ambient body pressure (i.e., IAP) and the effect of gravity. Having determined the flow field, the reflux volume (i.e., flow volume of VUR) can be evaluated by integrating the resulting velocity field over the modeled domain within the ureter.
Following this, Waters et al. (2008) improved their previous model (Cummings et al., 2004) by including the nonlinear elastic properties of the ureter wall. They performed a systematic investigation of the correlation between the pressure pulses in the bladder and the resulting VUR volume in the ureter. In this model, the ureter wall is modeled as elastic membrane with natural (unstretched) cross-sectional area A that expands only in the radial direction (neglecting axial stretch), and the tension is assumed to be a nonlinear function (Fung, 1967) of the radial stretch f(λ) = k(eα(λ − 1) − 1), where λ is the ratio between the strained and unstrained ureter diameter, k is the stiffness of the wall, and α is a positive constant describing how rapidly the membrane tension varies with ureter radius (α = 1 is usually accepted). As such, f(1) = 0 denotes zero stress in the relaxed state. The wall inertia is also neglected since the time scale over which the ureter wall achieves equilibrium is much smaller compared to that of the flow. This work also included the renal pelvis as an elastic bag of constant bulk stiffness kr and pressure Pr(t), a function of time t. The pressures at the two ends of the ureter are then taken as those in the renal pelvis and bladder, respectively. The renal pelvis pressure is defined as the sum of equilibrium pressure plus the pressure caused by the volume expansion, that is, Pr = Pr,stat + krΔV, where kr is the bulk stiffness. The governing equations, after nondimensionalization, are reduced to two equations∂A∂t+∂Q∂z=0,(7)
∂2Ps∂z2=dPs−Pu,(8)
where A is the ureter cross-sectional area, Q is the total urine flux within the ureter, Ps is the pressure within the stent, and Pu is the pressure in the extraluminal space (Siggers et al., 2009). The pressure values, Ps and Pu, are set to zero initially, when the fluid is stationary and the ureter cross section area is equal to A. The rise and subsequent fall back of bladder pressure due to voiding (or spasms) is then modeled dynamically as Pb = Pb,max ∼ sin2(πt/T), where Pb,max is the maximum bladder pressure, and T is the duration of bladder activity. Consequently, the BCs are given asPs=Pu,∂Pu/∂t=−kkQ,atz=0,(9)
Ps=Pu=Pbt=sin2πt,0≤t≤T,Ps=Pu=Pbt=0,t>T,atz=L.(10)
With this model, different cases of the pressure wave pulses (extreme values and pulse duration) can be examined in relation to the volume of VUR. Their results demonstrated a strong positive correlation between the VUR volume and pulse duration and increasing peak bladder pressure. The authors argue that the VUR exacerbates stent encrustation by bringing the bladder urine (which has a higher concentration of salt) and bacteria back to the ureter and renal pelvis.Siggers et al. (2009) extended the model of Cummings et al. (2004) to incorporate urine production by the kidney (with a prescribed flux), and axial variations of the stent wall thickness due to encrustations (local variations of stent radius, as shown in Figure 2(b)), while other properties of the ureter wall, stent and BCs remained the same. Two types of bladder pressure pulses were prescribed to model bladder spasms and bladder voiding with triangular (spasm) and trapezoid (voiding) pressure waves, respectively. Their results confirm that the total reflux is proportional to the pressure elevation inside the bladder, and that the functionality of the UVJ is important in preventing reflux. This model would allow investigations of VUR and bladder physiology in a quantitative manner, which is clinically relevant considering the paucity of VUR data.
In contrast to the axisymmetric models discussed above, Griffiths and colleagues studied the pressure flow within collapsible tubes of finite length (Griffiths, 1985, 1987, 1989; Griffiths et al., 1987). This model assumes that the tube is uniform in shape and the axial rate of change of s remains relatively small. The fluid pressure is related to the wall mechanics via the tube lawp=ppass+pacts,z−ct,(11)
where ppas is the passive contribution that depends only on the wall separa
Comments (0)