
Remember me


The two most common causes of decreased vision in India are cataract and uncorrected refractive errors.[123456] Most studies have reported on one of three indices of vision: best-corrected visual acuity (BCVA), visual acuity (VA) at a healthcare facility, or a VA record in a community as part of an epidemiological survey.[789] In these settings, it can be assumed that those with distance glasses will wear the glasses for their appointment or for the screening. However, it is the habitual visual acuity (HVA), the vision they have in ‘day to day‘ life, which determines their true visual function. There are many people who may have a refractive correction and so their BCVA may be normal, however, if they do not wear their glasses regularly their “real-life” vision is not the same as their BCVA.
Many people do not wear their prescribed glasses regularly, and use them selectively, for activities such as driving, watching a movie or if they feel they need to wear glasses. In this cohort, the HVA determines their visual behavior as they are not wearing their glasses for most of their daily activities. HVA is difficult to ascertain in a hospital or epidemiological study setting. It is accurately ascertained when VA is checked unannounced and the person is seen in their natural environment; in the ‘real world‘.
Previous studies in hospital and community settings have documented various demographic factors associated with an increased risk of visual disability due to refractive errors which include low income, female sex, old age, lack of awareness, lack of felt need, economic reasons and personal barriers.[101112131415] Lack of felt need and lack of awareness for glasses are potentially the most important causes for reduced HVA. To address these issues, it is important to first ascertain the habitual vision of a population and factors associated with poor HVA. While there have been a large number of government initiatives to tackle blindness from cataract,[1617] visual disability secondary to refractive errors remains an area where more work is needed. What is not known is the proportion of those with a refractive error who wear their glasses regularly.
There have been no studies to evaluate habitual vision in the urban population of Western India and to evaluate factors associated with poor habitual vision in any Tier 1 city (Metropolitian city) of India. Mumbai, the financial capital of India has a population of over 20 million. The heterogeneous population varies in economic and educational backgrounds, and are of various ethnic backgrounds, coming from several smaller cities, towns, and villages across India. Lack of awareness and lack of eye care facilities may not be as significant in an urban population as it is in rural India. Therefore, data from rural India cannot be extrapolated to urban populations. This study prospectively evaluated the HVA in a large cohort comprising of people in Mumbai. To the best of our knowledge, this is the largest study to evaluate HVA in Western India, specifically studying an urban population in India‘s largest metropolitan city, Mumbai.
MethodsSince 2016 there is a large on-going screening project in Mumbai providing free screening for diabetes, hypertension and common blinding eye conditions using a non-mydriatic fundus photo which is reviewed remotely by trained ophthalmologists. The current cohort is taken from one of the screening events in September 2018 that was conducted over 10 days during a festival in Mumbai. About 50,000-60,000 people of various ages, educational and socio-economic backgrounds visit this location making it an ideal location to assess a heterogeneous cohort that may be considered to be representative of a population of a large urban city in Western India.
The study conformed to the tenets of the Declaration of Helsinki, and an informed, written consent was obtained from each of the study participants. Only those subjects who volunteered for the screening program, and agreed to participate in the questionnaire-based study were included in the evaluation.
SurveyValidated questionnaire surveys were modified using community-based focus discussions. The survey was designed in English and translated to Hindi and Marathi (backward-forward translation); the two most common languages used in Mumbai. Trained professional survey personnel administered the questionnaire survey (Leadtech Private Limited, New Delhi, India).
The first part of the survey was designed to collect basic demographic data like age (20–40, 40-60 and >60), sex (male, female), educational status (<10th standard, graduate, post-graduate), residence (Mumbai, other city or village), income (Rs 50000/year, 50,000–2,00,000/year and >2,00,000/year), etc. The second part of the survey collected the participants results from the screening tests; blood pressure, random blood sugar, HVA of the right and left eyes. See Annexure 1 for the survey Questionnaire form.
HVA assessmentTrained opticians measured VA using standard Snellen charts at 6 m distance. English letter charts, Hindi letter charts (using Devanagari script) and ‘E‘ charts were used.
HVA was measured as the vision the participant had when they entered the screening event. If they were wearing distance glasses HVA was assessed with glasses. If, however, they entered the event without glasses but had glasses in their bag and said they did not routinely wear glasses, HVA was assessed unaided. Those who had only reading glasses were assessed unaided. We believe this is the most accurate representation of their “real-life” vision, the true HVA.
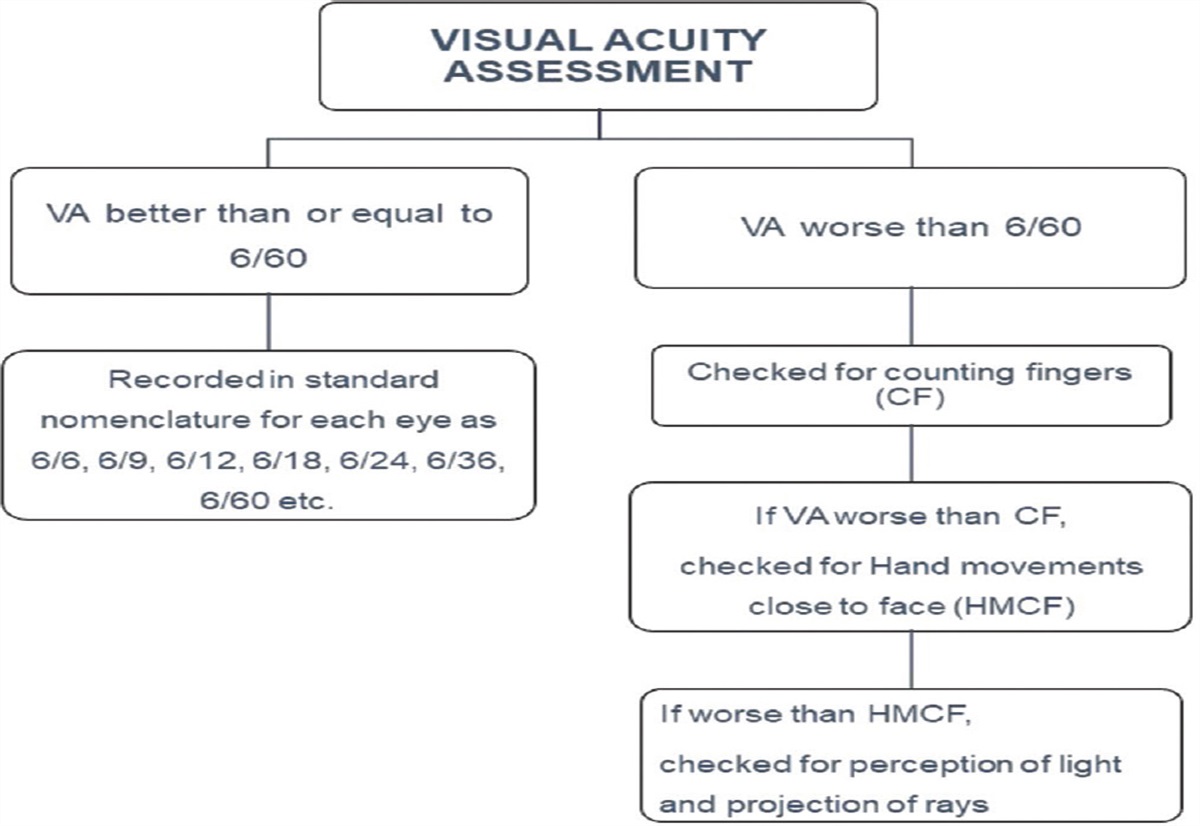
HVA of each eye was recorded using the standard nomenclature. Participants with HVA less than 6/60 were assessed for counting fingers at 1 meter, hand movements close to face, perception of light and no perception of light [Fig. 1].
 Figure 1:
 Flowchart of Habitual Visual Acuity (HVA) assessment
For this audit, we analyzed the HVA in each eye and use the demographic data from the survey. Factors associated with poor habitual vision, defined as vision less than 6/6 in both eyes, less than 6/6 in one eye, vision less than 6/12 in both eyes, vision less than 6/12 in one eye and vision less than 6/18 in both eyes (WHO definition for moderate visual disability) were studied.
Statistical analysisStatistical analysis was performed using the Statistical Package for the Social Sciences II software program, version 23.0 (SSPS, Chicago, Illinois). Data were presented in frequency (%) and mean with standard deviation. Association of categorical variable with demographic variable was assessed by chi-square test/Fischer exact test. The normality of the data was tested using the Kolmogorov–Smirnov test. The chi-square test was used for comparison of dichotomous variables which were represented as percentages. The correlation between the variables was tested using the Pearson test and two-tailed Spearman‘s rank correlation. A value of P < 0.05 was taken to be statistically significant.
ResultsThere were 31,982 participants who underwent the screening tests. Of these, 6396 subjects agreed to participate in the questionnaire-based survey. A total of 96 participants (1.5%) were excluded from further analysis due to incomplete data or duplication in the survey.
Of the 6300 eligible participants, 1660 were females (26.3%) with 327 (5.2%) above 60 years, 2187 (34.7%) between 41–60 years and 3786 (60.1%) between 18–40 years. There were 3294 (52.3%) participants who had not completed education till the 10th standard, 2434 (38.6%) were graduates and 572 (9.1%) had postgraduate degrees. Majority of the participants (6084; 96.6%) were residing within Mumbai and 216 (3.4%) were from adjacent small towns and villages.
HVA was 6/6 both eyes in 4136 individuals (65.6%), at least 6/12 both eyes in 5691 (90.3%) and at least 6/18 both eyes in 5974 (94.8%) individuals. There were 4763 (75.6%) individuals who had HVA of at least 6/6 one eye, 5966 (94.7%) individuals had HVA of at least 6/12 in one eye and 6152 (97.7%) individuals had HVA of at least 6/18 in one eye.
Only 11 patients (0.17%) had VA worse than 6/60 in either eye with only 3 patients (0.003%) having bilateral HVA <6/60.
Correlation of visual acuity with various parametersHVA <6/6: Low HVA was found to be associated with older age with an increasing trend of lower HVA with an increase in the age group. In people >60 years, only 34.3% had HVA both eyes 6/6 compared to 74.5% in 20–40 years age group (P < 0.001) and VA of 6/6 in at least one eye was found in 48.9% versus 83.8% in >60 years and 20–40 years age group respectively (P < 0.001). There were more males with good HVA compared to females (69.1% versus 55.9% for both eyes 6/6 (P < 0.001) and 78.9% versus 66.3% for VA 6/6 in at least one eye) (P < 0.001).
There was also a significant association of lower HVA with education status and annual income (about 60% had HVA both eyes 6/6 with education status <10th Std and annual income <50,000 versus 71% with education status > graduate and annual income >50,000) (P < 0.001 for each). Tables 1 and 2 show the percentage of VA <6/6 in both eyes and at least one eye respectively in different groups and the factors associated.
 Table 1:
 Correlation of visual acuity both eyes <6/6 with various parameters
 Table 2:
 Correlation of visual acuity <6/6 in at least one eye with various parameters
HVA <6/12: HVA <6/12 both eyes was seen in 609 (9.7%) individuals and 334 (5.3%) individuals had HVA < 6/12 in one eye only.
The prevalence of HVA <6/12 both eyes was 28.1% in >60 years, 15% in 40–60 years and 5% for 20–40 years age group (P < 0.001). 8.3% males versus 13.5% females had HVA < 6/12 both eyes (P < 0.001). With lower education status (<10th Std.) and lower annual income (<50000), the prevalence of HVA <6/12 both eyes was 12.8% and 12.9%, respectively (P < 0.001 for each).
The prevalence of HVA <6/12 in one eye was also found to be associated with age (14.7% in >60 years and 2.6% in 20–40 years age groups), female sex (2 times, 8.5% versus 4.2% in males), lower education status (4 times, 7.2% in <10th Std versus 1.9% in postgraduates), lower annual income (2 times, 12.9% in <50000 versus 6.2% in >2 lakhs) (P < 0.001 for all the parameters). The residence was not found to be a determining factor (p 0.27). Tables 3 and 4 show the percentage of VA <6/12 in both eyes and at least one eye respectively in different groups and the factors associated.
 Table 3:
 Correlation of visual acuity worse than 6/12 both eyes with various parameters
 Table 4:
 Correlation of visual acuity 6/12 in at least one eye with various parameters
HVA < 6/18: HVA worse than 6/18 in both eyes was seen in 326 (5.2%) individuals. Age, female sex, education status, annual income as well as residence were found as significant factors for moderate visual disability (P < 0.05). Table 5 shows the percentage of VA <6/18 in both eyes in different groups and the factors associated.
 Table 5:
 Correlation of visual acuity 6/18 in both eyes with various parameters
Fig. 2 shows a line graph to depict the declining HVA with old age in the study population.
 Figure 2:
 A line graph showing the relation of visual acuity with age in the study population
As there were very few individuals with severe visual impairment (VA <6/60), association with baseline factors were not evaluated.
DiscussionVisual acuity has an impact on the quality of life, performance at work, intellectual development and reduced vision has been shown to be associated with mood disorders, social isolation and reduced quality of life.[18]
This study found that the prevalence of HVA <6/6 in both eyes in 34.3% and <6/12 both eyes in 9.7% of participants attending a screening event in urban Western India. Older age, female sex, lower educational qualification and low income are found as risk factors for lower HVA. These risk factors have also been identified in other studies however this is the first study to demonstrate that even in a large metropolitan city the same factors are associated with low HVA. More than one-third of our study population had HVA less than normal. The proportion of participants with poor HVA increased with age, with more than 66% of those aged >60 years having HVA of less than 6/6. Global data on visual impairment by the Bulletin of the World Health Organization (WHO) also mentions a high prevalence of lower vision in older age >50 years.[12] Various studies have reported poor eye health-seeking behavior with old age related to decreased mobility and increased dependence on others to access eye care facilities.[131415] Education, sex and income are other factors consistently related to worse VA.[71019] In our study lower education and lower income groups were associated with poor HVA.
Many studies from India have identified that women are at a higher risk for poor VA. There are many possible reasons for this, predominant amongst which are financial and social dependence on male members of the family to access eye care. Another reason is the patriarchal mindset and the perceived ‘lack of need‘ for glasses amongst women.[15] It is to be noted that even in urban India, HVA was worse amongst women.
There are several charitable, and government hospitals providing eye examinations and glasses for free or at subsidized rates. Therefore, access and affordability of eye care may not be as significant reasons in our study, as they are in rural India where facilities are limited and eye care may not be accessible to all. Despite all the awareness that a large city subliminally provides, education and income were found to be significant factors for poor HVA. This highlights the need for awareness campaigns in the urban population as well.
A population-based study from Tirunelveli district of South India has reported presenting and best-corrected VA ≥6/18 in 59.4% and 75.7% respectively.[4] In our study more than almost 95% of the participants had HVA better than 6/18. Both studies identified low education and income to be significantly associated with poor VA. Another study from rural Rajasthan in older adults (>50 years) reported presenting VA better than 6/18 in 47.6% cases which is also lower than in this study.[13] This discrepancy of low VA between the urban and rural studies may be explained by increased awareness and accessibility to affordable eye care in urban India, which is lacking in rural areas.
In our study more than a third of the cohort had less than 6/6 vision in at least one eye. More than 5% were moderately visually disabled as per the WHO classification. Our study probably underestimates the true number of people with poor HVA because our cohort was derived from a screening program where participation was voluntary, and at a location not necessarily close to their homes. It is therefore possible that those with poor HVA, poor mobility and those with limited access to transport due to vision issues may not have participated in the screening, leading to an underestimation of people with poor vision.
Only 5% of our cohort was above 60 years of age. This age group is at increased risk of low VA due to uncorrected refractive errors, cataract and other ocular morbidities. The cohort, therefore, does not accurately reflect the true demographic of the country where more than 8.5% of the population is above 60 years.[2021] Even though the screening was conducted at a prominent and accessible location, a vast majority of the participants were younger individuals. The elderly may find it more difficult to participate in the screening due to dependence on others for transport, limited mobility, other health issues precluding their participation in a screening event, lack of awareness about the screening event and possible perception that the screening would be time consuming, cumbersome and tiring.
Even in a metropolitan city like Mumbai, at least a third of the population was found to have HVA of less than 6/6 in both eyes and at least 5% had moderate visual disability. The true number of people with visual disability is probably larger and can only be assessed by a systematic epidemiological study designed to measure true HVA and not BCVA. Simple measures like creating awareness about refractive errors and making refractive correction more accessible may help improve HVA in both in the rural and urban community.
A strength of this audit is that HVA was measured in the community and the vision is the ‘real life‘ vision as the visit to the screening was unplanned and vision was measured ‘as is‘, which means if they said they had glasses but were not wearing them or had left the glasses in the car, the HVA was the vision as they were when they arrived at the screening; unaided.
Another strength of the study is the fact that the cohort was heterogeneous, spontaneously selected, with wide variation in education and economic backgrounds. Given that a trained optometrist measured HVA in a standardized method, and the survey was administered electronically by trained professionals, the veracity of data is unquestionable. It is of note that less than 2% of the participants who completed the survey were excluded from the final analysis.
An obvious limitation of the study is that the Best Corrected VA was not measured, and neither were the causes of lower VA ascertained. Another limitation is that the factors responsible for the lack of felt need were not studied. These lacunae may be addressed in subsequent studies.
ConclusionOur study of a large cohort in a tier 1 city is the first study to demonstrate that the factors responsible for reduced habitual vision remain the same in both rural and urban India which are old age, female gender, poor education and lower income status, but the prevalence of poor HVA is higher in rural India.
Financial support and sponsorshipNil.
Conflicts of interestThere are no conflicts of interest.
Annexure 1: Survey Questionnaire FormSurvey – Eyebetes
Demographic details:
Age: 20-40; 40-60; >60
Sex: Male; Female
Education: <10th standard; graduate; post-graduate
Residence: Urban; Rural
Religion: Muslim; Hindu; Christian; Sikh; Other
Income: <50,000/yr; 50000-200000 > 200000
Do you drive: No; Car; Motor-cycle; Bus; Truck
Test results: Fill twice to ensure accuracy (if not same error should show)
BP: _ _ _/_ _ BP: _ _ _/_ _
Blood sugar: _ _ _ Blood sugar: _ _ _
Vision: RE 6/_ _ ; LE 6/_ _ (forced choice 6/9/12/18/24/36/60/CF/< CF)
1. Malhotra S, Vashist P, Gupta N, Kalaivani M, Rath R, Gupta SK. Prevalence and causes of visual impairment among adults aged 15-49 years in a rural area of north India - A population-based study Indian J Ophthalmol. 2018;66:951–6 2. Thulasiraj RD, Nirmalan PK, Ramakrishnan R, Krishandas R, Manimekalai TK, Baburajan NP, et al Blindness and vision impairment in a Rural South Indian population: The Aravind comprehensive eye survey Ophthalmology. 2003;110:1491–8 3. Thulasiraj RD, Rahamathulla R, Saraswati A, Selvaraj S, Ellwein LB. The Sivaganga eye survey: I, Blindness and cataract surgery Ophthal Epidemiol. 2002;9:299–312 4. Nirmalan PK, Thulasiraj RD, Maneksha V, Rahmathullah R, Ramakrishnan R, Padmavathi A, et al A population based eye survey of older adults in Tirunelveli district of south India: Blindness, cataract surgery and visual outcomes Br J Ophthalmol. 2002;86:505–12 5. Neena J, Rachel J, Praveen V, Murthy GVSRapid Assessment of Avoidable Blindness India Study Group. . Rapid assessment of avoidable blindness in India PLoS One. 2008;3:e2867 6. Murthy GV, Gupta SK, Bachani D, Jose R, John N. Current estimates of blindness in India Br J Ophthalmol. 2005;89:257–60 7. Pisudde PM, Taywade ML, Sushma K, Mehendale AM, Shukla AK. An epidemiological study of common ocular morbidities among elderly population in the Wardha, District, Maharashtra, India Epidemiology. 2015;S2:002 doi: 10.4172/2161-1165.S2-002 8. Nangia V, Jonas JB, Sinha A, Gupta R, Agarwal S. Visual acuity and associated factors. The Central India Eye and Medical Study PLoS One. 2011;6:e22756 9. Herse P, Gothwal VK. Survey of visual impairment in an Indian tertiary eye hospital Indian J Ophthalmol. 1997;45:189–93 10. Marmamula S, Keeffe JE, Raman U, Rao GN. Population-based cross-sectional study of barriers to utilisation of refraction services in South India: Rapid assessment of refractive errors (RARE) study BMJ Open. 2011;1:e000172 11. Senjam SS, Vashist P, Gupta N, Malhotra S, Misra V, Bhardwaj A, et al Prevalence of visual impairment due to uncorrected refractive error: Results from Delhi-Rapid assessment of visual impairment study Indian J Ophthalmol. 2016;64:387–90 12. Resnikoff S, Pascolini D, Etya‘ale D, Kocur I, Pararajasegaram R, Pokharel GP, et al Global data on visual impairment in the year 2002 Bull World Health Organ. 2004;82:844–51 13. Murthy GV, Gupta S, Ellwein LB, Munoz SR, Bachani D, Dada VK. A population-based eye survey of older adults in a rural district of Rajasthan: I. Central vision impairment, blindness, and cataract surgery Ophthalmology. 2001;108:679–85 14. Dandona L, Dandona R, Srinivas M, Giridhar P, Vilas K, Prasad MN, et al Blindness in the Indian state of Andhra Pradesh Invest Ophthalmol Vis Sci. 2001;42:908–16 15. Barman D, Mishra M. How does eye care seeking behavior change with increasing age and visual impairment? Intersectional analysis of older adults in the Indian Sunderbans BMC Geriatr. 2020;20:71 16. Murthy G, Gupta SK, John N, Vashist P. Current status of cataract blindness and Vision 2020: The right to sight initiative in India Indian J Ophthalmol. 2008;56:489–94 17. Lahane TP. Tackling the cataract backlog - An initiative by the Maharashtra State, India Indian J Ophthalmol. 2018;66:1391–3 18. Khorrami-Nejad M, Sarabandi A, Akbari MR, Askarizadeh F. The impact of visual impairment on quality of life Med Hypothesis Discov Innov Ophthalmol. 2016;5:96–103 19. Mactaggart I, Polack S, Murthy G, Kuper H. A population-based survey of visual impairment and its correlates in Mahabubnagar district, Telangana State, India Ophthalmic Epidemiol. 2018;25:238–45 20. Rajan SI, Sarma PS, Mishra US. Demography of Indian aging, 2001-2051 J Aging Soc Policy. 2003;15:11–30 21. Loganathan S, Iyengar V, Chowdappa SV, Varghese M. Population trends and public awareness of healthy and pathological ageing in India: A brief overview Asian J Psychiatr. 2017;29:49–53
Comments (0)