
Remember me

Globally, 11 million sepsis-related deaths per year account for 20% of all deaths.1 Overwhelming post-splenectomy infection (OPSI) is fulminant sepsis that develops in post-splenectomy patients, who have a high mortality rate of 50%– 70%.2, 3 Streptococcus pneumoniae is the most common causative organism of OPSI (57%–87%),2, 4 followed by Haemophilus influenzae, Neisseria meningitidis, and Capnocytophaga canimorsus.5, 6 The capsular structure of these bacteria makes them highly resistant to opsonization. Therefore, IgM produced by memory immunoglobulin M cells in the spleen are required to eliminate these bacteria.7 Conditions mimicking OPSI have been reported in patients with small spleen volumes.8, 9 Such conditions suggest that a small spleen volume might have impaired immune function similar to that of post-splenectomy patients; however, no study has investigated the relationship between spleen volume and patient prognosis during bacteremic infections. Fulminant infections like OPSI start with a mild fever and malaise and rapidly progress to septic shock.10 Therefore, it can be difficult to estimate the severity of disease from the symptoms at the time of admission.
This study aimed to determine whether spleen volume measured using computed tomography (CT) could estimate splenic function (immunocompetence) and predict the severity of illness in patients with bacteremia caused by encapsulated organisms.
With these results, appropriate treatment can be initiated early in the course of the disease to improve the patient’s prognosis. This study was a retrospective examination of the relationship between spleen volume and patient prognosis among patients with bacteremia caused by encapsulated organisms.
METHODS Study design, setting, and populationThis was a single-center, retrospective observational study undertaken at Tokyo Medical University Hospital, an educational and research hospital with approximately 1,000 beds that serves part of a health district with 1,300,000 inhabitants. The study protocol was approved by the ethical committee at Tokyo Medical University. The inclusion criteria were: detection of S. pneumoniae, H. influenzae, N. meningitidis, and C. canimorsus (bacteria that are common OPSI pathogens) in blood cultures carried out between January 2017 and July 2020. If even one set was positive, it was included in the study, because the target bacteria are not likely to cause contamination. We excluded patients who were younger than 18 years, had already been diagnosed with decreased splenic function, for instance, following splenectomy, were missing information on height and body weight, or had been transferred to another hospital on the same day their blood cultures were collected.
MeasurementsData on patient characteristics (age, gender, height, body weight, the Sequential Organ Failure Assessment [SOFA] score, Acute Physiology and Chronic Health Evaluation [APACHE] II score, clinical departments, medical history, causative microorganisms, diagnosis, presence of sepsis, need for mechanical ventilation and renal replacement therapy, duration of hospital stay, and intensive care unit admission) were collected. Site of infection was determined on the basis of medical record review and clinical judgment.
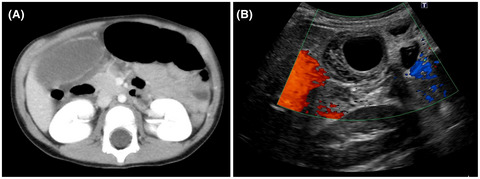
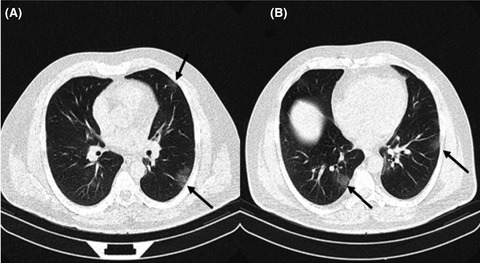
The diagnostic criteria for sepsis followed the sepsis-3 guidelines.11 Spleen volume (SV) was calculated from CT scans taken before or after blood cultures were collected. Computed tomography scans were obtained using the Aquilion 64-slice helical CT system (TSX-101A; Toshiba). Spleen volume was calculated using the volume analyzer SYNAPSE VINCENT (Fujifilm Medical). Specifically, SV was calculated using the cystic kidney analysis application provided in this software. Spleen volume is automatically measured by specifying two different slices of the long axis of the spleen and making sure there is no excess or deficiency of volume, manually correcting for the edge of the spleen (Fig. 1). This measurement was carried out by one emergency physician.

Measurement of spleen volume. The volume of the spleen can be automatically measured by specifying two different slices of the long axis of the spleen (as in the green area).
Outcome variables and predictive variablesSpleen volume decreases with age and directly correlates with height and body weight.12-14 However, there is no standardized formula to compute splenic size in published reports. Therefore, we defined and computed spleen volume index (SVI) as: SVI-H, spleen volume cm3/height (m); SVI-BW, spleen volume cm3/body weight (kg); and SVI-A, spleen volume cm3 × age/100.
Eligible patients were categorized into two groups: those who survived (survive group) and those who died at the hospital (nonsurvive group). The primary outcomes of this study were to investigate the association between in-hospital death and SV, SVI-H, SVI-BW, and SVI-A.
Statistical analysisWe analyzed statistical data using SPSS software (version 27; IBM). The t-test was used to compare parametric continuous variables between the two groups, and the Mann–Whitney U-test was used to compare nonparametric continuous variables. The χ2-test was used to compare categorical variables. P-values less than 0.05 were considered statistically significant. Receiver operating characteristic (ROC) curves for SVs and SVIs and area under the curves (AUCs) were calculated. Cut-offs were defined from the ROC curves, and the sensitivity, specificity, positive predictive value (PPV), and negative predictive value (NPV) at each cut-off were calculated.
RESULTS Patient selectionFigure 2 shows the flow diagram of the study. During the study period, 31 patients developed target organisms in their blood cultures. Of these, 11 patients were excluded because they did not meet the inclusion criteria. There were five pediatric patients, one post-splenectomy patient, two patients transferred on the same day, and three patients with missing data. Therefore, 20 patients were considered eligible and participated in this study. Computed tomography scans were carried out in all cases on the same day or the day before blood cultures were taken.

Study flowchart showing the recruitment of 20 patients with bacteremia assigned to the survive group (n = 17) or nonsurvive group (n = 3).
Patient characteristics and splenic sizeThe demographic characteristics of all participants are listed in Table 1. There were 17 (85%) patients in the survive group and three (15%) patients in the nonsurvive group. The nonsurvive group was older than the survive group, but this difference was not statistically significant. In the nonsurvive group, H. influenzae was detected most frequently (66.7%), whereas in the survive group, S. pneumoniae was detected most frequently (76.5%). In both groups, pneumonia was the most common site of infection. The median (interquartile range [IQR]) SOFA (3 [1–6] vs. 12 [10.5–12.5]) and APACHE II scores (13 [13-16] vs. 26 [25.5-26.5] median [IQR]) of the survive group were significantly smaller than that of the nonsurvive group (p = 0.012).
Table 1. Baseline demographic characteristics of study patients with bacteremia Survived n = 17 Died n = 3 p-value Age (years) 67 ± 14.43 90 ± 25.57 0.774 Gender, male/female, n (%) 12 / 5 (70.58) 2 / 1 (66.67) 0.681 Height(m) 1.64 ± 0.11 1.50 ± 0.11 0.545 Actual body weight (kg) 62 ± 15.78 46.6 ± 12.27 0.307 Setting, n (%) Emergency department 12 (70.58) 2 (66.67) 0.681 Primary care 2 (11.76) 1 (33.33) 0.404 In admission 3 (17.65) 0 0.596 History, n (%) Hypertension 4 (23.53) 1 (33.33) 0.601 Diabetes mellitus 2 (11.76) 1 (33.33) 0.404 Malignant disease 7 (41.18) 1 (33.33) 0.656 Immunodeficiency 1 (5.89) 0 0.850 Microorganisms, n (%) Streptococcus pneumoniae 13 (76.47) 1 (33.33) 0.202 Haemophilus influenzae 3 (17.65) 2 (66.67) 0.140 Capnocytophaga sp. 1 (5.89) 0 0.850 Diagnosis, n (%) Pneumonia 9 (52.94) 3 (100) 0.193 Meningitis 2 (11.76) 0 0.716 Esophagitis 1 (5.89) 0 0.850 Subcutaneous infection 1 (5.89) 0 0.850 Osteomyelitis 1 (5.89) 0 0.850 Cholangitis 1 (5.89) 0 0.850 Unknown 2 (11.76) 0 0.716 SOFA scorea 3 (1–6) 12 (10.50–12.50) 0.012 APACHE II scorea 13 (13–16) 26 (25.50–26.50) 0.012 Sepsis, n (%) 12 (70.58) 3 (100) 0.399 Mechanical ventilation, n (%) 7 (41.18) 2 (66.67) 0.421 Renal replacement therapy, n (%) 0 (0.00) 1 (33.33) 0.150 Hospital stay (days)a 23 (18–49) 5 (3–5.50) 0.002 ICU admission, n (%) 7 (41.18) 2 (66.66) 0.421 Data are reported as mean ± standard deviation or number (percentage). The t-test was used to compare continuous variables between two groups, the χ2-test was used to compare categorical variables, and the Mann–Whitney U-test was used to compare Sequential Organ Failure Assessment (SOFA) and Acute Physiology, and Chronic Health Evaluation (APACHE) II scores, and hospital stay. aReported as median (interquartile range).Table 2 shows participants’ clinical outcomes. The median (IQR) values for SV (76.75 [55.19–144.53] vs. 23.09 [15.23–31.97], p = 0.004) and all SVIs (SVI-H; 52.56 [31.41–91.06] vs. 15.39 [9.84–21.49], p = 0.004; SVI-BW, 1.76 [0.89–3.13] vs. 0.5 [0.31–0.93], p = 0.04; and SVI-A, 61.74 [39.4–93.49] vs. 20.78 [11.83–30], p = 0.028) in the survive and groups, respectively, were statistically significantly smaller in the nonsurvive group.
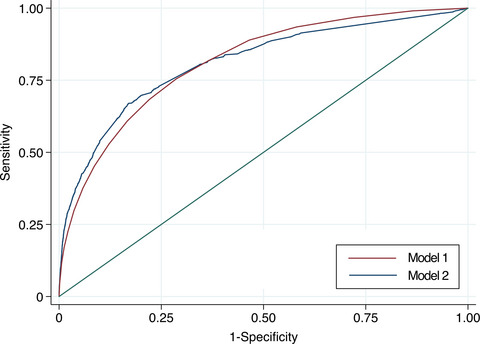
Table 2. Measurement of spleen volume (SV) and spleen volume indices (SVIs) in patients with bacteremia Survive n = 17 Nonsurvive n = 3 P-value SV, cm3 76.75 (55.19–144.53) 23.09 (15.23–31.97) 0.004 SVI-H: SV/height 52.56 (34.41–91.06) 15.39 (9.84–21.49) 0.004 SVI-BW: SV/actual body weight 1.76 (0.89–3.13) 0.5 (0.31–0.93) 0.040 SVI-A: SV × age/100 61.74 (39.40–93.49) 20.78 (11.83–30) 0.028 Data are reported as median (interquartile range). The Mann–Whitney U test was used to compare SV and SVIs. Measures of validityWe drew ROC curves for SV and each SVI (Fig. 3). The calculated AUCs for each were: SV, 0.98 (95% confidence interval [CI], 0.923–1.0); SVI-H, 0.98 (95% CI, 0.923–1.0); SVI-BW, 0.882 (95% CI, 0.70–1.00); and SVI-A, 0.902 (95% CI, 0.747–1.0).

Receiver operating characteristic (ROC) curves for spleen volume (SV) and spleen volume index (SVI) in patients with bacteremia. A, ROC curve describing the ability of the SV to predict survival discharge. B, ROC curve describing the ability of SVI-H (spleen volume cm3/height m) to predict survival discharge. C, ROC curve describing the ability of SVI-BW (spleen volume cm3/body weight kg) to predict survival discharge. D, ROC curve describing the ability of SVI-A (spleen volume cm3 × age/100) to predict survival discharge. AUC, area under the ROC curve.
The calculated cut-off values, sensitivity, specificity, PPV, and NPV for each of the four splenic measures are shown in Table 3; there was a sensitivity of 94.1%, specificity of 66.7%, PPV of 94.1%, and NPV of 66.7%.
Table 3. Sensitivity, specificity, positive predictive value (PPV), and negative predictive value (NPV) for cut-off values of spleen volume (SV) and spleen volume indices (SVIs) in patients with bacteremia Cut-off Sensitivity (%) Specificity (%) PPV (%) NPV (%) SV (cm3) 33.560 94.12 66.7 94.12 66.7 SVI-H: SV/height 21.900 94.12 66.7 94.12 66.7 SVI-BW: SV/actual body weight 0.549 94.12 66.7 94.12 66.7 SVI-A: SV × age/100 25.800 94.12 66.7 94.12 66.7 DISCUSSIONWe evaluated the relationship between SV and patient prognosis in bacteremia caused by encapsulated organisms. We found that the SV of patients who survived was larger than that of patients who died. This suggests that SV measured using CT scans taken at the onset of infection with encapsulated organisms could predict a patient’s prognosis. There was no difference between the prognostic value of SV and the SV in conjunction with a patient’s age, height, and weight.
Bacteremia and sepsis are life-threatening conditions. Early detection, treatment, and monitoring of patients who are at risk of severe infections could improve patient prognosis. Although various research studies are ongoing, there is no established index to predict the prognosis of patients with severe infections. Both SOFA11 and APACHE II15 are useful prognostic factors for patients with life-threatening infections; this was also shown by the results of this study. However, sepsis caused by encapsulated organisms, such as OPSI, often begins with mild symptoms such as malaise and slight fever,10 and patients could come to the hospital early in the course of the disease, before an increase in the SOFA and APACHE II scores can be detected. Another limitation of these clinical scores is the absence of changes in vital signs in the elderly.16 Conversely, in Japan and other countries, CT scans are extremely easy to conduct. Therefore, SV could be used to identify patients who are likely to develop life-threatening infections before changes in the clinical score. A combination of SV and other reported predictors14, 15 will allow timely intervention to improve patient prognosis.
The spleen can be considered the largest lymph node in the body, which is involved in the removal of foreign substances and waste products from the blood. Thus, it plays an important role in the body’s immune response.17 Several cases of patients with small SV developing life-threatening infections similar to OPSI have been reported,8, 9 showing the relation between size of the spleen and spleen function. It has also been reported that patients with small SV after cerebral infarction and after bone marrow transplantation are more likely to develop infections.18, 19 This supports our hypothesis. Hata et al. documented autopsy findings of a death after severe sepsis, similar to OPSI, in a healthy adult.20 In this report, the pathology report indicated that in a highly atrophied spleen, macrophages in the marginal zone were reduced, leading to immune dysfunction. McCulloch et al. also reported that catecholaminergic stimulation decreases the number of B cells in the marginal zone,21 which predisposes a patient to infection. In the present study, the nonsurvive group had smaller SV than patients who survived, suggesting that the patients who died might have had immune dysfunction with a similar underlying mechanism.
To the best of our knowledge, this is the first study to examine the relationship between SV measured by CT scans and the prognosis of patients with encapsulated bacteremia. Studies investigating the association between SV and sepsis have reported that SV is associated with mortality22 and with severity of illness,23 as in the present study. However, these studies did not mention encapsulated bacteria. This is also the first study to examine the prognosis of infection after adjusting for SV, patient age, and height. The SV cut-off of 33.56 cm3 was strongly predictive of survival. The SVIs adjusted for height, actual weight, and age, which have been previously reported as associated with SV in healthy individuals, showed comparable predictive ability to SV. These results suggest that SV measured by CT scan can predict the prognosis of bacteremia with encapsulated organisms. Spleen volume indices, defined by SV and height, actual weight, and age, also predict the prognosis of bacteremia caused by encapsulated organisms. The measurement of SV by CT scans can be easily carried out in actual clinical practice even without the software used in this study.22, 23 If the SV is small on CT scan, the patient’s condition could become more severe. Clinicians can consider close monitoring and immediate treatment of such patients in the intensive care unit based on CT findings, even if the patient’s vital signs, blood test data, and APACHE II score do not concur with the CT findings. The fact that patients who survived in this study were seen in primary care implies that the findings of this study can be immediately applied to clinical practice.
This study has some limitations. First, this was a retrospective review of medical records done at a single center with a small number of patients. Therefore, findings might not be generalizable to other clinical settings. Second, there was an immense difference in the severity of disease in our patient groups and the treatment was not standardized. Accordingly, the difference in severity of illness and treatment between the two groups might have influenced the outcome. A future larger multicenter study will be needed. Finally, it was difficult to identify the causative bacteria in each infection as encapsulated bacteria at the first medical examination. This cannot be generalized to all clinical situations.
CONCLUSIONSIn conclusion, we found that the SV of patients with bacteremia caused by encapsulated organisms who survived was larger than that of patients who died. The prognosis of encapsulated bacteremia could be predicted by SV measured by CT scan. Spleen volume index defined by patient height, weight, age, and SV also predicted the prognosis of patients with encapsulated bacteremia. If the SV is small on CT scan, the patient’s status could become severe and intensive treatment may be considered. We suggest 33.56 cm3 as the cut-off. Prospective multicenter studies are needed.
ACKNOWLEDGMENTSThe authors would like to thank the patients for their cooperation in collecting valuable data in this study and the hospital for providing the imaging software and volume analyzer.
DISCLOSUREApproval of the research protocol: This study was approved by the Ethics Committee of Tokyo Medical University (IRB: TS2020-0310).
Informed consent: Written informed consent was waived because of the retrospective nature of the study.
Registry and registration no. of the study/trial: N/A.
Animal studies: N/A.
Conflict of interest: None.
Comments (0)