2.1 Model Structure
A Microsoft Excel-based BIM was developed in accordance with AMCP [32] and ISPOR best practices [33] over a 3-year time horizon to estimate the budget impact of adding IgPro20 PFS to a health plan formulary for the treatment of PID. As a BIM presents financial streams over time, it was not necessary to discount the costs [33].
2.2 Model Inputs
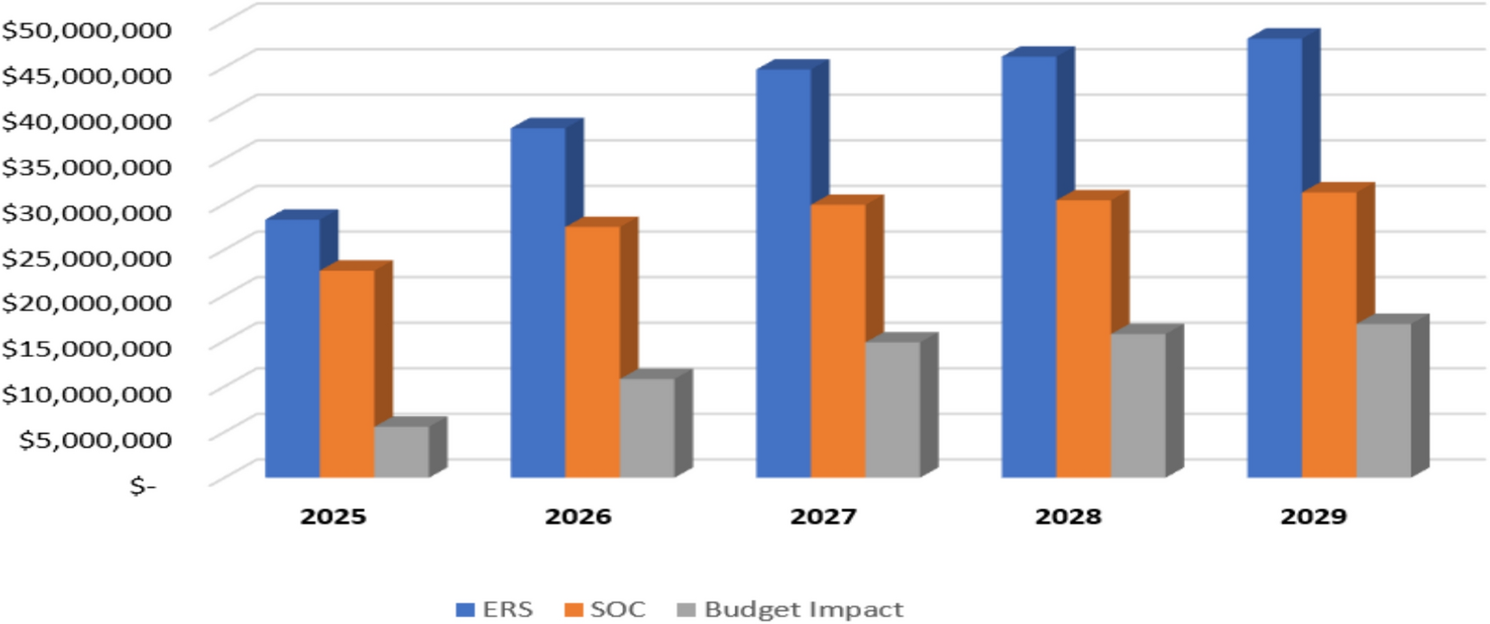
A hypothetical US health plan with 25 million patients was assumed. Prevalence of PID was assumed to be 1 case per 1200 individuals based on an epidemiologic analysis of diagnosed PID in US patients [4], resulting in a projected 20,825 patients with PID. Applying a rate of 88% of patients treated with immunoglobulin at any time [19] resulted in 18,326 treated patients.
The model included six IVIGs and seven SCIGs; full trade and generic names are found in Supplementary Table 1 (see electronic supplementary material [ESM]).
Model interventions were market shares of pump-administered IgPro20 (SCIG) and stratified by IgPro20 PFS and vial as alternative SCIG drug packaging methods. Market shares for each of the immunoglobulin products were based on internal 2023 immunoglobulin market share reports. Table 1 presents assumed IVIG market shares and non-IgPro20 SCIG shares (re-calculated by subtracting overall current IgPro20 share of 52% and re-expressing the rest as a proportion of non-IgPro20 SCIG use). Pharmacy costs included average sales price (ASP), wholesale acquisition cost (WAC), and average wholesale price (AWP) (using ASP pricing files [34] and IBM Micromedex [35]). Payment mix for immunoglobulin products was assumed to be 73% for ASP, 25% for AWP payments, and 2% for WAC pricing [36]; we also simulated implications of ASP-only pricing. Dosing for both SCIG and IVIG is weight-based, and a patient weight of 66.5 kg was assumed based on US averages accounting for age and gender in patients with PID [4, 37].
Table 1 Model comparator market shares and pricingModel input assumptions are listed in Table 2. A first set of model inputs describes distribution of IVIG site of care across one of four sites: hospital outpatient, office/other setting, patient home self-administration, or patient home assisted by a visiting nurse. The following percentages were assumed for setting of IVIG administration: hospital outpatient, 9%; office/other setting, 53%; patient home self-administration, 3%; and patient home administration by visiting nurse, 35% [19, 20].
A second set of model inputs provides two options for SCIG administration (patient home self-administration, 96%; nurse-assisted infusion at home, 2%) or within the office/other setting (2%) for SCIGs, apart from HyQvia. Patient home self-administration (64%) and office/other setting (36%) were the sites of care for HyQvia [19]. A third set of model inputs relates to SCIG self-infusion training. The magnitude of training and associated aggregate costs based on nurse time for self-administration of SCIG was expected to vary by SCIG drug packaging method. Recent evidence from a survey suggested, however, that training time was similar for vials and PFS training at a median of 2 h, presumably due to PFS training having occurred virtually during the height of the COVID-19 pandemic [38].
A fourth set of model inputs relates to medical (nondrug) costs per IVIG infusion. Infusion costs (exclusive of pharmacy costs) were derived from two studies comparing costs per infusion across home and hospital outpatient settings from a commercial perspective: nurse-administered home setting, US$389; office setting, US$1036; hospital outpatient setting, US$2884 [21, 39]. These studies were the only identified publications that spelled out US IG administration costs. However, a comparable estimate for nurse-administered home-setting IVIG administration is also available from the CMS Medicare IVIG home administration demonstration program, where the reimbursement amounts are very comparable to the base case of US$389 used in our model [40]. All costs in the analysis were inflated to 2023 US dollars using the consumer price index (CPI) [41].
A fifth set of model inputs provides details on immunoglobulin weight-based dosing. The dosing for IgPro20 was derived from a user-defined maintenance dose of IVIG, which was equal to 0.450 g/kg per infusion [42, 43]. The IVIG maintenance dose was then converted to a total SCIG dose per infusion using an IVIG-to-SCIG conversion ratio equal to 1.05 based on US real-word observations [44], ultimately yielding an IgPro20 base-case dose of 0.175 g/kg body weight. Additional support for this dosing conversion ratio comes from Jolles et al. [6]. Dosing for IgPro20 packaged as a PFS was assumed to be 16.7% lower than for IgPro20 vials based on evidence from a recent patient survey [38], resulting in an input IgPro20 PFS dose of 0.145 g/kg. Base-case doses of other SCIG comparators were calculated with a similar dose conversion methodology with a conversion ratio of 1.30 for Cuvitru, 1.00 for HyQvia, 1.37 for Xembify, and 1.40 for Cutaquig based on respective US labels [45,46,47,48]. All doses per kg of patient bodyweight were converted to dose per infusion based on US vital statistics data on average patient weight [4, 37]. Finally, total dose per IVIG and SCIG infusion, per corresponding patient, was converted to annual dose per patient based on evidence on the number of IVIG and SCIG infusions, respectively [19, 49].
Table 3 describes costing of training and infusion times. The cost of SCIG training is only applicable to the IDN perspective, as training costs are typically not paid for directly at the commercial health plan level. Similarly, SCIG infusion supply costs were incorporated based on prices for the infusion pump (amortized over the assumed life of the pump), tubing, syringes, tip-to-tip connectors, needles, and bandages, as suitable based on SCIG drug packaging method. Thus, for example, infusion supply costs for SCIGs packaged as vials were expected to be higher than for SCIGs packaged as PFSs because the former require transfer needles and tubing to transfer product from the vial to the syringe.
Table 3 Input costs of SCIG self-infusion by SCIG drug packaging method and SCIG model of administration—drug costs, training costs, infusion supply costs, and infusion time costsFor the IDN perspective, the indirect costs of infusion and caretaker time were included on the presumption that IDNs generally incorporate integrated patient care, including case management at some level [50]; for the commercial perspective, these were excluded. Based on literature estimates, 28% of adult patients were in need of a caretaker [51]. These indirect costs included IVIG and SCIG infusion time consisting of travel time, pre-infusion time, infusion time, and post-infusion time for the patient and caretaker. Based on estimates from a recent survey of patients with PID [19], the following infusion times were assumed: for the home (nurse-administered) IVIG administration setting, the default total infusion time was taken to be 5.85 h with 0.93 h for pre-infusion time, 4.30 h for infusion time, and 0.62 h for post-infusion time. In the home setting, caretaker hours are not included, as it is assumed that nurses independently complete the infusion. For non-home IVIG administrations (hospital and infusion center), the default total infusion time for each of the patient and the caretaker was 60 m (1 h) for travel time, 0.93 h for pre-infusion time, 4.30 h for actual infusion time, and 0.62 h for post-infusion time [19]. Total infusion time for IgPro20 vials was 1.69 h and total infusion time for IgPro20 PFS was 1.49 h [38]. As IgPro20 infusion times in all sites of care were substantially less than 8 h in these patients with immunodeficiencies, based on published evidence, we did not account for overnight patient accommodations. Additionally, ambulatory food costs would be expected to be minimal and were not included in the absence of evidence.
Costs of IVIG infusion-related complications and IVIG safety events were included for both commercial and IDN perspectives. IVIG-related infusion complications included those specifically associated with patients requiring infusion ports (assumed 3.3%, based on a recent study [52]) and those more generally associated with IVIGs. Infusion port-related safety events included catheter-related infections (0.93%), catheter-related blood stream infections (1.50%), thrombophlebitis (2.20%), and infiltration and extravasation (0.60%). More general IVIG-related safety events included thromboembolic events (0.38%), aseptic meningitis (0.07%), and acute hemolysis (0.04%).
A one-way sensitivity analysis was conducted by varying the key model parameters one at a time while holding all other inputs constant to determine the sensitivity and robustness of the model. Various scenario analyses were conducted in the model, including alternative market share shift scenarios with an increased market share of IgPro20 PFS by 5% scenario and a 5% IgPro20 PFS market share increase with a reduction only in other SCIG market shares, alternative dose conversion methodology using an IgPro20 dosing switch ratio of 1.37 instead of the real-world evidence based value of 1.05, and alternative drug pricing basis.


Comments (0)