
Remember me
Sepsis has been called a ‘hidden’ healthcare disaster (Angus 2010) and it has been recognized as a global health priority by the World Health Organization in 2017 (Reinhart et al 2017). Its occurrence ranges from 13.9% to 39.3% worldwide (Sakr et al 2018) and it is one of the major causes of mortality in the ICU, accounting for almost 20% of all global deaths (Rudd et al 2020). Septic shock is a subset of sepsis in which particularly profound circulatory, cellular, and metabolic abnormalities are associated with a greater risk of mortality than with sepsis alone; hospital mortality rates of septic shock patients are greater than 40% (Singer et al 2016).
The most recent definition, introduced in 2016, defines sepsis as a life-threatening organ dysfunction caused by a dysregulated host response to infection (Singer et al 2016). Typically, organ function is clinically monitored by means of the sequential organ failure assessment (SOFA) score, that is based on six sub-scores, one for each vital organ system, i.e. the respiratory, cardiovascular, hepatic, coagulation, renal and neurological systems (Vincent et al 1996). Organ dysfunction can be identified as an acute change in the SOFA score ⩾2 points consequent to the infection and, generally, higher SOFA scores are associated with an increased probability of death (Vincent et al 1998). However, the SOFA score is traditionally calculated on admission to the intensive care unit (ICU) and every 24 h thereafter. The calculation of SOFA requires the measurement of some laboratory variables, namely PaO2, platelet count, creatinine and bilirubin levels; therefore, the laboratory tests limit the availability of the SOFA score during the ICU stay of septic patients, so that the SOFA score cannot be used for continuous bedside monitoring.
In the ICU, patients are subject to constant supervision and continuous monitoring. Several metrics are utilized to assess patient status, including hemodynamic indices such as mean arterial pressure and cardiac output (CO), which are continuously evaluated and are available at intervals of approximately two minutes. Additionally, laboratory values, including lactate levels and standard blood gas analysis parameters, are assessed on an irregular basis. However, it should be noted that these parameters offer a general overview of the patient’s condition and are primarily employed for the purpose of monitoring the effectiveness of therapeutic interventions. A major limitation of the average values of hemodynamic variables is that they cannot assess the regulatory mechanisms of the cardiovascular system, although there is a growing body of evidence showing how the cardiovascular system can be still altered after resuscitation despite the achievement of hemodynamic targets (Carrara et al 2018). Autonomic dysfunction and the associated alteration of blood pressure (BP) and heart rate (HR) variability are a hallmark of septic patients and their severity and persistence are related to worse patient outcome (Carrara et al 2021).
The wealth of information provided by the hemodynamic signals continuously monitored at the bedside and the abundance of data collected in the ICU, freely available through public datasets (e.g. MIMIC-III or HiRID database), have prompted scientists to investigate and develop novel techniques and strategies to improve patient’s assessment, stratification, and prediction of catastrophic events. Machine-learning techniques have demonstrated to be superior to traditional approaches (Nemati et al 2018, Shi et al 2025). Patient mortality or sepsis onset prediction are the most investigated endpoints, but the prediction of patient progress is of great importance as well. A limited number of works have focused on predicting the therapy response in septic patients although a reliable indication of imminent patient deterioration can potentially improve clinical decision-making and better tailor the therapy.
In this work we have utilized a large amount of ICU data and state-of-the-art machine learning techniques. We have included standard and non-standard physiological indices and indices that resulted informative for the monitoring of therapy response in septic patients, i.e. after sepsis is already developed (Cao et al 2004, Griffin et al 2005, Moorman et al 2011). The objective of this study was to predict disease progression and the response to standard resuscitation therapy in septic patients and to verify whether variability indices and SOFA trend information can contribute to the description and prediction of patient deterioration and worsening, in particular, to verify whether information on subtle changes and patterns that might otherwise be undetected can add to common descriptors. The publicly available HiRID database was used for this purpose (Hyland et al 2020, Faltys et al 2021) and a comprehensive end-to-end pipeline for timeseries analysis was developed including data pre-processing and cleaning, features extraction, training and evaluation of implemented machine learning models. The work focused on a relatively uniform study population, i.e. septic patients with a length of ICU stay (LOS) longer than 2 days, to exclude mild patients.
2.1. HiRID datasetThe HiRID critical care dataset is a critical care database that is freely accessible. It was developed in cooperation between the Swiss Federal Institute of Technology (ETH) in Zürich, Switzerland, and the Department of Intensive Care Medicine of the Bern University Hospital, Switzerland ICU. The database contains de-identified demographic information and a total of 712 routinely collected physiological variables, diagnostic test results, and treatment parameters from more than 33 000 admissions during the period from January 2008 to June 2016. Data is stored with a uniquely high time resolution of one entry every two minutes (Hyland et al 2020, Faltys et al 2021).
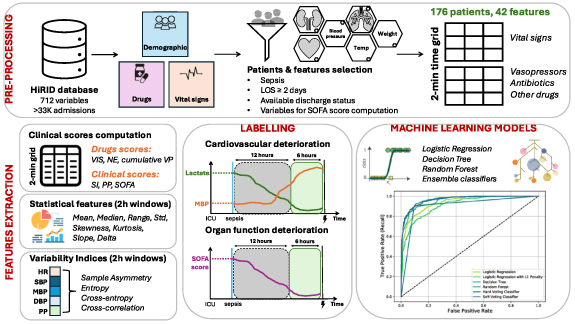
The raw dataset is divided into two different tables, one containing observations of measured physiological parameters and the other with records of drugs administrations. From the observation table, the following variables were used: (i) the time at which the observation was made; (ii) the ID of the measured variable; (iii) the measurement values and a score relating to their reliability. From the therapy table we retrieved: (i) the drug ID; (ii) the time of administration; (iii) the given dose; (iv) the scores on the reliability of that administration; (v) the infusion ID to discriminate a bolus from an infusion. In case of infusion, the start and the end of the infusion were identified (Hyland et al 2020, Faltys et al 2021). The pipeline used to develop our models is illustrated in figure 1.
Figure 1. Pipeline for data pre-processing and time series analysis of critical care data from septic patients extracted from the publicly available HiRID database. The pre-processing consisted in the selection of septic patients with all the variables necessary for SOFA score computation, the reorganization of data, the identification and correction of missing or outlier data. Different patient classification criteria were considered and several machine learning models were used to predict patients development and therapy response.
Download figure:
Standard image High-resolution image 2.2. Raw dataset pre-processingWe included patients with sepsis by filtering the database using the APACHE II group feature, setting it to 102, a code associated with a diagnosis of sepsis. The ICU LOS was calculated as the time difference between the last available measurement of HR and the first one. The admission time was not very accurate, this choice was therefore the most reliable since the electrocardiogram is the first signal recorded when a patient is admitted to the ICU. The inclusion of patients was based on the following criteria: an LOS of at least 48 h, and the availability of information regarding discharge status (alive or dead). The total number of patients included in the study was 321.
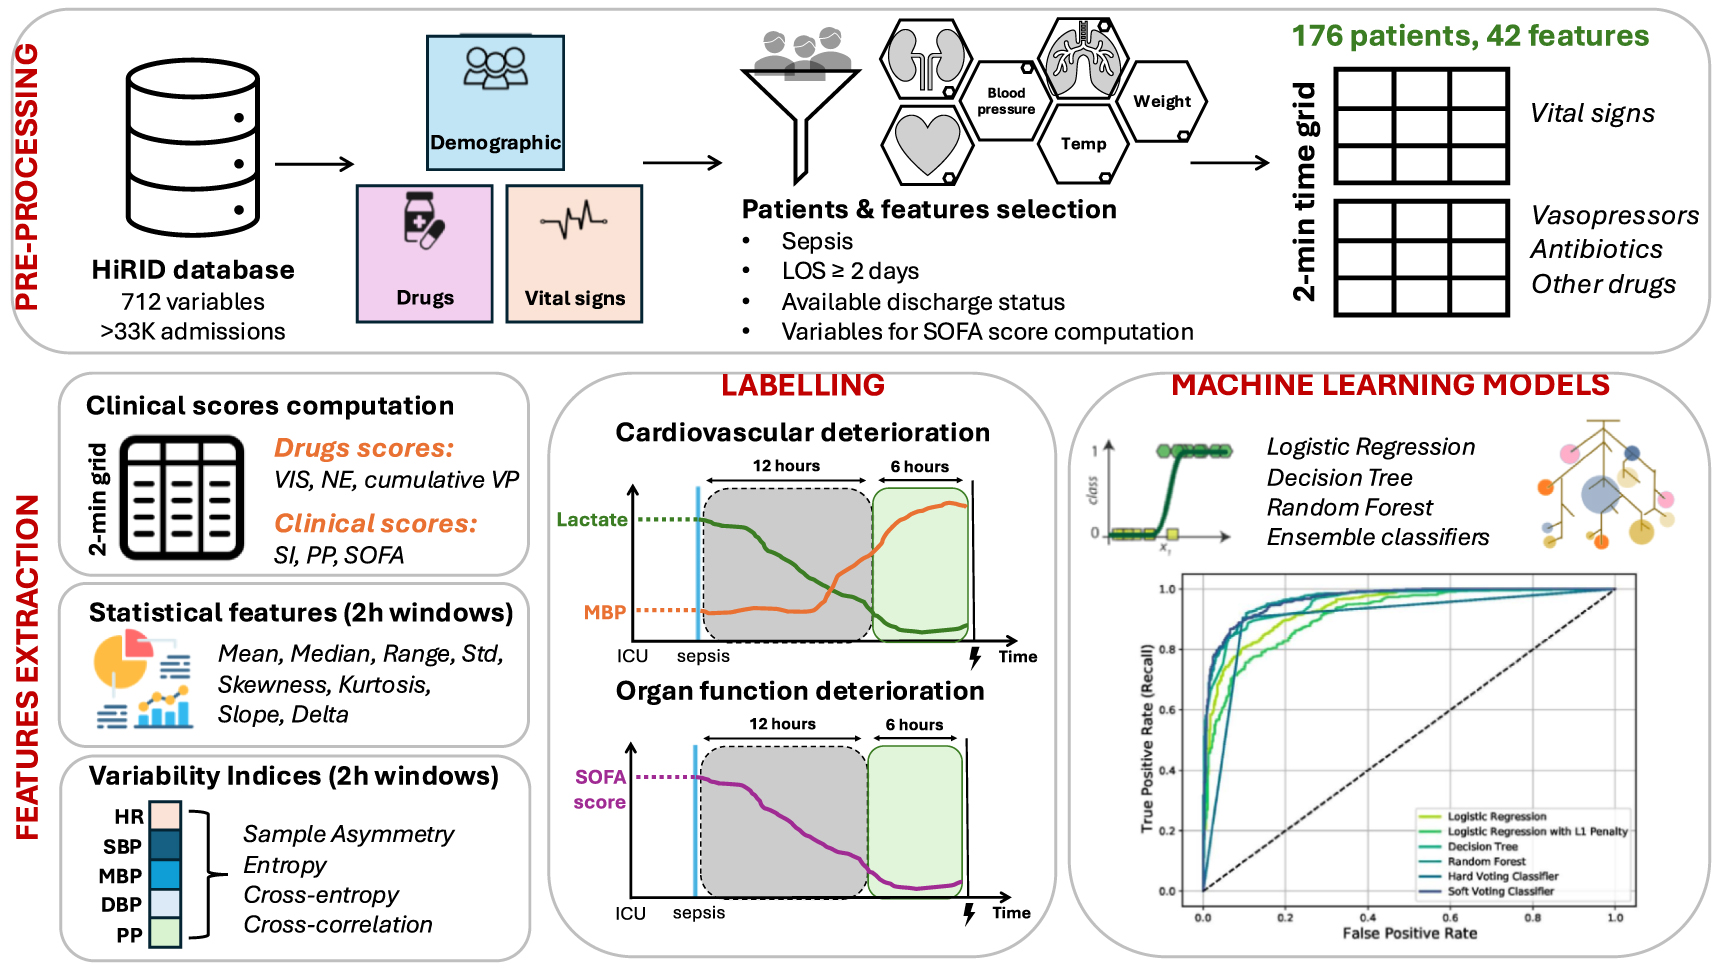
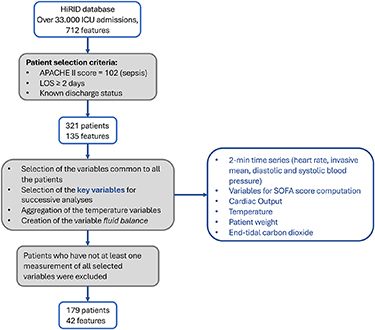
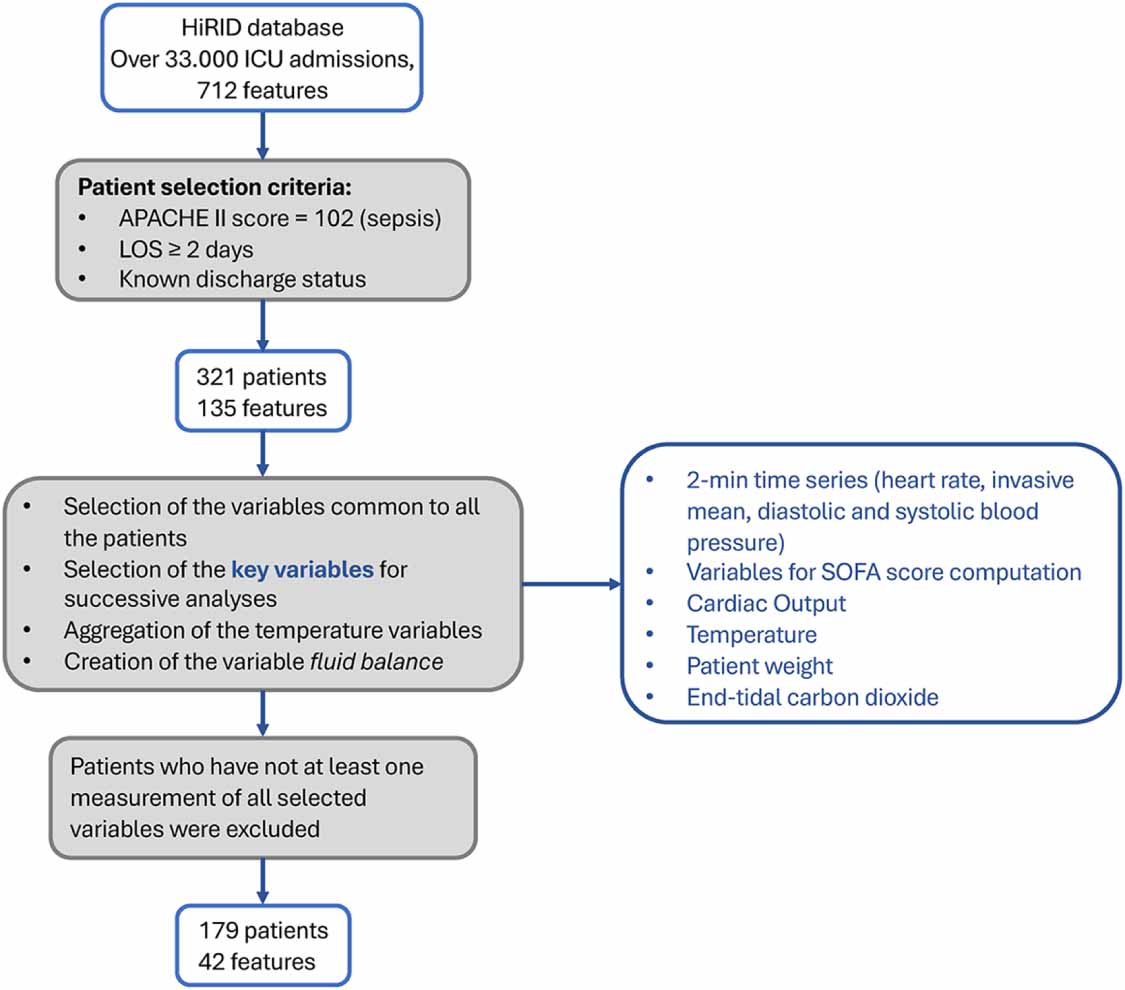
The fundamental variables considered in this study include HR, invasive arterial BP, and measures necessary for SOFA score computation, such as oxygen partial pressure (PaO2), fraction of inspired oxygen (FiO2), mechanical ventilation mode, platelet count, Glasgow Coma Score, bilirubin, creatinine, and hourly urine output (UO), in addition, CO, temperature (core body, rectal, axillary temperature were averaged to have a single value), patient’s weight necessary to normalize drug administration into mcg/kg/min, end-tidal carbon dioxide (etCO2), which was used also to verify if a patient is under mechanical ventilation. Patients without any measurement of one or more of these variables were excluded from the study, except for variables related to ventilation mode and hemofiltration which were not considered missing values, since they were interpreted as absence of these treatments. A flow chart representing the inclusion/exclusion selection process is shown in figure 2.
Figure 2. Flow chart of the inclusion/exclusion process of patients and features selection.
Download figure:
Standard image High-resolution imageThe variables data were first filtered from errors or outliers by adopting the same thresholds and ranges of accepted values as proposed in Hyland et al (2020). Subsequently, duplicates, defined as two measurements on the same patient taken at the same time and having the same value, were removed. Finally, measurements designated as ‘invalid’ according to the status variable were also removed from the dataset. The feature values were then reorganized in two Pandas DataFrames for each patient, one for physiological variables and one for drug administrations for the overall ICU stay. The time grid was organized into 2 min epochs, according to the sampling frequency of the vital signs.
Regarding the physiological variables the 2 min time grid was constructed starting from the first HR measurement until the last HR measurement. In case of more values for categorical or ordinal indices in the same 2 min interval, only the final measurement was considered. For the continuous variables, these measurements were averaged so to retain one value every two minutes. In case of indices not continuously measured a forward imputation approach was adopted. Measures supposed to be continuously monitored, i.e. HR or arterial pressures, were not subjected to forward imputation and NaN values were assigned instead. The overall procedure is further elucidated in the supplementary material (figure S1).
For what concern the drugs administration data, all the infusion identifiers for antibiotics and vasopressors were checked. Vasopressor dosage was standardized into μg/Kg/min, and the patient’s weight was imputed if not available prior to the initial HR measurement in the analyzed time interval. The final dataset includes vasopressor dosages of the following drugs: Noradrenaline, Adrenaline, Euphylline, Aminophylline, Vasopressin, Theospirex, Milrinon, Dobutrex (Dobutamine), Corotrop, Simdax. The administration of the other classes of drugs was recorded as binary information in the 2 min intervals. These data provide insights into concurrent drug administration, contributing to a comprehensive understanding of patient treatment. A schematic representation of the process is illustrated in the supplementary material (figure S2).
The SOFA score was computed according to the clinical definition (Vincent et al 1996, 1998, Martin-Loeches et al 2024) when all the necessary information was available in the considered time window. The features ventilation mode and etCO2 were used to determine whether a patient was mechanically ventilated or not. The first feature contains a code for each mechanical ventilation type, in case of code equals to 1 the patient is not receiving mechanically ventilation. If the information about ventilation mode was missing, we verified if the variable etCO2 within the same 2 min time interval had a values, in this case the patient was considered under mechanical ventilation. Conversely, if no value was identified, the patient was classified as not receiving mechanical breathing assistance. The daily UO was computed by averaging the values of hourly UO within the 24 h before the time of interest and multiplying it by 24. If some hourly values were missing, the average of the available hourly measurements was computed and then multiplied by 24 h. The computed SOFA score was used to verify that all the selected patients had developed sepsis during their ICU stay. In particular, at least one of these conditions must be met for each patient: (i) SOFA score increase of at least 2 points with respect to the first value; (ii) SOFA score value ⩾8; (iii) SOFA score increase of at least 2 points with respect to the minimum value and the patient was under antibiotic therapy (i.e. suspicion of infection). In order to estimate sepsis onset, the time at which SOFA score met the aforementioned criteria, as well as the time of the first antibiotics administration were compared and the latest of these was then retained. The final population was composed of 176 septic patients (gender: 110 males, 66 females; hospital mortality: 18 deaths). This finding aligns with the conclusions of epidemiological studies, which have documented a higher propensity among males to develop severe sepsis compared to females. Nevertheless, the impact of sex on the prognosis of severe sepsis remains a subject of debate (Min et al 2024). The number of features common to all patients was reduced to 42. The final list of included variables is illustrated in the supplementary material (table S1).
2.3. Additional composite clinical indicesAdditional features were computed from the raw 2 min time series as described in the following.
2.3.1. Scores for vasoactive drugsThe need of hemodynamic support through vasoactive drugs is commonly considered as an indicator of disease severity, with higher dosages associated with increased mortality (Belletti et al 2021). Therefore, it is important to have quantities which permit to compare the different treatments. Norepinephrine equivalent dose (NE) estimates the overall administered drug dosage in support of arterial BP, NE was computed according to the following formula (Kotani et al 2023):

Vasoactive inotropic score (VIS) provides an overall amount of administered drugs supporting the cardiovascular system, VIS was computed according to the following formula (Belletti et al 2021):

All the quantities are expressed in μg/Kg/min, except for vasopressin that is expressed in units/Kg/min.
Cumulative vasopressor dosage is computed as the total amount of administered vasopressors over a fixed time period:
where n is the number of 2 min bins and  is the dosage of the VP vasopressor administered within the ith bin.
These features provide a standardized and quantifiable measure of disease severity in ICU patients. They have been extensively validated, and they have demonstrated a strong prognostic value. SOFA score was computed according to the clinical definition (Vincent et al 1996, Singer et al 2016), as previously stated.
Shock index is a simple and rapid clinical tool used to assess the adequacy of perfusion and the potential presence of shock in a patient (Koch et al 2019):

Pulse pressure (PP) is computed as the difference between systolic and diastolic BP, it represents a dynamic indicator of the heart contraction force and the compliance of the arterial system (Dart and Kingwell 2001) and it was found to be associated with significantly increased mortality in septic patients (Khanna et al 2023).
2.4. Statistical and variability indicesStatistical and variability indices were extracted from the raw time series considering a 2 h sliding window (50% overlap). Before the indices computation, the amount of missing data was checked in the considered time window: where the proportion of missing values was less than 10% and no more than four consecutive values were missing, the values were interpolated with a cubic spline, and the missing values were imputed. If the percentage of missing values was more than 10% the window was discharged from the successive analyses.
For continuous variables, e.g. HR and BP, mean, median, range (i.e. the difference between the maximum and minimum value), slope of linear regression, delta (i.e. the difference between the last and the first measured value), standard deviation, skewness, and kurtosis were computed on overlapped 2 h windows by considering the not imputed values only. For ordinal and categorical variables and the estimated scores (SOFA, NE, VIS), maximum, minimum, range, and delta were computed on overlapped 2 h windows.
Finally, variability indices were computed for the time series of HR, systolic, diastolic, and mean BP (SBP, DBP, and MBP, respectively), and PP on the overlapped 2 h windows. Sample asymmetry (SA) was calculated according to the original definition (Kovatchev et al 2003); sample entropy (SampEn) and approximate entropy (ApEn) are measures of the irregularity of the time series (Richman and Moorman 2000, Scahill et al 2024). For the computation two parameters m and r must be set, we used m = 1, r = 0.1 and m = 1, r = 0.15. Cross-entropies between HR and SBP time series (Cross-SampEn, Cross-ApEn) were obtained by setting m = 1, r = 0.35 and m = 1, r = 0.4 (Delgado-Bonal and Marshak 2019). Cross-correlation between HR and SBP was computed, and the maximum value of the correlation and its corresponding time lag over the overall 2 h window were assessed. In addition, the peak value and corresponding time lag within a narrower range of [−5, +5] samples, corresponding to a range of ±20 min, were assessed.
2.5. Final dataset and outcome definitionThe dataset was divided into 12 h 50% overlapping windows that were used to predict the patient clinical progress in the following 6 h. This seemed a good compromise between the rapid progression and life-threatening nature of sepsis and the data availability. Each 12 h interval was considered independently, even if it belonged to the same patient, with the objective of increasing the sample size. The features values were obtained by averaging the values computed for the 2 h time grid within the considered 12 h or 6 h windows.
Moreover, metrics tracking patient status and therapy response were included. The number of increments and decrements of SOFA score, mean, median, and final value of SOFA score in the window, percentage of time the patient spent with MBP < 65 mmHg, last measured value of lactate in the window, percentage of time under vasopressor therapy, percentage of time under mechanical ventilation were computed over the considered time windows. Missing data were imputed by adopting the multivariate imputation by chained equations technique (van Buuren and Groothuis-Oudshoorn 2011). Each 12 h time window was labeled according to the patient response in the next 6 h time window as responders or non-responders according to two different criteria.
Labeling based on cardiovascular criteria
MBP and lactate values were used to classify the response to the therapy according to the following criteria:
MBP > 65 mmHg for more than 50% of the next 6 h windowIncrement of mean MBP of at least 10% with respect to MBP of the preceding 12 h window ( )Last measurement of lactate in the 12 h and next 6 h window remains in the normal range (i.e. <2 mmol l−1)Lactate in the 12 h window is in the mild level (i.e. between 2 and 4 mmol l−1), and it decreases to the normal level in the next 6 hLactate in the 12 h window is in the severe range of values (i.e. >4 mmol l−1), and it decreases to the mild or normal level in the next 6 h.
The 12 h windows which met at least one of the MBP criteria and at least one of the lactate criteria were categorized as responders. In all the other cases they were classified as non-responders.
Labeling based on SOFA score
In order to capture the overall complexity of the patient’s condition, the SOFA score was considered for a second classification, as it encompasses multiple organ systems in addition to the cardiovascular system. A decrease or stabilization of the SOFA score over time may be indicative of a positive response to treatment and a reduction in organ dysfunction (responders). Conversely, no significant change or an increase in the SOFA score may suggest a lack of response to treatment and a deterioration of organ functioning (non-responders). Therefore, the difference between the last SOFA in the next 6 h window and the last SOFA in the current 12 h window  was computed and used to label each 12 h window.
Different modeling strategies were tested, in particular three different approaches were evaluated:
Approach A. The labeling based on cardiovascular criteria has been adopted; the models were developed using the statistical features computed on vital signs, the clinical features and the metrics tracking patient status and therapy response. The SOFA score was excluded from these metrics.
Approach B. We used the same labeling criteria and the same features as before, but we included also the variability indices computed from vital signs, such as entropies, cross-entropies, cross-correlation, and SA.
Approach C. The labeling based on SOFA score has been adopted and all the features were considered, including those derived from SOFA score.
For the labeling based on cardiovascular criteria (approach A and B) 2779 windows were labeled as responder, 2275 non-responder; 312 time windows were not considered for further analyses as the data for classification were unavailable or missing. For the labeling based on SOFA score, 2597 time windows were classified as responder (Δ < 0), 2350 as non-responder (Δ > 0), while 419 time windows were excluded due to missing information necessary to compute the SOFA score. The classes were minimally unbalanced, the percentage of negative and positive classes were 55% and 45% in the first case, 52% and 48% in the second case.
The final dataset was divided into 80% for training and 20% for testing. A stratified split was adopted to ensure a balanced and representative training and test set according to classification labels (responders or non-responders), the quartiles of ICU LOS, and the patient’s discharge status (alive/dead). The training and test set do not contain the same patients. The data were first scaled and normalized before models construction.
Interpretable binary classification models were implemented, namely: logistic regression, logistic regression with L1 penalty, decision tree, random forest, and ensemble methods, such as hard and soft voting classifiers. For each model, a grid search procedure was performed on different combinations of hyperparameters. Then, for each model, a 5-fold cross-validation was performed to get the best model in terms of area under the receiver operating characteristic curve (AUROC).
Finally, permutation feature importance was used to assess the features importance. The values of each feature were randomly shuffled 10 times, and the model’s performance was evaluated. The variation in performance scores was measured and used as an estimate of the importance of each feature. By identifying the features that contribute most to the predictive power of the model, possible clinical implications can be understood, and a decision can be made to focus on those variables to simplify the model (Altmann et al 2010). Finally, models performance was evaluated on the test set according to standard metrics, such as accuracy, precision, recall, F1-score, and the AUROC.
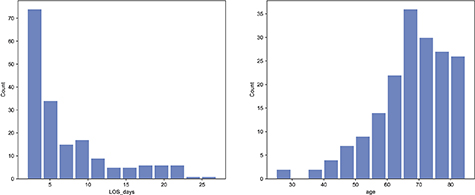
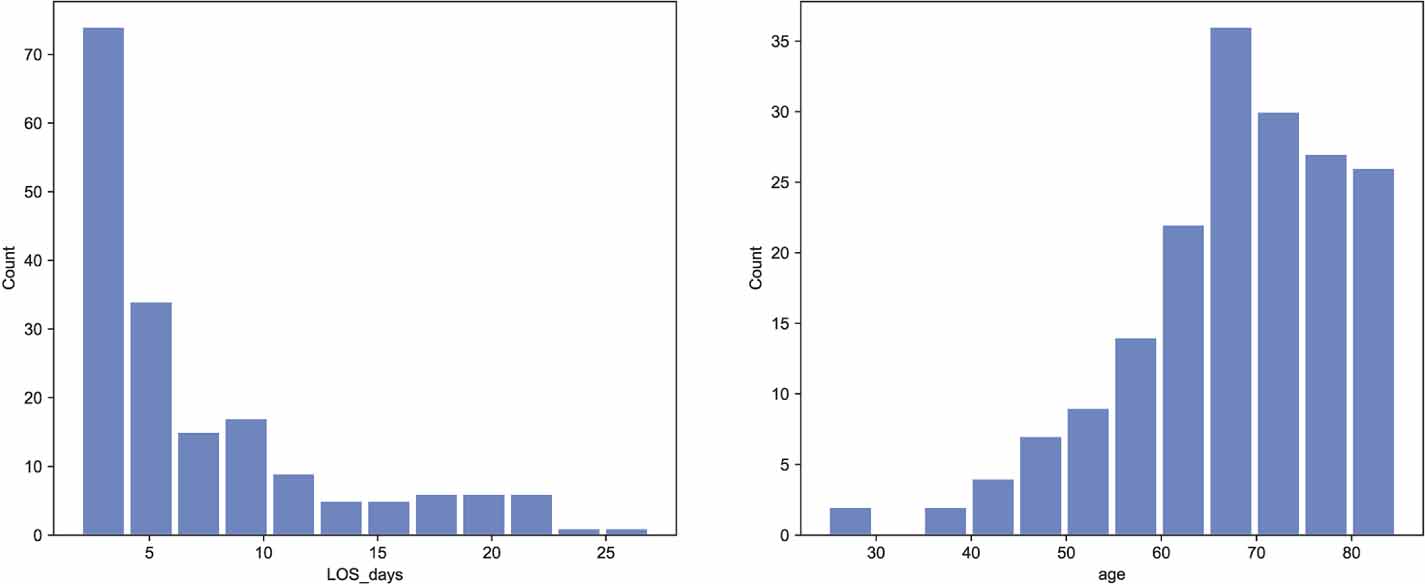
The distribution of age and LOS of the study population is shown in figure 3.
Figure 3. Age and ICU length of stay (LOS) distribution in the final study population.
Download figure:
Standard image High-resolution imageThe hyperparameter values that were selected by the grid search procedure are reported in the supplementary material (table S2) for all the models and labeling strategies under consideration.
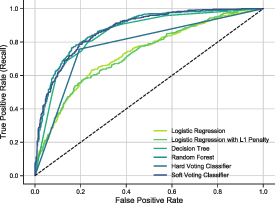
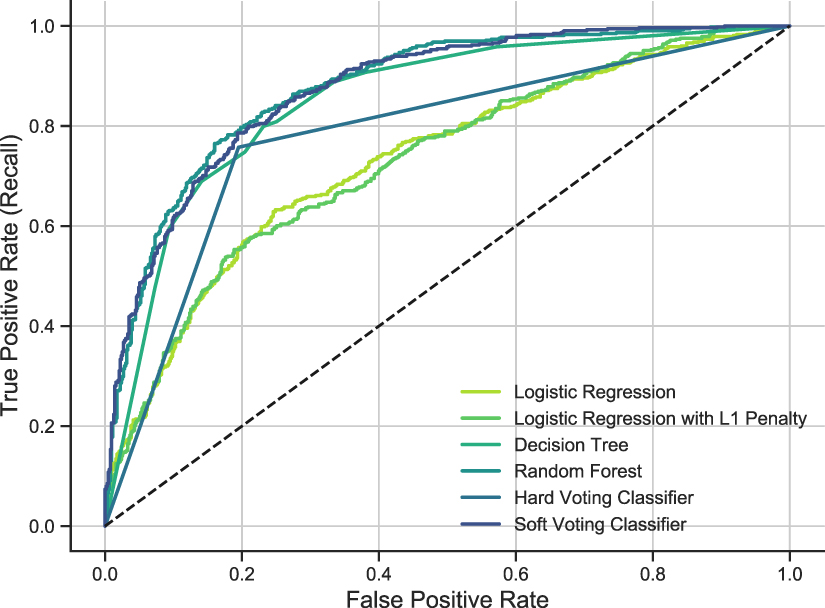
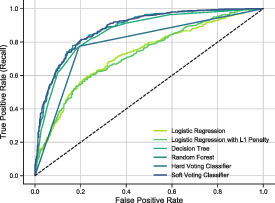
3.1. Prediction models of cardiovascular deterioration with statistical metrics and clinical parameters (approach A)The 12 h time windows were labeled according to the patient’s cardiovascular status in the following 6 h, i.e. if the patient improves or not organ perfusion by evaluating variations in MBP and lactate levels. Only statistical quantities derived from standard clinical metrics were included. The best performance was achieved by the random forest model with an AUROC = 0.8770. The overall performance metrics for all the models are reported in table 1. The ROC curves of all the implemented models is reported in figure 4.
Figure 4. ROC curves of all implemented models when labeling the 12 h time windows with cardiovascular criteria and using the statistical metrics of standard clinical parameters (Approach A).
Download figure:
Standard image High-resolution imageTable 1. Performance of models of cardiovascular deterioration prediction with statistical metrics and clinical parameters (approach A).
ModelAccuracyPrecisionRecallF1-scoreAUROCLogistic regression (LR)0.78170.76290.75570.75930.7317LR with L1 penalty0.77990.76300.75000.75640.7304Decision tree (DT)0.78260.74290.79920.77010.8510Random forest (RF)0.79470.75620.81060.78250.8770Hard voting0.78340.76480.75760.76120.7813Soft voting0.79290.77270.77270.77270.8743The first 20 ranked features obtained by the permutation analysis were in all models the statistical quantities of lactate, such as the maximum or minimum value, and statistics related to MBP (e.g. slope, median, mean). This results is not surprising as the definition of the labeling criteria, i.e. cardiovascular deterioration, is based on the evolution of these parameters, moreover, this result is consistent with the original work of Hyland et al (2020) aiming at early prediction of circulatory failure. Different metrics (minimum, range, delta) related to fluid input, fluid output, and fluid balance also appeared among the 20 most important variables in all models. In 4 out of 6 models, the frequency of variation in vasopressor dosage was ranked in the first positions. In two models the maximum VIS value also appeared to be significant, emphasizing the role of administered therapy for the characterization of patient’s status. Other important variables were related to cardiac, renal, immune and respiratory function. The 20 most important features selected by all the developed models for the approach A are reported in supplementary figure S3. Finally, the distribution of the most relevant variables between the two classes of responders and non-responders is shown in figure S4. Interestingly, in non-responders the values of lactate were higher, while values of MBP were lower and with reduced variability compared to responders. Fluid balance was higher in non-responders, due to increased fluid input and reduced hourly UO. The number of increases and decreases in vasopressor dosage was higher and with larger variability in non-responders. Additionally, the maximum value of VIS was elevated, and the percentage of time spent under vasopressor therapy was increased in non-responders. In contrast, responders exhibited marginally higher oxygen saturation levels. Furthermore, laboratory values, including creatinine and bilirubin, were elevated in non-responders, while platelet levels were diminished, indicating significant organ dysfunction in these patients
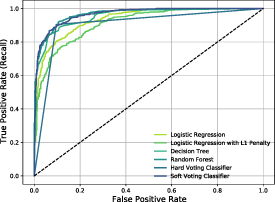
3.2. Prediction models of cardiovascular deterioration with statistical metrics of clinical parameters and variability indices from vital signs (approach B)The features used to construct the predictive models consisted of those used in approach A with the addition of vital signs variability indices. Similarly to the previous case, the 12 h epochs were labeled according to the patient evolution in the following 6 h based on the increase or decrease of MBP and lactate. With the exception of the logistic regression and logistic regression with L1 penalty models, all models demonstrated a slight improvement in performance in comparison to approach A. The soft voting classifier exhibited the highest level of performance, achieving an AUROC value of 0.8814. The overall performance metrics for all the models are reported in table 2. The ROC curves of all the implemented models is reported in figure 5. The additional variability indices resulted listed among the 20 most important features in 4 models out of 6. These indices include the maximum value of the cross-correlation and the cross-entropy between HR and systolic blood pressure (SBP), along with the entropy value of SBP. As before, lactate, blood pressure, fluid balance, and vasopressor therapy were considered among the most important variables in all models. The feature rankings by all models developed for approach B are reported in supplementary figure S5. The boxplot distribution of the most relevant variables between the two classes of responders and non-responders is shown in supplementary figure S4. Of note, the cross-entropy and maximum cross-correlation between HR and SBP were found to be higher in the responder class, while the ApEn of SBP was found to be higher in non-responder class.
Figure 5. ROC curves of all implemented models when labeling the 12 h time windows with cardiovascular criteria and using the statistical metrics of standard clinical parameters together with vital signs variability indices (Approach B).
Download figure:
Standard image High-resolution imageTable 2. Performance of models of cardiovascular deterioration with the addition of variability indices from vital signs (approach B).
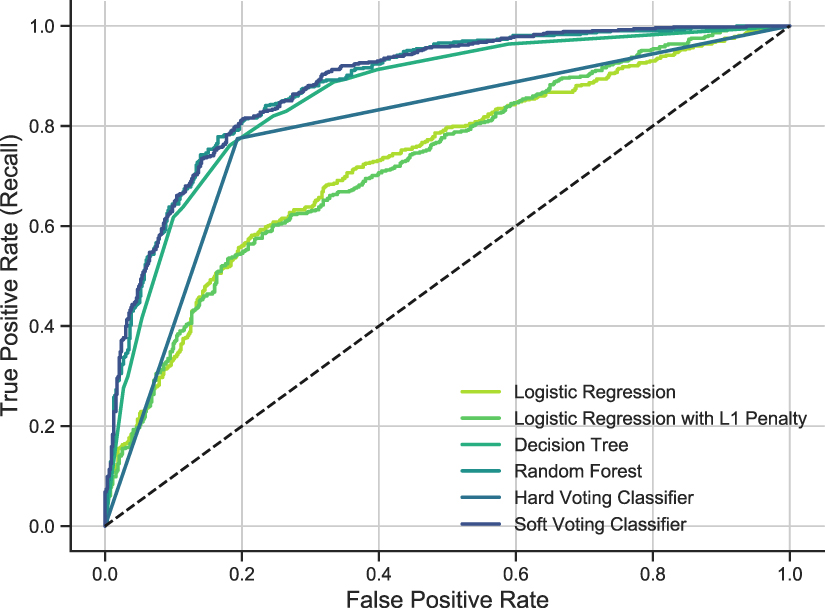
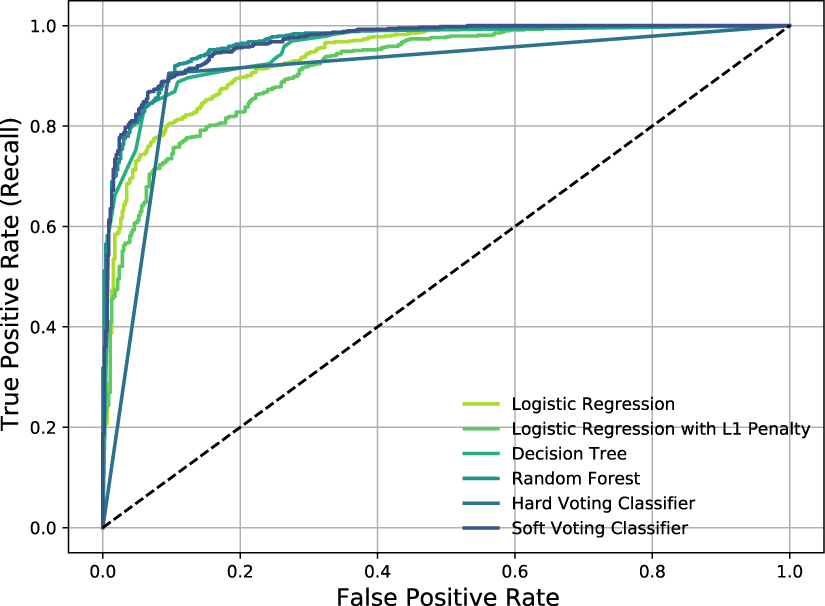
ModelAccuracyPrecisionRecallF1-scoreAUROCLogistic regression (LR)0.78430.76230.76520.76370.7264LR with L1 penalty0.78520.76570.76140.76350.7256Decision tree (DT)0.78430.73640.82010.77600.8591Random forest (RF)0.79900.76010.81630.78730.8791Hard voting0.79210.77020.77460.77240.7906Soft voting0.80410.77510.80300.78880.88143.3. Prediction models of SOFA improvement with statistical metrics of clinical parameters and variability indices from vital signs (approach C)The features considered so far were integrated with the ones derived from SOFA score. The 12 h epochs were labeled according to the variation in SOFA score values in the successive 6 h. The ROC curves for all models are represented in figure 6, and the best performance was achieved by random forest classifier with AUROC = 0.9671. Generally, the performance of all models significantly improved compared to the other classification models as also reported in table 3.
Figure 6. ROC curves of all implemented models when labeling the 12 h time window with the SOFA score based criteria and using the statistical metrics of standard clinical parameters together with vital signs variability indices and SOFA statistics (Approach C).
Download figure:
Standard image High-resolution imageTable 3. Performance metrics of models of organ dysfunction prediction based on SOFA score (approach C).
ModelAccuracyPrecisionRecallF1-scoreAUROCLogistic regression (LR)0.90380.93770.89940.91820.9369LR with L1 penalty0.88640.91870.88920.90370.9138Decision tree (DT)0.88810.91520.89650.90570.9530Random forest (RF)0.90730.92030.92570.92300.9671Hard voting0.90470.93380.90520.91930.9046Soft voting0.89770.92530.90230.91370.9661Among the first 20 ranked features we observed the SOFA statistics (e.g. median, mean, maximum, minimum, delta) were among the most important features in all models. Moreover, the number of increases and decreases in SOFA score was also selected in 5 models out of 6, supporting the evidence that changes in the score over time are associated with possible patterns in patient therapy response or patient instability. The SampEn of DBP and HR, the cross-entropy between SBP and HR, features related to fluid exchange (e.g. maximum and minimum fluid input and fluid output) and the administered therapy (e.g. the number of increments and decrements of vasopressors) appeared in the first ranked positions. The 20 most important features selected by each model are reported in supplementary figure S6.
The boxplot distribution of the most relevant variables between the two classes of responders and non-responders is shown in supplementary figure S7. Of note, the non-responder class showed greater variability and higher values in various SOFA score metrics, together with less frequent increases and decreases in SOFA score. Furthermore, subjects who did not respond to the treatment exhibited diminished DBP and HR SampEn values, along with a marginally diminished cross-entropy value between HR and SBP. Furthermore, non-responders exhibited diminished variability in fluid output, augmented variability in fluid input, and a greater frequency of vasopressor escalations and de-escalations. These observations underscore the necessity for continuous reassessment of therapeutic interventions in this patients. Richmond agitation-sedation scale, as well as the Glasgow Coma Scale sub-scores, were found higher among non-responders, suggesting neurological deterioration. Furthermore, elevated maximum blood lactate levels were observed in non-responders, indicating more pronounced tissue hypoperfusion and impaired metabolism. These patients also tended to have a lower minimum CO. Furthermore, elevated bilirubin and creatinine levels were observed in non-responders, suggesting compromised liver and kidney function.
The objective of the present study was to investigate standard and non-standard physiological indices and parameters that were previously observed to be informative for the monitoring of therapy response in septic patients, with the aim of providing a useful tool that can help predict disease progression and the response to standard resuscitation therapy relevant to clinical decision-making.
We focused on a relatively uniform population, i.e. septic patients admitted to ICU for a minimum of two days, to exclude patients with less severe or too critical conditions. The data in the current 12 h window were used to predict the evolution of the patient’s condition in the following 6 h window, as defined by different labeling criteria and modeling strategies. Our research was motivated by the hypothesis that features pertaining to vital signs trend and variability would enhance the efficacy of the model and elucidate the pathophysiology mechanisms of the patients’ progress.
The first labeling criterion was meant to focus on the prediction of cardiovascular instability and deterioration, which are characteristic of septic patients and constitute the primary clinical objective of resuscitation. This is supported by evidence that mitigating cardiovascular instability, i.e. hypotension and hypoperfusion, would result in the restoration of organ function.
The second labeling criterion wa
Comments (0)