
Remember me


Regarding the current study, beside the abovementioned seven studied groups, there are another additional five groups, which include; normal control group exposed to PHA; normal control group treated with SE; normal control group treated with AST; normal control group treated with both SE and AST; and normal control group treated with a combination of SE and AST along with exposure to PHA. Of note, the results of these additional five groups in all the measured parameters and the histopathological findings were non-significant, compared to those of the normal control group. Consequently, the findings of these additional five groups were not comprised in this study to sustain simplicity of the presented data.
Combination of SE and AST with PHA Enhanced Locomotor, Attention and Cognitive Functions Assessed by Open-Field and Y-Maze Tests in MSG-Intoxicated RatsOpen-Field TestAs displayed in Fig. 1, the results of the open-field test revealed that MSG affected the decision-making behavior in rats due to delayed latency (6.4-fold (F(6,35) = 140.3, p < 0.0001)) (Fig. 1A) with a substantial drop in the ambulation(Fig. 1B) and grooming (Fig. 1C) frequencies (by 48.8% (F(6,35) = 173, p < 0.0001), and 73.6% (F(6,35) = 131.9, p < 0.0001), respectively), compared to the control group. In contrast, co-treatment of MSG-intoxicated rats with PHA, SE, AST, (SE + AST), or COMB meaningfully lessened latency time (by 28.9%, 51.1%, 55.6%, 71.1% and 84.4%, respectively), compared to MSG group (Fig. 1A). Regarding ambulation frequency, it was remarkably raised in (PHA + MSG), (SE + MSG), (AST + MSG), (SE + AST + MSG), and (COMB + MSG) groups (1.2-fold, 1.5-fold, 1.6-fold, 1.7-fold, and 1.9-fold, respectively) versus MSG group (Fig. 1B). Concerning grooming frequency, it was prominently elevated in (PHA + MSG), (SE + MSG), (AST + MSG), (SE + AST + MSG), and (COMB + MSG) groups (1.2-fold, 1.4-fold, 1.5-fold, 1.6-fold, and 1.7-fold, respectively) compared to MSG group (Fig. 1C). Of note, the co-administration of a combination of PHA and SE with AST restored the latency time in addition to ambulation and grooming frequencies back to normal values.
Fig. 1
Effects of SE, AST and PHA on MSG-induced behavioral changes in (A) Latency Time, (B) Ambulation Frequency and (C) Grooming Frequency in open-field test and (D) Spontaneous alteration percentage in Y-maze test. The data are presented as means ± S.E.M (n = 6). Significance (a): relative to the control group, (b): relative to MSG group, (c): relative to PHA + MSG, (d): relative to SE + MSG, (e): relative to AST + MSG, and (f): relative to SE + AST + MSG. P-value < 0.05. Monosodium glutamate (MSG); Physical activity (PHA); Sesamol (SE); Astaxanthin (AST); COMB (SE + AST + PHA); Spontaneous alteration percentage (SAP)
Y-Maze TestMSG induced a marked reduction of spontaneous alternation percentage (SAP) (by 43.1% (F(6,35) = 434.7, p < 0.0001)), compared to the control group (Fig. 1D). However, SAP was pronouncedly upsurged in (PHA + MSG), (SE + MSG), (AST + MSG), (SE + AST + MSG), and (COMB + MSG) groups (1.2-fold, 1.4-fold, 1.55-fold, 1.6-fold, and 1.7-fold, respectively) versus MSG group (Fig. 1D). Remarkably, co-administration of a combination of PHA and SE with AST elevated SAP to be as near as normal values (Fig. 1D).
Combination of SE and AST with PHA Alleviates MSG-Induced Changes in Monoamine Neurotransmitters and Glutamate Content in the BrainAs illustrated in Fig. 2, the brain monoamine levels (DA, NE and 5-HT) were remarkably diminished upon MSG administration (by 70.3% (F(6,35) = 1025, p < 0.0001) (Fig. 2A), 53.4% (F(6,35) = 4596, p < 0.0001) (Fig. 2B), and 70.9% (F(6,35) = 917.9, p < 0.0001) (Fig. 2C), respectively), while brain glutamate content was noticeably increased (23.2-fold (F(6,35) = 2118, p < 0.0001)) (Fig. 2D), relative to the control group. Contrariwise, exposure to PHA, or administration of either SE, or AST elicited a prominent elevation in DA (1.5-fold, 2.1-fold and 2.3- fold, respectively) (Fig. 2A), NE (1.3-fold, 1.5-fold and 1.6- fold, respectively) (Fig. 2B) and 5-HT (1.3-fold, 1.9-fold, and 2.1- fold, respectively) (Fig. 2C), while glutamate levels were considerably reduced (by 30.8%, 53.2%, and 58.1%, respectively) (Fig. 2D), compared to MSG group. When SE and AST were combined, the brain monoamines’ levels (DA, NE and 5-HT) were pronouncedly amplified (2.5-fold, 1.8-fold and 2.4-fold, respectively) (Fig. 2A, 2B and 2C), in addition to marked hampering in the glutamate level (by 69%) (Fig. 2D) as compared to MSG group. Interestingly, the combination of SE and AST along with PHA showed maximum protective effects by elevation of DA (2.8-fold) (Fig. 2A), NE (1.9-fold) (Fig. 2B), and 5-HT (2.8-fold) (Fig. 2C), together with a decrement in glutamate content (by 80.3%) (Fig. 2D) compared to MSG group.
Fig. 2
Effects of SE, AST and PHA on brain neurotransmitters in MSG-intoxicated rats: (A) DA, (B) NE, (C) 5-HT and (D) Glutamate. The data are presented as means ± S.E.M (n = 6). Significance (a): relative to the control group, (b): relative to MSG group, (c): relative to PHA + MSG, (d): relative to SE + MSG, (e): relative to AST + MSG, and (f): relative to SE + AST + MSG. P-value < 0.05. Monosodium glutamate (MSG); Physical activity (PHA); Sesamol (SE); Astaxanthin (AST); COMB (SE + AST + PHA); Dopamine (DA); Norepinephrine (NE) and Serotonin (5-HT)
Combination of SE and AST with PHA Mitigates Oxidative Stress Biomarkers in the Brain of MSG-Intoxicated RatsAs displayed in Fig. 3, MSG-intoxicated rats exhibited profound oxidative damage as evidenced by a noticeable increase in MDA brain content (16.7-fold (F(6,35) = 1052, p < 0.0001)) (Fig. 3A), coupled with a marked diminution in SOD activity(Fig. 3B) and TAC (Fig. 3C) level (by 84.8% (F(6,35) = 501, p < 0.0001) and 78.7% (F(6,35) = 1635, p < 0.0001), respectively in the brain tissue compared to the control group. On the other hand, (PHA + MSG), (SE + MSG), (AST + MSG), (SE + AST + MSG), and (COMB + MSG) groups demonstrated a substantial reduction in the brain MDA content (by 22.1%, 51.4%, 57.8%, 68.5% and 80.3%, respectively) (Fig. 3A), along with a marked elevation in SOD activities (2.4-fold, 3.6-fold, 3.9-fold, 4.7-fold and 5.4-fold, respectively) (Fig. 3B) and TAC levels (1.9-fold, 2.9-fold, 3.2-fold, 3.6-fold and 3.9-fold, respectively) (Fig. 3C) compared to MSG group. It is worth noting that, the combination of PHA, SE and AST presented the maximum effect in curbing oxidative stress and replenishing antioxidant defense compared to other treatment groups.
Fig. 3
Effects of SE, AST and PHA on brain oxidative stress biomarkers in MSG-intoxicated rats: (A) MDA, (B) SOD and (C) TAC. The data are presented as means ± S.E.M (n = 6). Significance (a): relative to the control group, (b): relative to MSG group, (c): relative to PHA + MSG, (d): relative to SE + MSG, (e): relative to AST + MSG, and (f): relative to SE + AST + MSG. P-value < 0.05. Monosodium glutamate (MSG); Physical activity (PHA); Sesamol (SE); Astaxanthin (AST); COMB (SE + AST + PHA); Malondialdehyde (MDA); Superoxide dismutase (SOD) and Total antioxidant capacity (TAC)
Combination of SE and AST with PHA Diminishes Neuroinflammatory Biomarkers in the Brain of MSG-Intoxicated RatsFigure 4 demonstrated that MSG administration revealed an exaggerated inflammatory response, as confirmed by striking increase of the pro-inflammatory cytokines (TNF-α, and IL-1β) levels in the brain tissues (9.9-fold (F(6,35) = 1457, p < 0.0001) (Fig. 4A) and 8.1-fold (F(6,35) = 2864, p < 0.0001) (Fig. 4B), respectively) compared to the control group. Inversely, (PHA + MSG), (SE + MSG), (AST + MSG), (SE + AST + MSG) and (COMB + MSG) groups substantially diminished TNF-α (by 32.6%, 55.7%, 58.3%, 69.5% and 83.1%, respectively) (Fig. 4A), and IL-1β (by 22.3%, 41.5%, 52.7%, 66.5% and 83.4%, respectively) (Fig. 4B) versus MSG-intoxicated rats. Remarkably, the combination of PHA, SE with AST showed the most prominent anti-inflammatory effects compared to any other group in this study.
Fig. 4
Effects of SE, AST and PHA on brain neuroinflammatory biomarkers in MSG-intoxicated rats: (A) TNF-α and (B) IL-1β. The data are presented as means ± S.E.M (n = 6). Significance (a): relative to the control group, (b): relative to MSG group, (c): relative to PHA + MSG, (d): relative to SE + MSG, (e): relative to AST + MSG, and (f): relative to SE + AST + MSG. P-value < 0.05. Monosodium glutamate (MSG); Physical activity (PHA); Sesamol (SE); Astaxanthin (AST); COMB (SE + AST + PHA); Interleukin-1β (IL-1β) and Tumor necrosis factor-alpha (TNF-α)
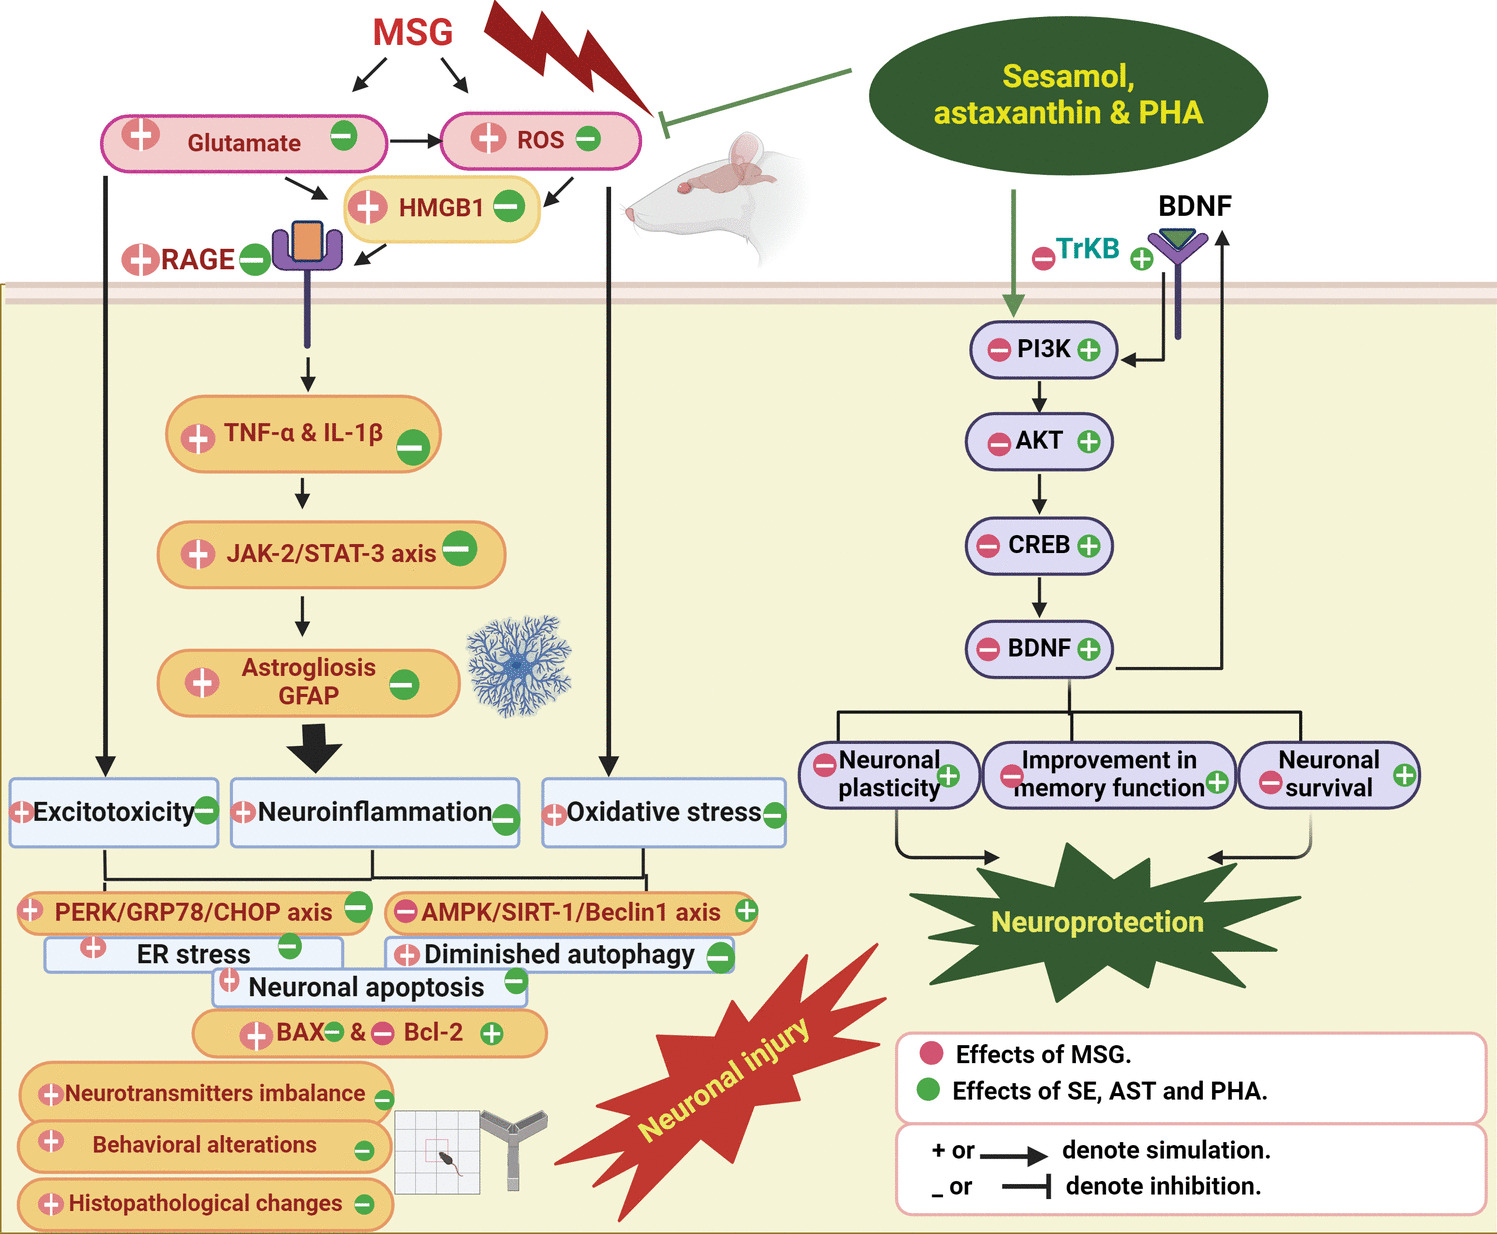
Combination of SE and AST with PHA Hinders HMGB1/RAGE and JAK-2/STAT-3 Signaling Pathways in MSG-Intoxicated RatsAs clarified in Fig. 5, MSG meaningfully upregulated HMGB1 (Fig. 5A), RAGE (Fig. 5B), JAK-2 (Fig. 5C) and STAT-3 (Fig. 5D) gene expression (10.2-fold (F(6,35) = 2038, p < 0.0001), 10.1-fold (F(6,35) = 2212, p < 0.0001), 9.9-fold (F(6,35) = 5696, p < 0.0001) and 9.8- fold (F(6,35) = 4128, p < 0.0001), respectively), compared to the control group. On the contrary, (PHA + MSG), (SE + MSG), (AST + MSG), (SE + AST + MSG) and (COMB + MSG) groups displayed extensive downregulation in the gene expression of HMGB1 (by 18.7%, 45.4%,49.5%, 60.7% and 80.2%, respectively) (Fig. 5A); RAGE (by 16.6%, 48.4%, 52.2%, 64.9% and 77.9%, respectively) (Fig. 5B); JAK-2 (by 17.5%, 44.4%, 49.7%, 67.4% and 80.7% respectively) (Fig. 5C) and STAT-3 (by 14.9%, 47.6%, 55.1%, 69.4% and 81.6% respectively) (Fig. 5D), relative to MSG-intoxicated rats. Hence, the combination of PHA, SE with AST exhibited the greatest inhibitory effect on HMGB1/RAGE and JAK-2/STAT-3 signaling pathways among other treated groups.
Fig. 5
Effects of SE, AST and PHA on HMGB1/RAGE and JAK-2/STAT-3 signaling pathways in MSG- intoxicated rats: (A) HMGB1, (B) RAGE, (C) JAK-2 and (D) STAT-3. The data are presented as means ± S.E.M (n = 6). Significance (a): relative to the control group, (b): relative to MSG group, (c): relative to PHA + MSG, (d): relative to SE + MSG, (e): relative to AST + MSG, and (f): relative to SE + AST + MSG. P-value < 0.05. Monosodium glutamate (MSG); Physical activity (PHA); Sesamol (SE); Astaxanthin (AST); COMB (SE + AST + PHA); High mobility group box 1 (HMGB1); Receptor for Advanced Glycation End Products (RAGE); Janus kinase-2 (JAK-2) and Signal transducer and activator of transcription-3 (STAT-3)
Combination of SE and AST with PHA Enhances AMPK/SIRT-1 and CREB/BDNF/TrkB Signaling Pathway in MSG-Intoxicated RatsAs illustrated in Fig. 6, MSG induced a sharp decrement in the gene expression levels of AMPK (Fig. 6A), SIRT-1(Fig. 6B), TrkB (Fig. 6D) and CREB (Fig. 6E) (by 92.9% (F(6,35) = 624.4, p < 0.0001), 84.6% (F(6,35) = 1517, p < 0.0001), 85.2% (F(6,35) = 1205, p < 0.0001) and 80.2% (F(6,35) = 435.8, p < 0.0001), respectively), in addition to BDNF level (by 65.2% (F(6,35) = 695.4, p < 0.0001)) (Fig. 6C), compared to the control group. In contrast, (PHA + MSG), (SE + MSG), (AST + MSG) (SE + AST + MSG), and (COMB + MSG) groups prominently upregulated the gene expression levels of AMPK (6.8-fold, 8.5-fold, 10.8-fold, 12.5-fold, and 12.8-fold, respectively) (Fig. 6A); SIRT-1 (threefold, 3.7-fold, 4.3-fold, 5.3-fold, and sixfold, respectively) (Fig. 6B); TrkB (3.2-fold, 4.3-fold, 4.9-fold, 5.6-fold, and 6.1-fold, respectively) (Fig. 6D) and CREB (2.3-fold, 2.9-fold, 3.1-fold, 3.7-fold, and 4.4-fold, respectively) (Fig. 6E), together with, BDNF level (1.4-fold, twofold, twofold, 2.2-fold, and 2.4-fold, respectively) (Fig. 6C), compared to MSG group. Remarkably, the combination of PHA, SE with AST demonstrated the maximal favorable effects on AMPK/SIRT-1 and CREB/BDNF/TrkB pathways among other treated groups.
Fig. 6
Effects of SE, AST and PHA on AMPK/SIRT-1 and CREB/BDNF/TrkB signaling pathways in MSG-intoxicated rats: (A) AMPK, (B) SIRT-1, (C) BDNF, (D) TrkB and (E) CREB. The data are presented as means ± S.E.M (n = 6). Significance (a): relative to the control group, (b): relative to MSG group, (c): relative to PHA + MSG, (d): relative to SE + MSG, (e): relative to AST + MSG, and (f): relative to SE + AST + MSG. P-value < 0.05. Monosodium glutamate (MSG); Physical activity (PHA); Sesamol (SE); Astaxanthin (AST); COMB (SE + AST + PHA); AMP-enhanced protein kinase (AMPK); Sirtuin-1 (SIRT-1); Brain-derived neurotrophic factor (BDNF); Tropomyosin receptor kinase B (TrKB); Cyclic adenosine monophosphate (cAMP) response element-binding protein (CREB)
Combination of SE and AST with PHA Modulates PI3K/AKT and m-TOR/Beclin-1 Signaling Pathways in the Brain of MSG-Intoxicated RatsAs illustrated in Fig. 7, MSG induced a considerable downregulation in Beclin-1(Fig. 7A), PI3K (Fig. 7B) and AKT (Fig. 7C) gene expression (by 93.7% (F(6,35) = 1010, p < 0.0001), 84.1% (F(6,35) = 2265, p < 0.0001), and 85.8% (F(6,35) = 2381, p < 0.0001), respectively), together with upregulation of m-TOR (ninefold (F(6,35) = 205.3, p < 0.0001)) (Fig. 7D), as compared to the control group. On the other hand, (PHA + MSG), (SE + MSG), (AST + MSG), (SE + AST + MSG) and (COMB + MSG) groups both pronouncedly upregulated the gene expression levels of Beclin-1 (7.2-fold, 9.4-fold, 11.6-fold, 13.2-fold, and 15.1-fold, respectively) (Fig. 7A); PI3K (threefold, 3.6-fold, 4.6-fold, 5.2-fold, and 5.7-fold, respectively) (Fig. 7B) and AKT (3.3-fold, 3.5-fold, 4.4-fold, 5.1-fold and 5.8-fold, respectively) (Fig. 7C), and also markedly downregulated the gene expression of m-TOR (by 37.3%, 47.9%, 60.4%, 71.4% and 85.3%, respectively) (Fig. 7D), versus MSG control group. Notably, the combination of PHA, SE with AST achieved the maximum protective effect PI3K/AKT and m-TOR/Beclin-1 pathways, over any other treatments in this study, evidenced by keeping gene expression level of m-TOR as nearly as its level in the control group.
Fig. 7
Effects of SE, AST and PHA on PI3K/AKT and m-TOR/Beclin-1 signaling pathways in MSG-intoxicated rats: (A) Beclin-1, (B) PI3K, (C) AKT and (D) m-TOR. The data are presented as means ± S.E.M (n = 6). Significance (a): relative to the control group, (b): relative to MSG group, (c): relative to PHA + MSG, (d): relative to SE + MSG, (e): relative to AST + MSG, and (f): relative to SE + AST + MSG. P-value < 0.05. Monosodium glutamate (MSG); Physical activity (PHA); Sesamol (SE); Astaxanthin (AST); COMB (SE + AST + PHA); Phosphoinositide 3-kinase (PI3K); Protein kinase B (AKT); Mechanistic target of rapamycin (m-TOR)
Combination of SE and AST with PHA Modulates PERK/GRP78/CHOP and BAX/Bcl-2 Signaling Pathways in the Brain of MSG-Intoxicated RatsFigure 8 demonstrated that MSG exerted obvious upregulation in the gene expression of ER stress markers (PERK, GRP78, and CHOP), and apoptotic marker, BAX (ninefold (F(6,35) = 636.8, p < 0.0001) (Fig. 8 A), 9.6-fold (F(6,35) = 2070, p < 0.0001) (Fig. 8B), 9.8-fold (F(6,35) = 3681, p < 0.0001) (Fig. 8C), and 9.9-fold (F(6,35) = 5689, p < 0.0001) (Fig. 8D), respectively), along with marked downregulation in the gene expression of anti-apoptotic marker, Bcl-2 (by 68.6% (F(6,35) = 500.7, p < 0.0001)) (Fig. 8E), compared to the control group. Conversely, (PHA + MSG), (SE + MSG), (AST + MSG), (SE + AST + MSG) and (COMB + MSG) groups both obviously downregulated the gene expression levels of PERK (by 27.7%, 51.8%, 55.2%, 70.2% and 83.2%, respectively) (Fig. 8A); GRP78 (by 25.5%, 45.3%, 49.8%, 62.5%, and 73.9%, respectively) (Fig. 8B); CHOP (by 17.8%, 40.3%, 46.6%, 56.7%, and 66.5%, respectively) (Fig. 8C), and BAX (by 17.5%, 44.4%, 49.7%, 67.4% and 80.7%, respectively) (Fig. 8D), and also strikingly upregulated the gene expression of Bcl-2 (1.7-fold, 2.2-fold, 2.4-fold, 2.7-fold, and 2.9-fold, respectively) (Fig. 8E), versus MSG group. Of note, the combination of PHA, SE with AST employed the maximum protective effect in PERK/GRP78/CHOP and BAX/Bcl-2 axes relative to any other treatment groups.
Fig. 8
Effects of SE, AST, and PHA on PERK/GRP78/CHOP and BAX/Bcl-2 signaling pathways in MSG-intoxicated rats: (A) PERK, (B) GRP78, (C) CHOP, (D) BAX and (E) Bcl-2. The data are presented as means ± S.E.M (n = 6). Significance (a): relative to the control group, (b): relative to MSG group, (c): relative to PHA + MSG, (d): relative to SE + MSG, (e): relative to AST + MSG, and (f): relative to SE + AST + MSG. P-value < 0.05. Monosodium glutamate (MSG); Physical activity (PHA); Sesamol (SE); Astaxanthin (AST); COMB (SE + AST + PHA); Protein kinase RNA-like ER kinase (PERK), Glucose-regulated protein 78 (GRP78), Pro-apoptotic C/EBP homologous protein (CHOP), Bcl-2-associated X protein (BAX), B-cell lymphoma 2 protein (Bcl-2)
Combination of SE and AST with PHA Improves MSG-Induced Histopathological Changes in Brain TissuesAs shown in Fig. 9, histopathological examination of the brain sections from MSG-intoxicated rats showed severe nuclear pyknosis in neurons (arrows) of the cerebral cortex, striatum, subiculum and substantia nigra (Fig. 9B1, B2, B4 and B5). Severe nuclear pyknosis in neurons (arrow) of fascia dentata with hemorrhage (arrowhead) (Fig. 9B3). PHA + MSG group showed severe nuclear pyknosis in neurons (arrows) of the cerebral cortex and substantia nigra (Fig. 9C1 and C5). In the same group, mild nuclear pyknosis in neurons (arrows) of the striatum and fascia dentata (Fig. 9C2 and C3) and moderate nuclear pyknosis in neurons (arrows) of the subiculum (Fig. 9C4) were noted. In SE + MSG group, brain sections displayed mild nuclear pyknosis in neurons (arrows) of the cerebral cortex, striatum, fascia dentate and subiculum (Fig. 9D1, D2, D3 and D4). In the same group, severe nuclear pyknosis in neurons (arrows) of the substantia nigra (Fig. 9D5) was noted. The cerebral cortex and substantia nigra from AST + MSG group presented mild nuclear pyknosis in neurons (arrows) (Fig. 9E1 and E5), whereas the striatum, fascia dentata, and subiculum (arrow) in this group elicited apparent normal histological structure (Fig. 9E2, E3 and E4). In SE + AST + MSG group, brain sections of the cerebral cortex, striatum, fascia dentata, subiculum and substantia nigra (Fig. 9F1, F2, F3, F4 and F5) showed apparent normal histological picture. Furthermore, Brain sections from the COMB + MSG group showed apparent normal histological structure of the cerebral cortex, striatum, fascia dentata, subiculum, and substantia nigra (Fig. 9G1, G2, G3, G4 and G5).
Fig. 9
Effects of SE, AST and PHA on MSG-induced histopathological changes in brain tissues. Represented photomicrographs of brain sections stained by Hematoxylin and Eosin (magnification 40 X) of Control (A), MSG (B), PHA + MSG (C), SE + MSG (D), AST + MSG (E), SE + AST + MSG (F) and SE + AST + PHA + MSG (G) groups, showed different histopathological alteration in the cerebral cortex, striatum, hippocampus (fascia dentate and subiculum) and substantia nigra. Monosodium glutamate (MSG); Physical activity (PHA); Sesamol (SE); Astaxanthin (AST); COMB (SE + AST + PHA)
Combination of SE and AST with PHA Lessens GFAP Expression in the Brain of MSG-Intoxicated RatsFigure 10. demonstrated that MSG administration revealed an exaggerated inflammatory response, as confirmed by an extensive upsurge in the expression of neuroinflammatory biomarker GFAP (36.4-fold (F(6,35) = 473.7, p < 0.0001)) (Fig. 10B), compared to the control group. Inversely, (PHA + MSG) (Fig. 10C), (SE + MSG) (Fig. 10D), (AST + MSG) (Fig. 10E), (SE + AST + MSG) (Fig. 10F), and (COMB + MSG) (Fig. 10G) groups noticeably diminished GFAP expression (by 35.5%, 53.1%, 65.9%, 87.7%, and 96.7%, respectively), versus MSG-intoxicated rats. Remarkably, the combination of PHA, SE with AST showed the maximum hampering of GFAP expression among treated groups in comparison to MSG-intoxicated rats by keeping the brain GFAP expression level as nearly as their levels in the control group.
Fig. 10
Effects of SE, AST and PHA on GFAP immunoexpression in the brain of MSG-intoxicated rats. Illustrative photomicrograph of immunohistochemical staining of GFAP-positive cells in the brain (arrows). Control group (A), MSG group (B), PHA + MSG group (C), SE + MSG group (D), AST + MSG group (E) SE + AST + MSG group (F), and COMB + MSG group (G) [× 200]. Bar chart represents the area % of GFAP staining in the different groups (H). Data are presented as mean ± S.E.M (n = 6). Significance (a): relative to the control group, (b): relative to MSG group, (c): relative to PHA + MSG, (d): relative to SE + MSG, (e): relative to AST + MSG, and (f): relative to SE + AST + MSG. P < 0.05. Monosodium glutamate (MSG); Physical activity (PHA); Sesamol (SE); Astaxanthin (AST); COMB (SE + AST + PHA); Glial fibrillary acidic protein (GFAP)
Comments (0)