
Remember me
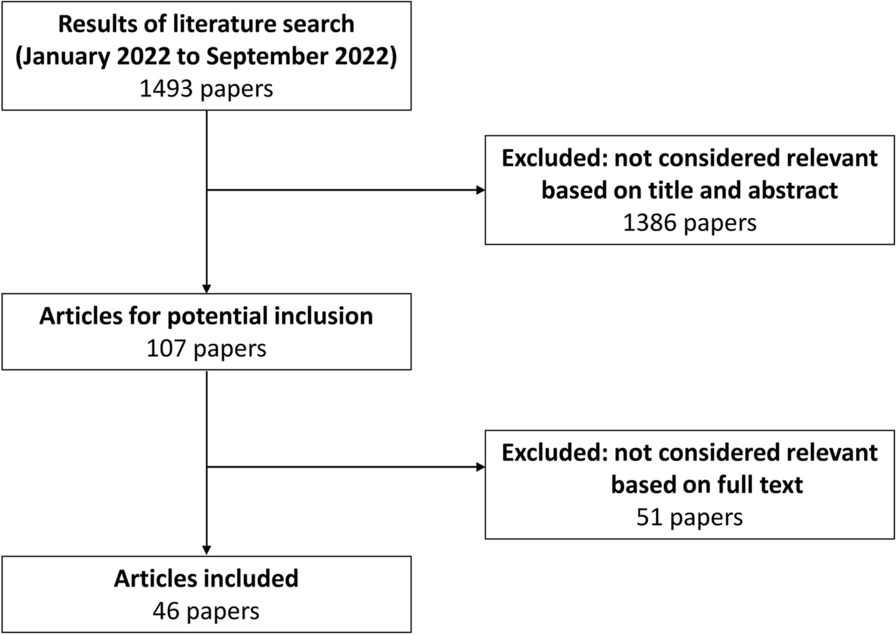


The study flowsheet is outlined in Fig. 1. From our systematic search, 525 records were identified with 490 records screened after removing duplicates. After exclusion of records that did not meet our inclusion or exclusion criteria, 23 full-text articles were assessed for eligibility. From the 23 articles, 13 full-text articles were excluded as they were non-randomized trials or studied pharmacologic agents other than ACEi or ARBs. The final analysis included 10 RCTs with 1049 patients assessed. The weighted follow-up period was 16.8 months. The RCTs were conducted in geographically diverse populations, including Italian [4, 5], Iranian [6], American [7], Dutch [8], Canadian [9], Norwegian [11], Greek [18], Polish [19], and Korean [20] patient populations. Common anthracyclines utilized included doxorubicin, epirubicin, and idarubicin. Six RCTs assessed ACEi [4, 6, 7, 9, 18, 19] and four RCTs assessed ARBs [5, 8, 11, 20]. Six RCTs solely assessed patients with breast cancer [7,8,9, 11, 19, 20] while one exclusively assessed patients with lymphoma [18], and three assessed a mix of malignancies [4,5,6]. A summary of the RCTs can be found in Table 1.
Fig. 1 Table 1 Summary of RCTs included in the meta-analysisBaseline Characteristics
A total of 1049 patients were assessed: 548 in the ACEi/ARBs group and 501 in the control group. Cumulatively, the average age was 43.2 years and 90% of the study population were female. Breast cancer (80%) and lymphomas (13%) were the most common malignancies. Mean baseline LVEF in the ACEi/ARBs group was 62.7 ± 5.13 compared to 63.1 ± 6.34 in the control group. Full details regarding the baseline characteristics of the population studied can be found in Table 2. Two [5, 20] of the ten RCTs had a high risk of bias with regards to allocation concealment and blinding of participants and personnel (Supplemental Fig. 1).
Table 2 Baseline characteristics of the study populationOutcomes and AnalysisThere was no statistically significant difference between the study groups with regards to the primary outcome of CTRC (16% vs 24%; RR 0.67, 95% confidence interval (CI) [0.31, 1.45], P = 0.31, I2 = 76%, high certainty) (Fig. 2). Similar results were obtained on sensitivity analyses excluding the RCT contributing the most to heterogeneity; (RR 0.86, 95% CI [0.44, 1.66], P = 0.65, I2 = 69%), excluding RCTs with high risk of bias; (RR 0.75, 95% CI [0.33, 1.72], P = 0.50, I2 = 78%), excluding RCTs with follow-up time < 12 months; (RR 0.78, 95% CI [0.36, 1.70], P = 0.53, I2 = 77%), and by including RCTs that solely assessed patients with breast cancer; (RR 0.71, 95% CI [0.43, 1.17], P = 0.18, I2 = 43%) (Supplemental Fig. 2). Subgroup analysis showed no interaction according to ACEi versus ARBs for occurrence of CTRC; PInteraction = 0.78 (Supplemental Fig. 3).
Fig. 2
Forest plot for the occurrence of cancer therapy-related cardiomyopathy among study groups
Regarding secondary outcomes, the ACEi/ARBs group had a favorable change in LVEF compared with control; SMD + 1.20%, 95% CI [0.40, 2.00], P = 0.003, I2 = 97%, low certainty (Fig. 3a). Additionally, patients on ACEi/ARBs had a favorable change in LVEDV (SMD − 0.36 mL, 95% CI [− 0.66, − 0.06], P = 0.02, I2 = 41%, moderate certainty) (Fig. 3b), and LVESV (SMD − 1.04 mL, 95% CI [− 1.79, − 0.29], P = 0.006, I2 = 89%, moderate certainty) (Fig. 3c). There was also a lower risk of arrhythmias in the ACEi/ARBs group compared to control; 1.6% vs 8.0%; RR 0.30, 95% CI [0.10, 0.94], P = 0.04, I2 = 0%, low certainty (Fig. 4a). On the other hand, there was no difference between the treatment and control group for all-cause mortality; 2.8% vs 3.2%; RR 0.82, 95% CI [0.26, 2.61], P = 0.74, I2 = 0%, high certainty (Fig. 4b) or heart failure; 1.2% vs 7.1%; RR 0.40, 95% CI [0.03, 4.54], P = 0.46, I2 = 64%, low certainty (Fig. 4c). The summary of findings table regarding the certainty assessment can be found in Supplemental Table 3.
Fig. 3
Forest plots for the absolute change in a left ventricular ejection fraction, b left ventricular end-diastolic volume, and c left ventricular end-systolic volume among study groups
Fig. 4
Forest plots for the risk of a arrhythmias, b all-cause mortality, and c heart failure among study groups
Trial sequential analysis was conducted for the primary outcome of CTRC using random effects model. The required information size (RIS) was calculated on the basis of an estimated incidence in the control group of 46%. A relative risk reduction of 21% was evaluated using an alpha value of 5% and power of 80%. Given the heterogeneity in the primary outcome, diversity adjustment was used for the RIS. The cumulative Z-score curve suggested a potential benefit with ACEi/ARBs, as well as a benefit for further RCTs (Supplementary Fig. 4).
Comments (0)