The necessity of biomarkers for SMA
Objective molecular biomarkers are needed to determine the therapeutic efficiency of SMA, regardless of changes in growth or pathological conditions. Multi-omics analysis, such as proteome and transcriptome analysis, has progressed in recent years, leading to the identification of several potential biomarkers.
Among them, subunits of neurofilament (NF), such as neurofilament light chain (Nf-L) or phosphorylated neurofilament heavy chain (pNf-H), have shown promise in evaluating the degree of neurodegeneration, inflammation, and demyelination in the SMA. Several meta-analyses have shown that Nf-L is significantly elevated in several neurodegenerative diseases, including Charcot-Marie-Tooth disease, Guillain–Barre syndrome, Parkinson disease, and multiple sclerosis [20, 21]. In infants with type I SMA under the age of 18 months, plasma pNf-H was significantly higher than in non-SMA infants of the same age, and a 70% decrease was observed at two months with nusinersen administration [22]. In addition, Nf-L levels decreased in 12 children with type I SMA after receiving five or more doses of nusinersen [23]. However, in type II and type III patients or in adolescents and adults with SMA, neither pNf-H nor Nf-L was affected by nusinersen [24,25,26,27,28]. Therefore, NF may be applicable as a biomarker only in partial patients with SMA.
On the other hand, SMN has also been proposed as a biomarker through various quantitative analyses such as Enzyme-linked immunosorbent assay (ELISA) [29, 30], Homogeneous time resolved fluorescence (HTRF) [31], and Electrochemiluminescence (ECL) [32, 33]. However, even if SMN are quantified in whole PBMCs, it may be difficult to evaluate them as sensitive biomarkers because PBMCs are constructed from heterogeneous cell populations with different SMN expression levels. In a previous report [13], we mentioned that SMN spot analysis would detect the intranuclear aggregation of SMN proteins and their association with other functional molecules. Our previous report suggested that it may be an effective biomarker for SMA, regardless of age or severity. However, it is important to note that CD33++ cells are the lymphocyte fraction and not nerve cells. While orally administered risdiplam affects SMN expression in peripheral blood [34], nusinersen and the onasemnogene abeparvovec selectively induce SMN expression in the spinal cord or neural cells. Therefore, when performing peripheral blood analysis, the relationship between the target organs and the pharmacokinetics of these drugs must be considered.
Validity of SMN spot analysis
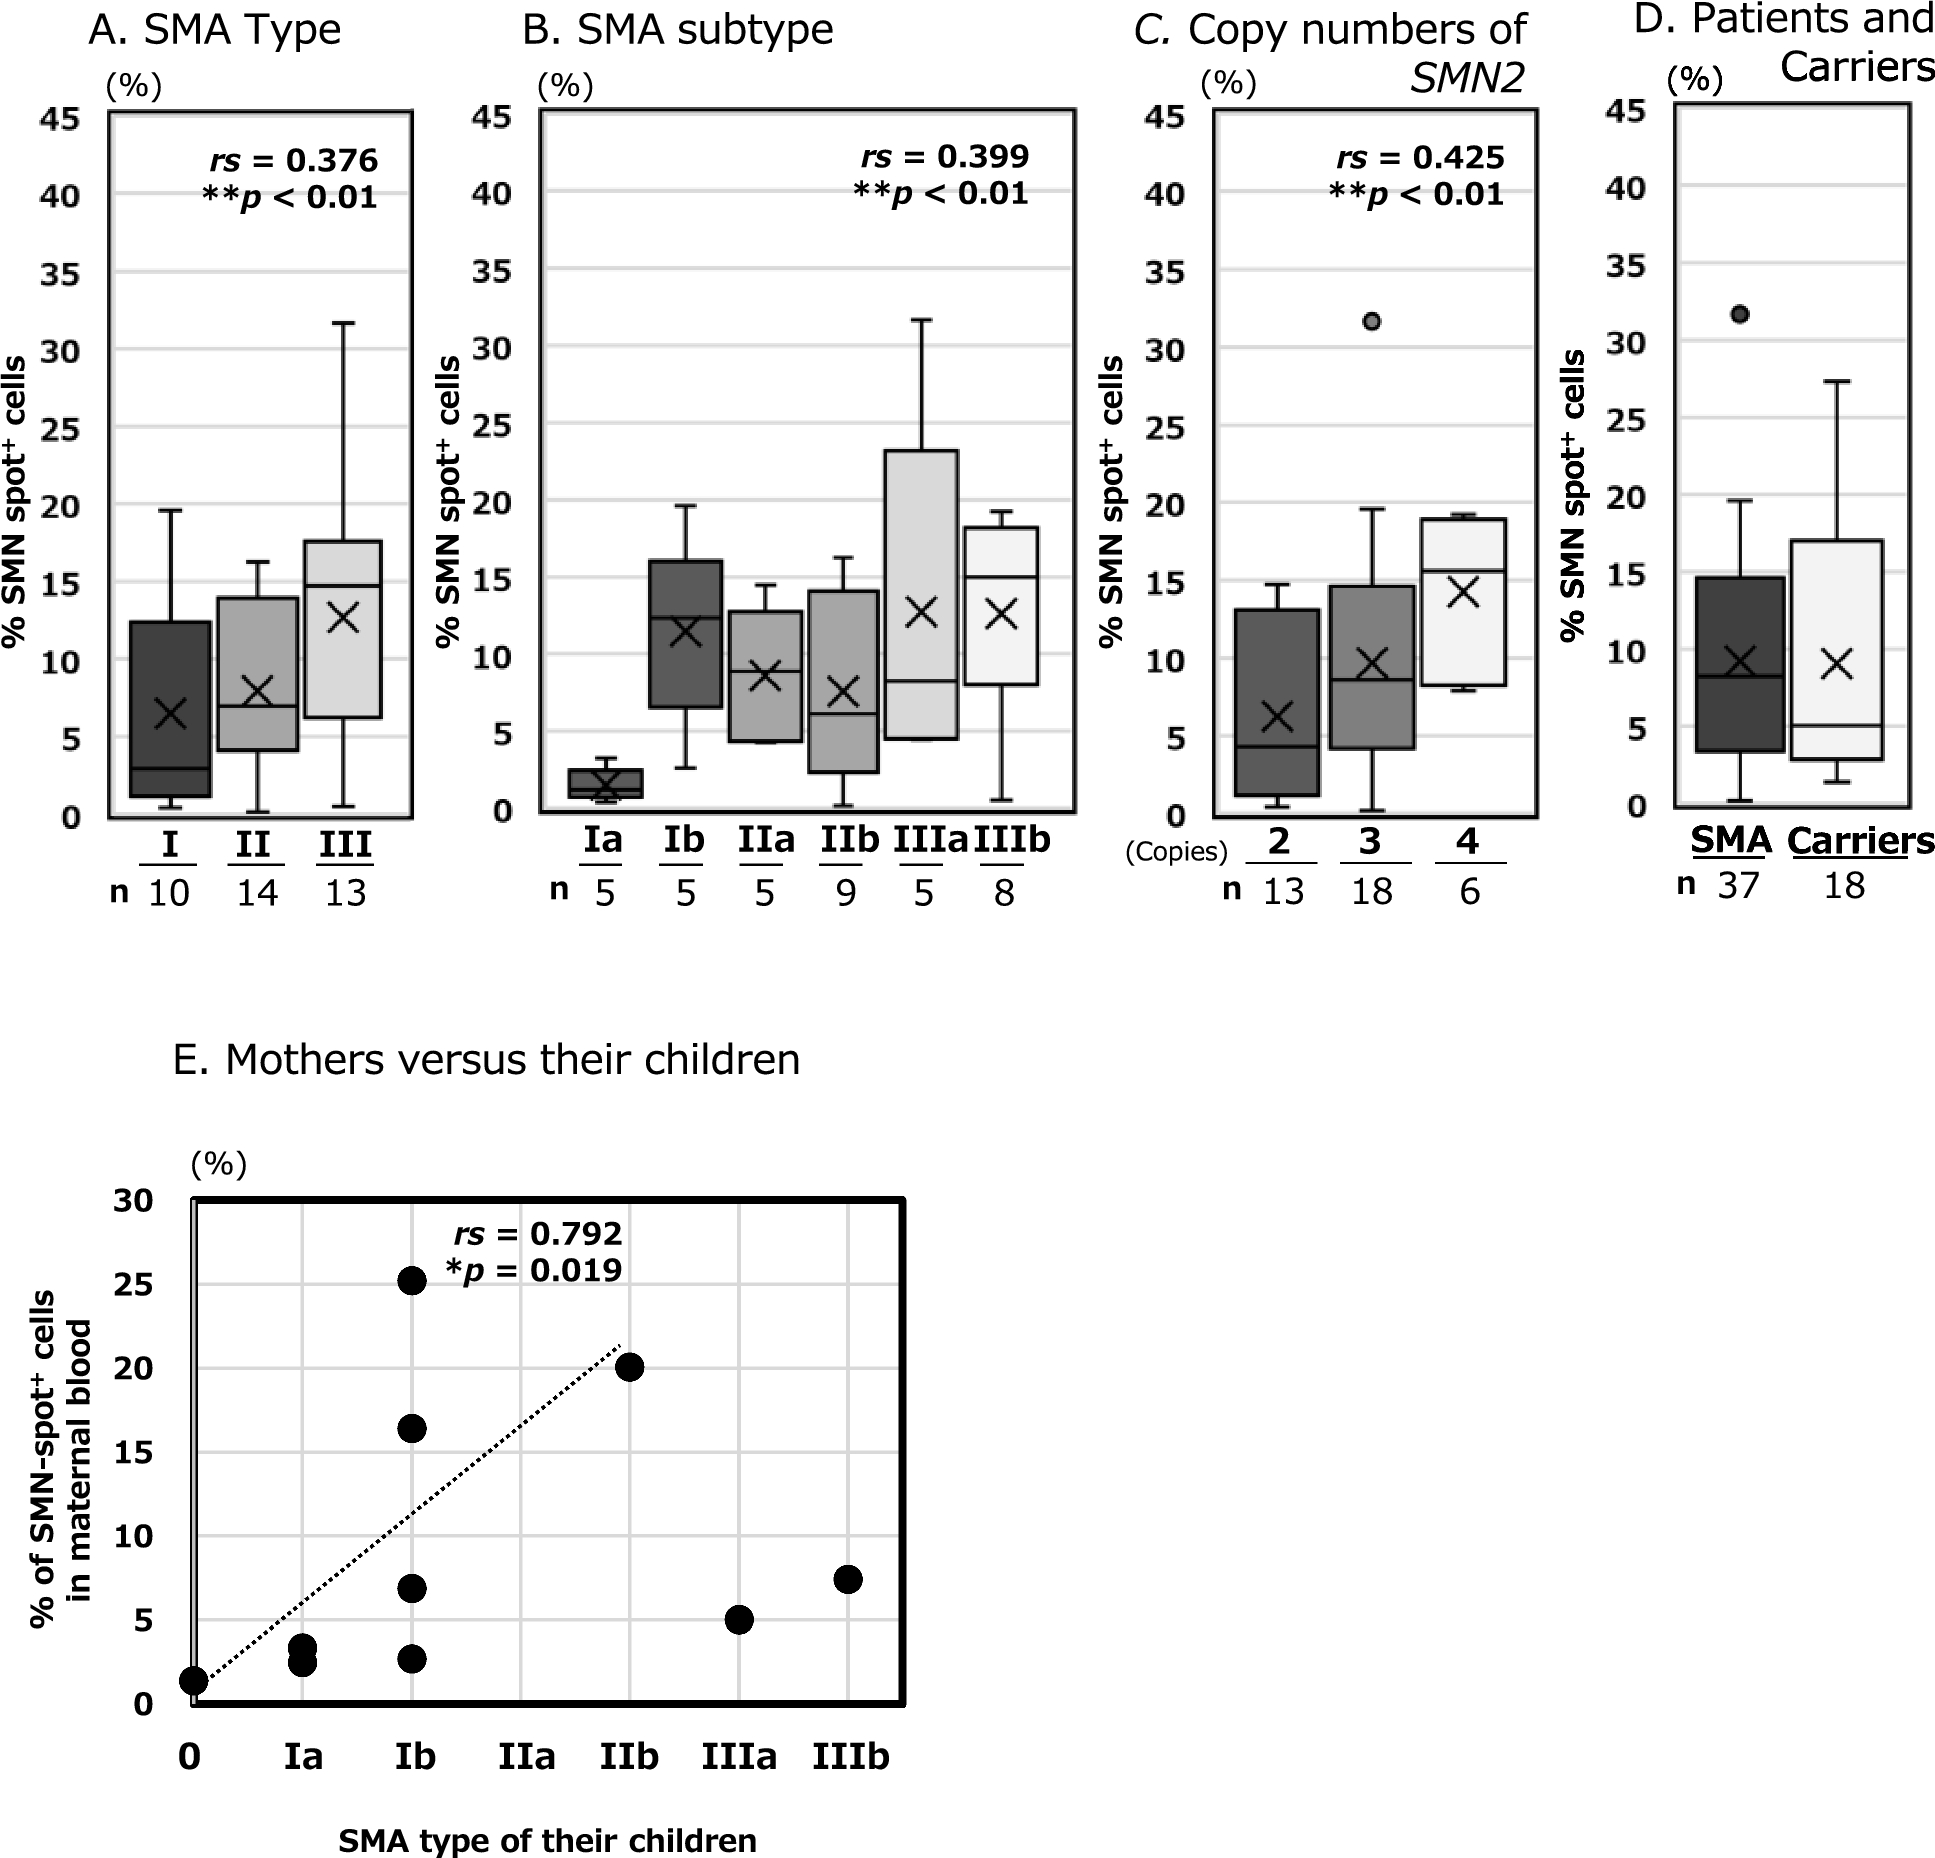
In a previous report, we demonstrated that SMN spot analysis can reveal the aggregation of SMN proteins in the cell nucleus, as well as their association with functional molecules. In other words, we conclude that the significance of SMN spot analysis is not simply to compare the amount of SMN protein but also to monitor functional SMN expression. Prior to the umbilical cord blood study, we analysed 37 patients with SMA before DMT administration to demonstrate its reliability as a biomarker for the pathological condition of SMA (Fig. 1A–C). Spearman's rank correlation analysis showed that SMN spot analysis had a slightly stronger correlation with the SMN2 copy number (rs > 0.4) than with the clinical classification of SMA (types I–III and Ia–IIIb, rs > 0.3). The Jonckheere-Terpstra analysis showed a similar increase, with significant differences (**p < 0.01, *p < 0.05). Although the clinical classification of SMA may be affected by the patient's living and medical environments until the confirm diagnosis, the SMN2 copy number remains constant. In addition, the SMN2 copy number often plays a role in determining SMN protein expression in patients. That may be why the SMN2 copy number was slightly more correlated with SMN protein levels than the clinical classifications.
SMN spot analysis value between carriers and patients
Analysis values for the carrier and patient groups were compared. In vitro experiments using a fibroblast cell line showed significant differences in SMN production of cultured cells or exosomes derived from the patient, carrier, and control [35]. However, the quantification of SMN in PBMC by ELISA showed no significant differences between the carrier and patient groups [30]. The latter authors attributed their results to two factors. Firstly, eight of the twelve cases in the patient group were children under four years old, while all 15 cases in the carrier group were adults between 25 and 57 years old. Second, four of the twelve patients were taking the histone deacetylase (HDAC) inhibitor valproic acid for the clinical trial, which may have increased SMN production. In 2022, a method was developed to evaluate SMN mRNA in PBMCs, using quantitative fluorescence real-time PCR (QF-RT-PCR) as a biomarker [36]. Their method calculated the percentage of FL-SMN transcripts among all SMN-related transcripts, rather than quantifying SMN expression. Significant differences were observed between the patient, carrier, and control groups.
In our SMN spot analysis, the carrier group showed significantly lower levels than the control group, although they were not patients. And we did not observe any significant differences between the carrier and patient group. The analysis values for the carrier group varied widely, ranging from 1.4 to 27.3% (Additional file 4AB), similar to those of the patient group ranging from 0.2 to 31.7% (Additional file 3C). The reasons for this are discussed below:
In this study, we did not investigate the copy numbers of SMN1 and SMN2 in the carriers. According to previous studies, 90% of the carriers are heterozygous for one copy of SMN1 [37]. Owing to SMN1 heterozygosity, carriers may tend to have lower systemic SMN expression, which may be reflected in the analytical values. For instance, in Glanzmann thrombasthenia, an autosomal recessive genetic disease, asymptomatic carriers who are heterozygous for the causative gene (ITGA2B or ITGB3) tend to have a lower expression of integrin glycoprotein IIb-IIIa on the platelet surface than those in the control group [38].
Another factor to consider is the presence of SMN1 and SMN2 variants. There are many variants of SMN2, 16 of which have been reported to positively or negatively modulate exon 7 splicing, even if they range from intron 6 to exon 8 [39]. Additionally, more than 80 variants have been reported for SMN1, and changes in SMN protein expression and function due to changes in functional sites such as the Tudor and C-terminal domains have been demonstrated [40]. Conformational changes can promote non-aggregation or disassembly of SMN, which can affect the results of our SMN spot analysis.
In our SMN spot analysis, all 18 participants in the carrier group were adults (32–48 years), whereas the 37 participants in the patient group included 17 adults (16–62 years) and 20 children (< 16 years). Although the composition of the patient group differed from that reported by Kobayashi et al., no significant differences were observed, similar to their report. On the other hand, an important aspect of QF-RT-PCR is to focus on the differences in the copy numbers of SMN1 and SMN2 in three groups: control, carrier, and patient, and to compare the production ratios of FL-SMN among the total SMN transcripts, including variants [36]. Their approach is similar to ours in that it involves a comparison of the functional ratio of total expression rather than a simple quantitative comparison. In their analysis, each group consisted of 31–44 participants; thus, we need to analyse more carriers.
To better understand the variability among carriers, we examined the relationship between the mother's analysis value and the SMA type of each child (see Fig. 1E, Additional file 4). Although it has not yet been firmly established, our unpublished data indicates a trend toward a decrease in SMN spot expression over approximately age 40 (data not shown). Excluding the two cases involving mothers over 40, the analysis of the eight mothers under 40 years old revealed a partial correlation between their analysis value and the severity of SMA in their children. This suggests that the analysis values from carrier mothers may indicate the severity of SMA in their children, or may vary based on the mother's age.
Analysis of SMN expression correlation between foetuses and mothers
We discussed the correlation between SMN spot analysis in maternal peripheral blood and neonatal umbilical cord blood (Fig. 3). According to Spearman's rank correlation coefficient, the theoretical critical value for rejecting the null hypothesis with a sample size of five cases was rs = 1.00 (p < 0.05) [41]. The result shown in Fig. 3 was rs = 1.00 (p = 0.017), indicating a correlation between neonatal and maternal data. However, owing to the limited number of cases, only five pairs were analysed in this study. This article presents the results of the Z-score by participant group affiliation. The results are presented as SD to aid understanding, but the Robust Z-Score using the normalised interquartile range (NIQR, see Additional file 3) yields similar results. As in the statistical analysis presented above, the theoretical critical value for rejecting the null hypothesis with a sample size of eight cases is rs = 0.738 (p < 0.05) [41]. For the group of eight mothers under age 40, as indicated in Fig. 1E, was rs = 0.792 (p = 0.019), which meets the significance level. In this study, we could only detect a partial correlation for severe cases, excluding SMA type III, taking into account maternal age. Meanwhile, the current target of prenatal diagnosis is severe cases of SMA types 0 through II. Our results imply two possibilities for rapid therapeutic intervention: 1) the severity of SMA after birth can be predicted through the analysis of maternal peripheral blood, and 2) inducing maternal SMN expression could serve as an effective treatment strategy for the foetus. A larger sample size than that analysed in this study is necessary to confirm these findings.
SMN dynamics during the foetal period
SMN expression is necessary during development, as smn deficient leads to embryonic lethality in mice [42]. In humans, the significance of paralogue of SMN1 is also understood, as no patients with SMA have been found with zero copies of SMN2 [43]. Studies have shown that SMN expression is increased during the embryonic and foetal stages in human tissues than during the postnatal period. However, obtaining sufficient spinal cord specimens from embryonic to postnatal stages is difficult, particularly in humans. Ramos et al.’s study in 2019 provided valuable insights into the quantification of SMN protein expression in the spinal and cerebral cortices of humans from 15 weeks of gestation to 14 years after birth [14]. The study showed that the period with the highest protein expression level was during the foetal period, specifically from the 15th to the 39th weeks of gestation, in 25 cases. The protein expression level decreased by half in 19 cases from birth to 3-month-old, and in 21 cases after 3-month-old, it decreased to approximately one-seventh of the foetal period. These findings suggest that the expression of the SMN protein is crucial during a limited period from 15 weeks of gestation to approximately 3 months after birth.
Here, we considered SMN dynamics during the embryonic period. Interestingly, even in defective SMN1, the foetus continued to grow and was born without any SMA symptoms. We considered the possibility that SMN is supplied to the foetus through both foetal own SMN2 and maternal blood via the placenta. This was based on the correlation between the mother and neonate, as shown in Fig. 3.
Small molecules with a molecular weight of 1000 Da or less (usually between 300 and 600 Da) can pass from the mother to the foetus through the placenta. SMN has a molecular weight of 39 kDa, and there have been no reports of it crossing the placenta. However, recent studies have revealed that cell movement between the mother and foetus is necessary during the ontogenetic stages. Maternal microchimeric cells (MMc), in which maternal cells migrate to the foetus, occur before fertilised eggs are implanted [44]. A report indicated that MMc-derived the specific nucleotide was detected in umbilical cord blood during the second trimester of pregnancy [45]. Migration of MMc was observed in the foetal brain before the blood–brain barrier (BBB) function was completed, suggesting that it is involved in the construction of neural circuits in the foetus [46]. Pregnancy is established between the mother and embryo through cell–cell contact and communication between extracellular vesicles (EVs) and other soluble factors [47]. The EV cargo protein has been identified that activates foetal trophoblast cells and enhances decidualisation and angiogenesis via endometrial EVs [48]. Because SMN has also been reported to be an EV cargo protein [35], we hypothesised that foetal growth could be supported by SMN supplementation via maternal cells or cell-derived factors during pregnancy.
The prospect of onset due to decreased SMN expression after birth
In general, even neonates with severe type I SMA do not show any clinical symptoms such as muscle weakness or hypotonia at birth. Usually, after one month of birth, infants become less active and their motor function are no longer out of synchronisation with their growth, which is considered to be the onset of SMA.
A study by Ramos et al. on the cerebrum and spinal cord of 75 non-SMA patients found that the mRNA expression frequency of FL-SMN1 and FL-SMN2 was the highest during the foetal period and decreased significantly after birth, similar to SMN production at the protein level. Specifically, FL-SMN1 expression begins to decrease three months after birth, whereas FL-SMN2 expression decreases significantly immediately after birth [14]. Infants with only SMN2 will experience faster SMN loss. None of the five neonates in Case 1–5 developed SMA at birth, suggesting that even with zero copies of SMN1 exons 7 and 8, the necessary quality and quantity of SMN protein was supplied during the foetal period.
The SMN spot analysis values decreased as the days passed in Case 3 and 5, which showed high values in the cord blood at birth. However, Cases 1, 2, and 4, whose values were already low at birth, exhibited no obvious decrease over time. The SMN spot analysis value in the peripheral blood of infants with SMA is expected to decrease gradually after birth. In other words, SMN protein levels decrease over time after birth and are eventually depleted in the spinal cord, leading to the onset of SMA.
Case 3 and 5 with high values in cord blood were females, and Cases 1, 2, and 4 with low values in cord blood were males (Table 1). Although we did not examine sex-specific protective modifiers like plastin 3 (PLS3) in this study, the results are intriguing [49, 50].
Maternal-mediated foetal treatment strategies
In animal models, therapeutic strategies via the maternal blood for foetuses with the SMA have been developed. Non-surgical interventions in the foetus include oral administration of HDAC inhibitors to the mother [51, 52] and incorporation of low-molecular-weight SMN2 splicing modifiers into the mother's feed [53]. These treatments have been found to prevent foetal lethality and extend survival after birth in severe SMA models.
When administering SMN (39KDa) to the foetus via the mother, the problem is that the molecular weight is large. This may be overcome by synthesizing a fusion protein, which is a human IgG Fc domain binding SMN protein, similar to blood coagulation factor VIII Fc (200–350KDa) [54]. The blood coagulation factor VIII Fc fusion protein could cross the placenta via neonatal Fc receptors (FcRn) expressed in the placenta [55]. Alternatively, low-molecular-weight SMN modifiers such as the already approved risdiplam can be administered (401 Da), which may cross the placenta and induce FL-SMN2 expression.
Based on our results of starting DMT at approximately 40 weeks (37–41 weeks) of planned full-term birth, inducing SMN expression in the foetus via the mother may be beneficial even late in pregnancy. This timeline ensures the safety and efficacy of the mother and foetus.
We conducted a study on five cases of presymptomatic SMA for which a treatment plan was established prenatally with the goal of a full-term planned birth at approximately 40 weeks. Without prompt initiation of DMT, each of the five presymptomatic neonates would have followed a similar history of severe SMA in the firstborns [56]. Several discoveries have been made by analysing SMN spots in the blood of mothers and neonates, particularly in umbilical cord blood. In cases in which severe SMA is anticipated in the foetus, planned delivery offers would control the onset of SMA through rapid DMT intervention. Elucidation of SMN dynamics in mothers and foetuses will further clarify the basis of strategic treatment planning. Furthermore, in addition to the analysis of umbilical cord blood, continuous analysis of peripheral blood after birth enabled us to understand the gradual progression of SMA development. Our demonstration has also highlighted the practical importance of newborn screening for SMA. Then, it is crucial to obtain a definitive diagnosis resulting from genetic testing as soon as possible after screening and to link the diagnosis to DMT intervention quickly.


Comments (0)