The study protocol received approval from the institutional review board at Sassari University Hospital (Azienda Ospedaliero-Universitaria, Sassari, Italy; IRB number 291123). Written informed consent was obtained from all participants.
Samples
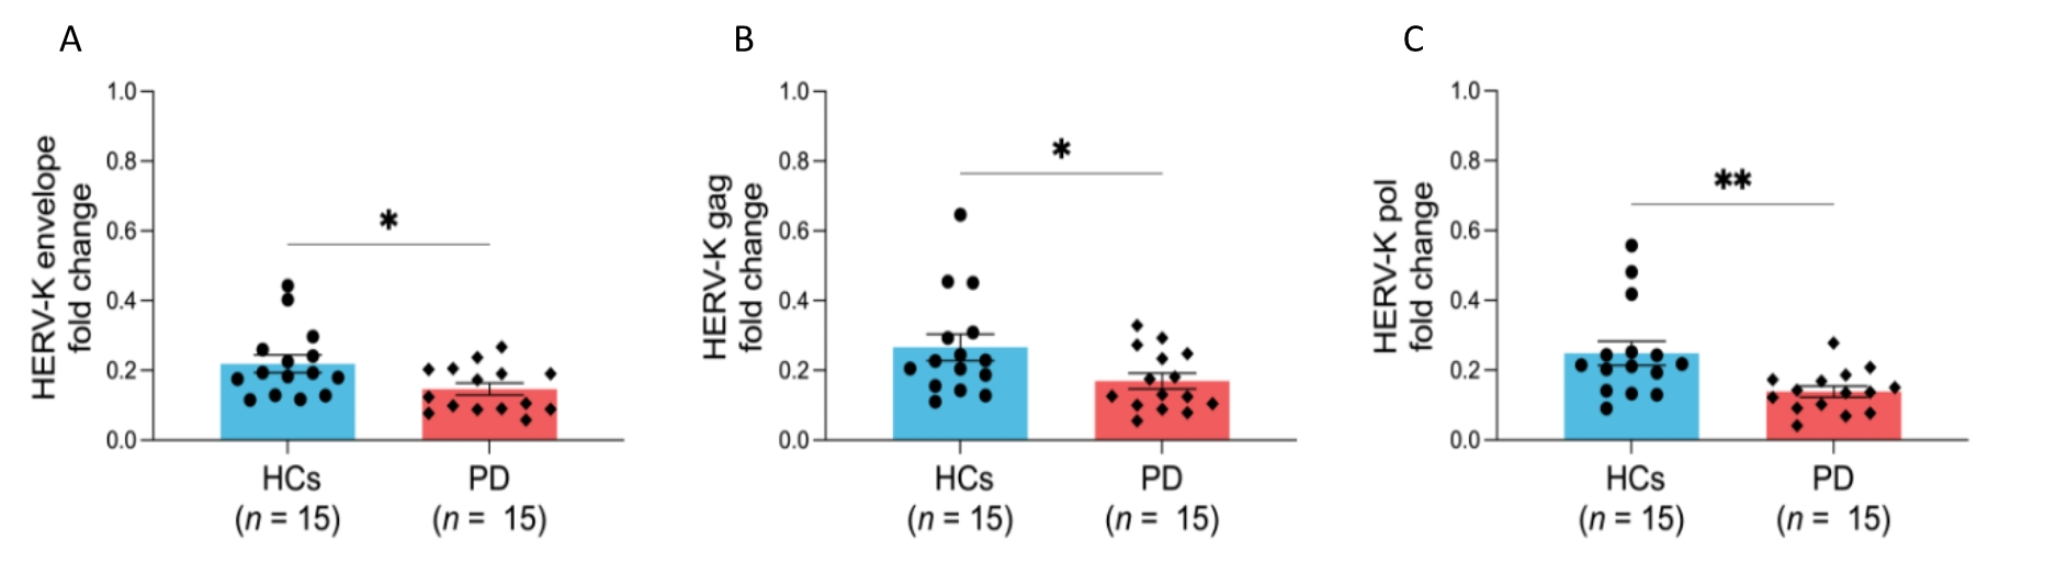
Whole blood samples were collected from patients diagnosed with PD and from blood donors in optimal health conditions. A total of 15 PD patients were recruited between January and October 2021 (6 females and 9 males; median age = 61 years) from the Neurorehabilitation Service, Azienda Ospedaliera Universitaria.
Fifteen blood donor samples were collected throughout the year 2021 at the Blood Transfusion Centre of Sassari (6 females and 9 males; median age = 63.5 years).
Blood samples collection
Peripheral venous blood samples were obtained from the participants using K2-EDTA tubes. The collected whole blood was layered over an equal volume of Ficoll (Sigma-Aldrich, St. Louis, MO, USA) in a 15 mL tube and centrifuged for 20 min at 1800 RPM without brake. The peripheral blood mononuclear cells (PBMCs) were collected and stored at -80 °C in FBS with 10% DMSO for miRNA extraction.
Identification of miRNAs able to bind HERV-K consensus sequence
The identification of microRNAs capable of binding to the consensus sequence of HERV-K [26] was performed using the online software miRDB. MiRDB is an online database designed for predicting miRNA targets and providing functional annotations. The targets within miRDB are predicted using a bioinformatics tool called MirTarget, which has been developed by analyzing thousands of miRNA-target interactions obtained from high-throughput sequencing experiments. Machine learning techniques have been employed using identified common features associated with miRNA binding and target downregulation to predict miRNA targets. Table 1 displays the list of selected miRNAs.
Table 1 Primers sequences. Table 1 shows the primer sequences used in the study, miRNAs marked with an asterisk (*) are those found to be upregulated in our studyRNA isolation and RT-qPCR analysis
Total RNA from PBMCs was purified using the miRNeasy Mini Kit (QIAGEN, Milano, Italy) following the manufacturer’s instructions and treated with DNase to remove DNA contamination with the Turbo DNA-free kit (Thermofisher), following the manufacturer’s instructions. Then, the RNA concentration was measured with the Nanodrop (Thermofisher) and all the samples were adjusted to the same concentration. First-strand cDNA synthesis was performed using QuantiTect Reverse Transcription Kit (QIAGEN, Milano, Italy). No-RT (no Reverse Transcriptase) for each sample and no-TC (no Template Control) controls were made to check for DNA and reagent contamination, respectively. Subsequently, samples were analyzed by Real-Time-PCR using Quantinova SYBR Green PCR kit (QIAGEN, Milano, Italy), following the manufacturer’s instructions.
The relative mRNA expression levels were calculated by the 2−∆∆Ct method and HPRT1 mRNA levels were used for normalization. Gene-specific primer pairs are listed in Table S1.
miRNA isolation and RT-qPCR analysis
miRNAs from PBMCs were purified using the miRNeasy Mini Kit (QIAGEN, Milano, Italy) and treated with DNAse to remove DNA contamination with the Turbo DNA-free kit (Thermofisher), following the manufacturer’s instructions. Then, the RNA concentration was measured with Nanodrop (Thermofisher) and all the samples were adjusted to the same concentration. miRNAs were reverse transcribed using miRCURY LNA RT Kit (QIAGEN, Milano, Italy). No-RT (no Reverse Transcriptase) for each sample and no-TC (no Template Control) controls were made to check for DNA and reagent contamination, respectively. Subsequently, samples were analyzed by Real-Time-PCR using miRCURY LNA SYBR Green PCR Kit (QIAGEN, Milano, Italy) following the manufacturer’s instructions. Relative levels of miRNAs were calculated by the 2−∆∆Ct method and the average of the reference genes, snRNA-U6, and miR-103a-3p expression levels were used for normalization. Gene-specific primer pairs are listed in Table S1.
Statistical analysis
Data was analyzed with GraphPad Prism version 8 (GraphPad). The Kolmogorov-Smirnov test of normality was applied to all data sets to determine whether a data set was normally distributed. Differences between means were assessed by unpaired two-sided Student’s t-test followed by Dunnett’s post-hoc testing. For the comparison of groups that did not demonstrate normal distribution or were heteroscedastic, the non-parametric tests Mann-Whitney with correction for multiple comparisons were used. Values in graphs are expressed as mean ± standard error mean (SEM) for parametric comparisons and as median with interquartile range (IQR) for non-parametric tests. The correlation of two variables was assessed by the Spearman R test. Statistical significance was achieved when p-value < 0.05.


Comments (0)