
Remember me


With the growing number of adult patients seeking orthodontic treatment, the demand for more esthetic orthodontic appliances is also on the rise.[1] Clear aligners were introduced in response to this growing demand, and due to their acceptable treatment results, they have been well accepted as an alternative to fixed orthodontic appliances for the treatment of mild-to-moderate malocclusions.[2] Clear aligners have advantages such as easier oral hygiene practice, preservation of periodontal health, lower incidence of root resorption, and resolution of pains related to temporomandibular disorders.[3-5] Noticeable advances in designing and application of attachments, the possibility of using skeletal anchorage, and the application of specific biomaterials in the composition of aligners have all improved the performance of aligners, enabling the fixing of a wider range of malocclusions with clear aligners.[2,6,7]
Despite numerous advances in treatment with aligners, they still have limitations in achieving some dental movements such as extrusion, correction of severe rotations, uprighting of molar teeth, tooth extraction space closure, and torque application.[1,8] A systematic review by Rossini et al.[9] demonstrated that the most difficult dental movement to achieve by aligners was extrusion with 30% accuracy, while distalization of maxillary molars was the most predictable movement with 88% accuracy. Leveling and alignment of teeth are also easily performed using aligners.[9] Recent studies revealed that clear aligners have poor performance in the correction of anteroposterior discrepancies and achieving optimal occlusal contacts.[1,10,11]
Several reasons have been proposed for the lower-than-expected efficacy of clear aligners for orthodontic tooth movement compared with fixed appliances, including material properties, material thickness, manufacturing process, the accuracy of fit of aligners on the teeth and attachments, and changes in material properties following intraoral exposure.[12-14] At present, thermoplastic resin polymers such as polyester, co-polyester, polycarbonate, polyurethane, and polypropylene are used for the fabrication of aligners due to their optimal properties.[15] Resin polymers used for the fabrication of aligners have a regular crystalline structure in an amorphous background. The crystalline/amorphous structure ratio affects the mechanical and thermal properties of the aligners.[16] These materials enable the fabrication of aligners with optimal fit on dental casts through the thermoforming process. However, studies on aligners exposed to the oral environment or simulated conditions revealed changes in the original shape and structure of aligners following exposure. Thermal alterations, moisture, saliva enzymes, and elastic deformation can affect the properties and mechanical behavior of.[13,17,18] Increased stiffness has been particularly reported following intraoral exposure due to changes in the polymer crystalline structure of clear aligners.[19] Alterations in the structure and chemical functional groups of aligners can be studied by X-ray diffraction (XRD) and Fourier-transform infrared spectroscopy (FTIR).
The hardness of aligners can also affect their load application properties. Evidence shows that the hardness of polymer materials depends on their residual monomer and thickness.[20] The correlation between the thickness and hardness of aligners indicates the significance of their geometric properties, such as shape, thickness, and dimensions, in clinical practice. For instance, occlusal surface wear of aligners affects the duration and magnitude of load they apply to the teeth.[2]
Other influential factors on the properties of aligners include their fabrication process and the heat applied during thermoforming for shaping and adaptation of aligners to the printed casts. Thermoforming is defined as the application of pressure and heat (a specific temperature for a certain period of time) on the aligner by the manufacturer. The significant role of thermoforming in the reduction of mechanical and thermal properties of aligners has been previously confirmed.[2,14,21] Dalaie et al.[10] demonstrated that thermoforming decreased the flexural modulus, hardness, and glass transition temperature (Tg) of clear aligners.
A correct understanding of the changes in the chemical and mechanical structure of the aligners following their thermoforming and intraoral exposure is imperative for precise treatment planning and achieving ideal results. However, the role of these parameters in the efficacy of aligners has not been adequately investigated. Furthermore, the interaction effect of the manufacturing process and intraoral exposure on the chemical and physical properties of aligners has not been previously evaluated. Thus, this study aimed to assess the physical and chemical changes of clear aligners after thermoforming and intraoral exposure.
MATERIAL AND METHODSThis ex vivo study was conducted on clear aligners from two commercial brands, Erkodur and Shinseki. Erkodur and Shinseki aligners underwent several tests in three steps: before thermoforming, after thermoforming, and 2 weeks after intraoral exposure. The two groups were compared at each step with respect to physical and chemical changes. The study protocol was approved by the Ethics Committee of Shahid Beheshti University of Medical Sciences (IR.SBMU. DRC.REC.1401.075).
Sample sizeAccording to a study by Bucci et al.[2] the sample size was calculated to be 8 in each group, assuming alpha = 0.05, beta = 0.2, study power of 80%, and a mean difference and standard deviation of 0.03 and 0.04, respectively, between the two study groups. Accordingly, 16 patients were enrolled.
Eligibility criteriaThe inclusion criteria were age over 18, complete dentition except for third molars, good oral hygiene, no periodontal disease, systemic health, 0-–4 mm crowding (measured on dental casts), non-extraction treatment, willingness to participate in the study, and signed informed consent forms.
The exclusion criteria were maxillofacial or temporomandibular joint pain, active carious lesions, and a history of previous orthodontic treatment.
Specimen preparationOf each brand, two aligners were thermoformed on the dental molds of patients. One aligner was used for specimen preparation, and the respective tests, and the other one was delivered to patients. Dental molds of patients were printed by a 3D printer (Cubicon Style (HyVISION, Seoul, South-Korea) using photo-polymer acrylic resin and the fused deposition molding technology with 100 µm accuracy and printing speed of 1 cm/40–60 min. Each layer was cured with blue light at 405 nm wavelength. After curing, the molds were rinsed with alcohol to harden their surface. Erkodur and Shinseki sheets with 0.5 mm thickness were used for the fabrication of aligners.
The patients were instructed on how to clean and use the aligners and asked to wear them for 22 hours a day. They were also instructed to remove the aligners for eating and drinking (with special emphasis on removing them when drinking hot and colored drinks). The patients were visited after a 2-week period, and their used aligners were collected.
ThermoformingFor thermoforming of sheets, Erkodent Erkoform 3D Plus Vacuum Thermoforming Unit (Erkodent Erich Kopp GmbH, Pfalzgrafenweiler, Germany) was used. For this purpose, the sheets were subjected to 160°C infrared temperature for 30 s and were then cooled for 45 s.
Attenuated total reflectance (ATR)-FTIRSpecimens measuring 5 × 5 mm were cut out of the buccal surface of the maxillary right central incisor of the aligners and underwent ATR-FTIR (Nicolet iS10; Thermo Fisher, Waltham, MA, USA). The measurements were made at room temperature at 600–4000 cm-1 by 16 scans with a resolution of 4 cm-1. The absorbance and transmittance spectra were compared with the reference spectra.[12]
Surface hardnessSpecimens measuring 5 × 5 mm underwent a hardness test in a Vickers hardness tester (Indentec, Zwick Roell, Genova, Italy). In each specimen, three indentations were created by the pyramidal-shaped diamond indenter by applying a 10 N load for 10 s. After indentation, the two diagonals of the indentation were measured under a light microscope at ×40 magnification, and the Vickers hardness number (VHN) was calculated as follows:
VHN=1.854Fd2Where F is the applied load in Newtons (N), and d is the mean of the two diagonals of each indentation in millimeters (mm). The VHN was reported in megapascals.
ThicknessTo measure the thickness of the aligners, the maxillary first molar and first premolar teeth were cut out of the aligners, and the following points were marked on the first molars: Mesiobuccal cusp tip (U6MB), distobuccal cusp tip (U6DB), gingival margin of the buccal surface along the buccal groove (U6BG), mesiopalatal cusp tip (U6MP), distopalatal cusp tip (U6DP), and gingival margin of the palatal surface along the palatal groove (U6PG). The following points were marked on premolar teeth: buccal cusp tip (U4B), gingival margin of the buccal surface along the buccal groove (U4BG), palatal cusp tip (U4P), and gingival margin of the palatal surface along the palatal groove (U4PG). The thickness at each point was measured by a digital caliper (Insize, Zamudia, Biscay, Spain) with 0.01 mm accuracy. All measured points were distant from attachment areas. The thickness at each point was measured in triplicate, and the mean of the three values was calculated and reported.
Differential scanning calorimetry (DSC)DSC was carried out to determine the static Tg by DSC 214 Polyma® (Netzsch-Gerätebau GmbH, Germany). For this purpose, the specimens underwent −70–240°C temperature at a speed of 10°C/min.[13]
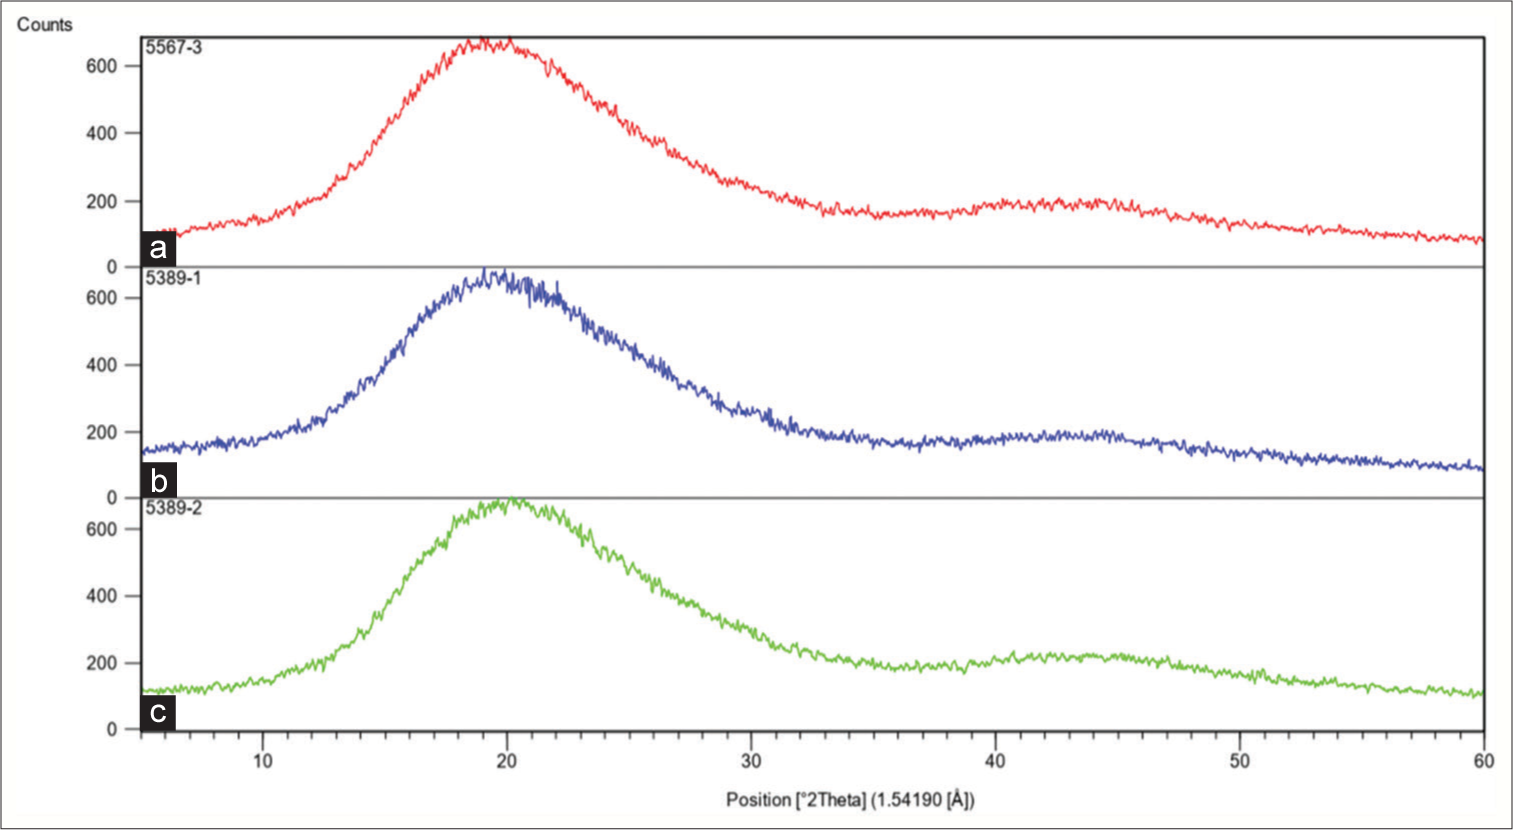
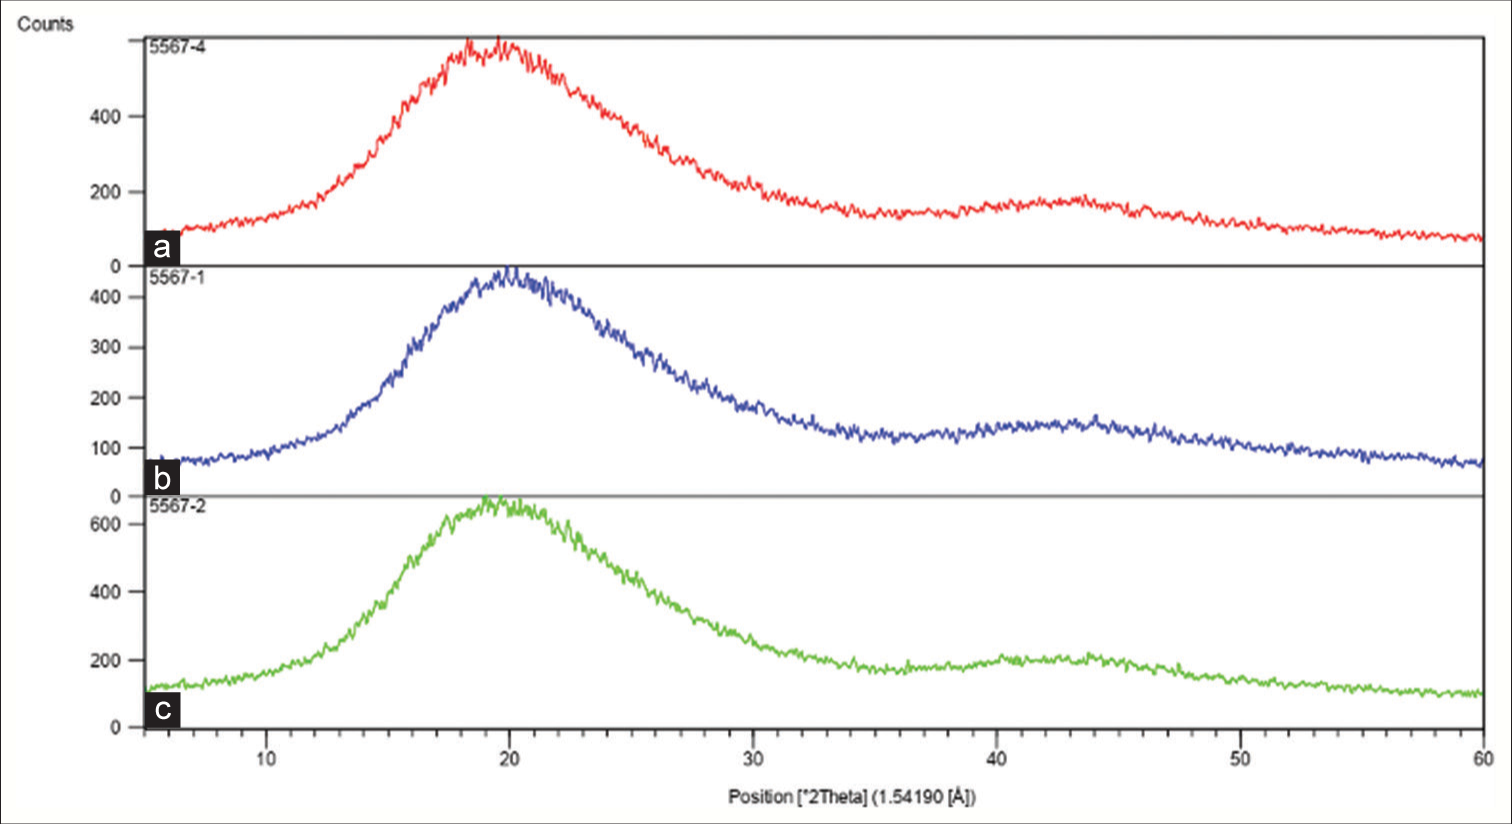
XRDSpecimens measuring 5 × 5 mm were cut out of the buccal surface of the maxillary left central incisor and transferred to a diffractometer (D8-Advance; Bruker, Germany) with Cu anode at Ka = 1.54 A° at room temperature. The XRD patterns were recorded at 2θ = 5–60°C with a 0.03°-degree step every 2 s.[12] The full width at half maximum (FWHM) was calculated using Upex software (Upex version 1.7, Tehran, Iran).
Statistical analysisThe normal distribution of data was analyzed by the Shapiro-Wilk test. Accordingly, one-sample, paired, and independent t-tests were applied to analyze normally distributed data, while the Mann–Whitney U and Wilcoxon signed-rank tests were applied to analyze non-normally distributed data. All statistical analyses were carried out using SPSS version 25 at a 0.05 level of significance.
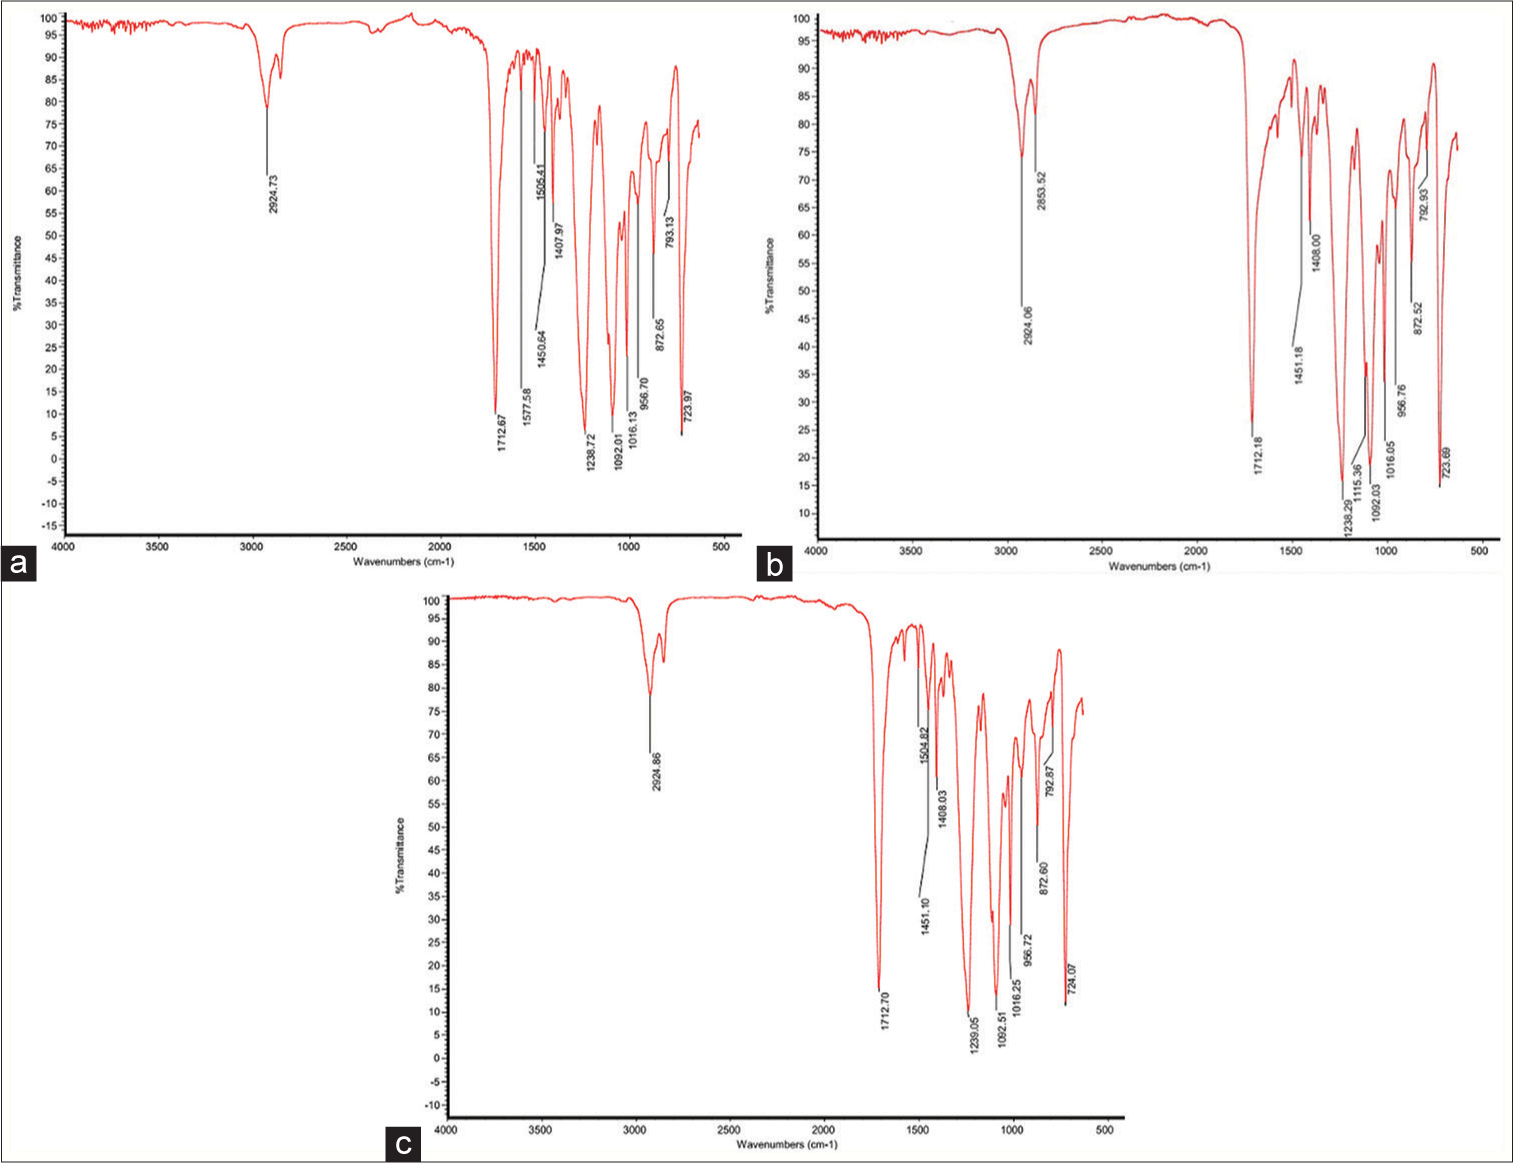
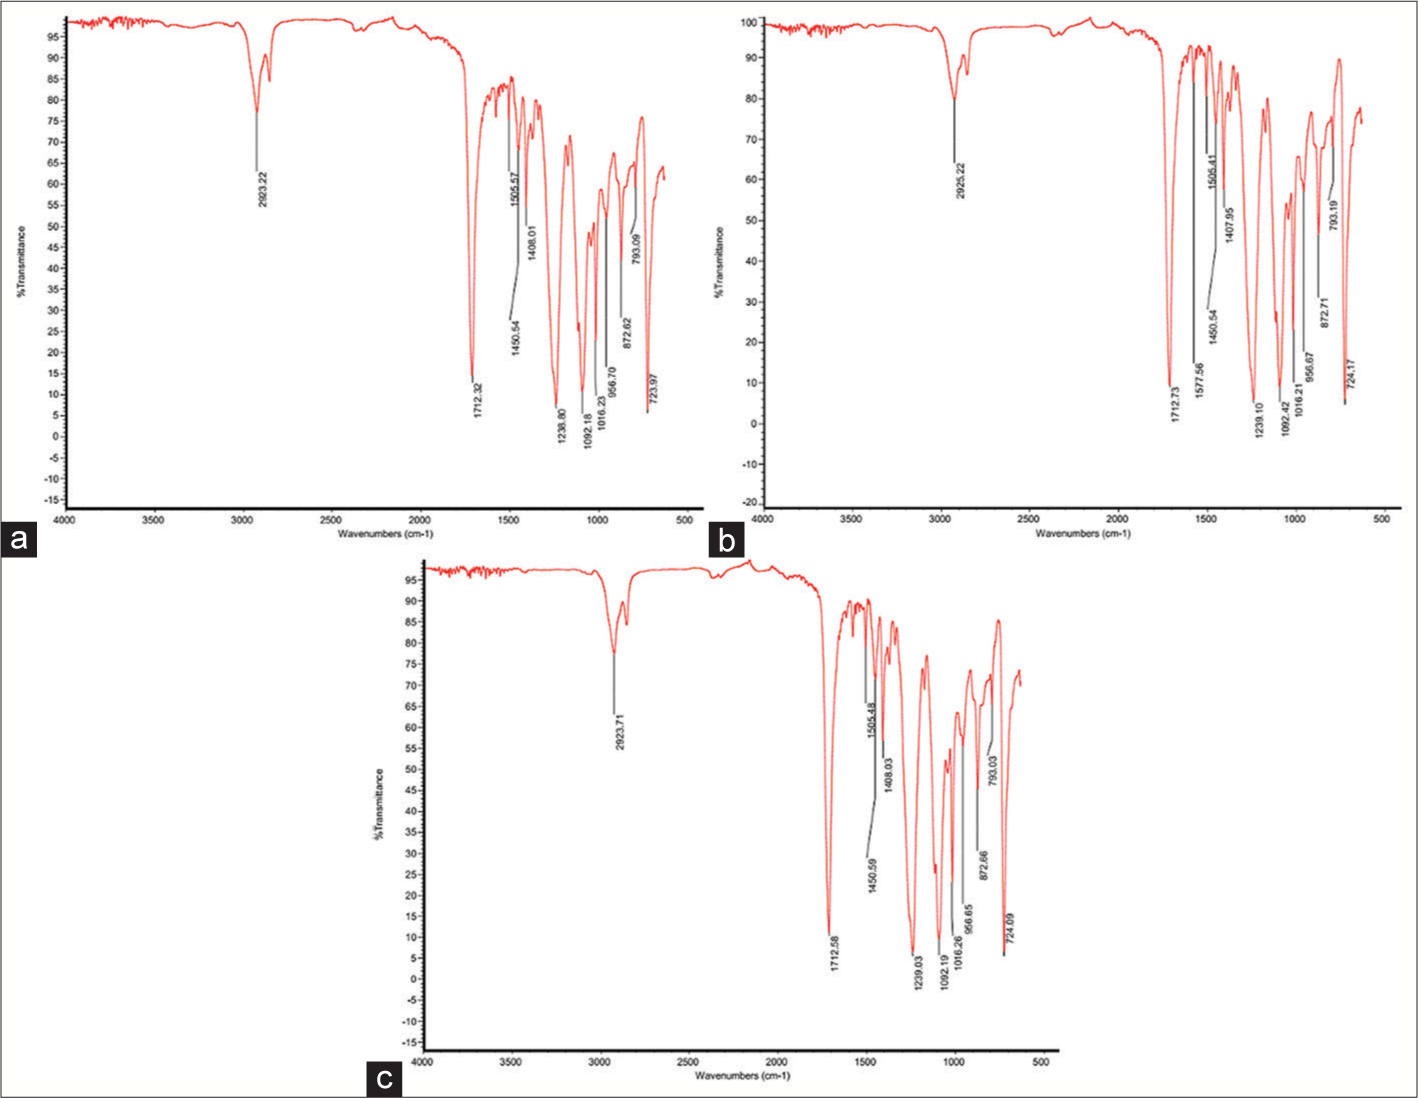
RESULTS ATR-FTIR[Figures 1 and 2] present the transmission graphs of Shinseki and Erkodur aligners. A comparison of the spectra with the polyethylene terephthalate glycol (PETG) reference spectra revealed that both aligners were made of PETG.[12] The two aligner types showed similar peaks at all three steps. A comparison of raw aligner sheets before thermoforming with thermoformed aligners before and after intraoral exposure revealed no significant change in their chemical structure.
Export to PPT
Export to PPT
[Table 1] presents the identified functional groups in ATR-FTIR graphs.
Table 1: Functional groups related to peaks in attenuated total reflectance-Fourier-transform infrared spectroscopy spectra.
Peak wavelength (cm-1) Functional group Mode of vibration 2923 -C–H (CH3, CH2) Stretching (asym/sym) 1712 -C=O (ester, acid) Stretching 1577 C-O-C Stretching 1505 =CH2 Wagging 1450 -C–H (CH3 , CH2 ) Bending 1408 -C–H (CH3) Bending 1239 -C–O Stretching 1115 -C–O Stretching 1092 -C–O Stretching 1016 -C–O Stretching 956 -HC=CH-(trans/cis) Bending (out of plane) 872 =CH2 Wagging 793 -C–H (cis) Bending (out of plane) 724 -C–H (cis) Bending (out of plane) Surface hardnessOne-sample t-test was applied to compare the surface hardness of raw sheets before thermoforming with the surface hardness of thermoformed aligners. The results showed a significant reduction in the surface hardness of both Erkodur (from 10.33 to 9.53, P = 0.002) and Shinseki (from 10.66 to 8.70, P = 0.000) aligners.
An independent t-test was applied to compare the surface hardness of the two groups of aligners before and after intraoral exposure [Table 2]. The results showed that the surface hardness of Erkodur aligners was significantly higher than that of Shinseki aligners before intraoral exposure (P = 0.035). However, the surface hardness of the two groups had no significant difference after intraoral exposure (P = 0.433). The change in surface hardness after intraoral use was not significantly different between the two groups either (P = 0.744).
Table 2: Comparison of the surface hardness of the two groups of aligners before and after intraoral exposure by independent t-test (n=8).
Brand Mean SD SE Statistic P-value Before intraoral exposure Shinseki 8.7038 0.898 0.31749 -2.332 0.035 Erkodur 9.5388 0.46841 0.16561 After intraoral exposure Shinseki 9.5388 1.12732 0.39857 -0.808 0.433 Erkodur 10.0813 1.52921 0.54066 Hardness difference Shinseki 0.835 1.672944 0.591475 0.333 0.744 Erkodur 0.5425 1.841116 0.650933The surface hardness of aligners in the two groups did not undergo significant changes after intraoral exposure (mean change of −0.54 ± 1.84 with P = 0.432 for Erkodur and mean change of −0.83 ± 1.67 with P = 0.201 for Shinseki).
ThicknessAs shown in [Table 3], the following significant differences were found between the two groups of aligners in thickness:
Table 3: Measured thickness at each point in the two groups (n=8).
Variable Brand Mean SD SE Statistic P-value U6RMB.B.thickness S 0.45600 0.018754 0.006631 0.309* 0.762 E 0.45275 0.023144 0.008183 U6RMB.A.thickness S 0.47300 0.025174 0.008900 7.500† 0.008 E 0.44163 0.022136 0.007826 U6RDB.B.thickness S 0.42975 0.030960 0.010946 23.500† 0.396 E 0.44288 0.033808 0.011953 U6RDB.A.thickness S 0.44875 0.036272 0.012824 0.517* 0.613 E 0.44050 0.026854 0.009494 U6RGB.B.thickness S 0.44125 0.023813 0.008419 2.038* 0.061 E 0.38513 0.074151 0.026216 U6RGB.A.thickness S 0.45525 0.029016 0.010259 2.642* 0.019 E 0.37975 0.075432 0.026669 U6RMP.B.thickness S 0.45338 0.039713 0.014041 −0.252* 0.805 E 0.45875 0.045465 0.016074 U6RMP.A.thickness S 0.46550 0.034067 0.012045 1.231* 0.239 E 0.44238 0.040802 0.014426 U6RDP.B.thickness S 0.45300 0.010114 0.003576 1.817* 0.091 E 0.44063 0.016396 0.005797 U6RDP.A.thickness S 0.46788 0.012147 0.004295 1.500† 0.000 E 0.43225 0.017119 0.006053 U6RGP.B.thickness S 0.47050 0.041621 0.014715 4.387* 0.001 E 0.38213 0.038915 0.013759 U6RGP.A.thickness S 0.47350 0.029257 0.010344 4.686* 0.000 E 0.37613 0.050969 0.018020 U6LMB.B.thickness S 0.45475 0.032235 0.011397 −0.107* 0.917 E 0.45625 0.023328 0.008248 U6LMB.A.thickness S 0.47675 0.029281 0.010352 1.793* 0.095 E 0.45350 0.022084 0.007808 U6LDB.B.thickness S 0.43638 0.028223 0.009978 −1.167* 0.263 E 0.45063 0.019928 0.007046 U6LDB.A.thickness S 0.45013 0.028185 0.009965 0.487* 0.634 E 0.44463 0.015052 0.005322 U6LGB.B.thickness S 0.44600 0.037800 0.013364 3.007* 0.009 E 0.39775 0.025110 0.008878 U6LGB.A.thickness S 0.46013 0.038245 0.013522 4.011* 0.001 E 0.39075 0.030499 0.010783 U6LMP.B.thickness S 0.45088 0.033694 0.011913 0.443* 0.665 E 0.44463 0.021454 0.007585 U6LMP.A.thickness S 0.46138 0.033385 0.011803 1.737* 0.104 E 0.43688 0.021853 0.007726 U6LDP.B.thickness S 0.44800 0.017542 0.006202 16.000† 0.097 E 0.43100 0.020220 0.007149 U6LDP.A.thickness S 0.46138 0.021334 0.007543 3.182* 0.007 E 0.42463 0.024732 0.008744 U6LGP.B.thickness S 0.46775 0.019754 0.006984 4.915* 0.000 E 0.38900 0.040789 0.014421 U6LGP.A.thickness S 0.46850 0.032062 0.011336 3.897* 0.002 E 0.38663 0.050028 0.017688 U4RB.B.thickness S 0.43100 0.025813 0.009126 1.118* 0.282 E 0.40975 0.047165 0.016675 U4RB.A.thickness S 0.42725 0.028764 0.010170 1.013* 0.318 E 0.41063 0.036410 0.012873 U4RBG.B.thickness S 0.40975 0.034623 0.012241 1.223* 0.242 E 0.38888 0.033656 0.011899 U4RBG.A.thickness S 0.41888 0.032878 0.011624 2.892* 0.012 E 0.36950 0.035367 0.012504 U4RP.B.thickness S 0.39963 0.026387 0.009329 0.487* 0.634 E 0.39300 0.027959 0.009885 U4RP.A.thickness S 0.42413 0.023955 0.008469 3.107* 0.008 E 0.38725 0.023517 0.008315 U4RPG.B.thickness S 0.42700 0.030766 0.010878 0.486* 0.635 E 0.41775 0.044184 0.015621 U4RPG.A.thickness S 0.44800 0.035246 0.012461 1.556* 0.142 E 0.41763 0.042517 0.015032 U4LB.B.thickness S 0.43638 0.033882 0.011979 1.194* 0.252 E 0.41313 0.043433 0.015356 U4LB.A.thickness S 0.43125 0.038600 0.013647 1.199* 0.250 E 0.40713 0.041831 0.014790 U4LBG.B.thickness S 0.40863 0.017606 0.006225 0.784* 0.446 E 0.39713 0.037582 0.013287 U4LBG.A.thickness S 0.41750 0.025674 0.009077 2.665* 0.018 E 0.37888 0.031957 0.011299 U4LP.B.thickness S 0.43225 0.038306 0.013543 1.753* 0.101 E 0.40225 0.029596 0.010464 U4LP.A.thickness S 0.45250 0.035757 0.012642 3.476* 0.004 E 0.39513 0.030021 0.010614 U4LPG.B.thickness S 0.40988 0.035183 0.012439 −0.651* 0.525 E 0.42138 0.035424 0.012524 U4LPG.A.thickness S 0.43575 0.032235 0.011397 20.500† 0.242 E 0.41688 0.034564 0.012220 U6RMB.diff S 0.0170 0.01585 0.00560 4.354* 0.001 E −0.0111 0.00909 0.00322 U6RDB.diff S 0.0190 0.00838 0.00296 8.000† 0.010 E −0.0024 0.02054 0.00726 U6RGB.diff S 0.0140 0.01482 0.00524 6.500† 0.005 E −0.0054 0.01260 0.00446 U6RMP.diff S 0.0121 0.01353 0.00478 3.487* 0.004* E −0.0164 0.01875 0.00663 U6RDP.diff S 0.0149 0.01644 0.00581 3.231* 0.006 E −0.0084 0.01220 0.00431 U6RGP.diff S 0.0030 0.02007 0.00710 1.013* 0.328 E −0.0060 0.01513 0.00535 U6LMB.diff S 0.0220 0.00877 0.00310 5.555* 0.000 E −0.0028 0.00905 0.00320 U6LDB.diff S 0.0138 0.00894 0.00316 4.498* 0.001 E −0.0060 0.00862 0.00305 U6LGB.diff S 0.0141 0.01254 0.00443 3.504* 0.004 E −0.0070 0.01155 0.00408 U6LMP.diff S 0.0105 0.00705 0.00249 1.500† 0.000 E −0.0078 0.01094 0.00387 U6LDP.diff S 0.0134 0.01115 0.00394 4.211* 0.001 E −0.0064 0.00719 0.00254 U6LGP.diff S 0.0008 0.01829 0.00647 0.326* 0.749 E −0.0024 0.02003 0.00708 U4RB.diff S −0.0038 0.01015 0.00359 −0.643* 0.530 E 0.0009 0.01762 0.00623 U4RBG.diff S 0.0091 0.01599 0.00566 3.170* 0.007 E −0.0194 0.01977 0.00699 U4RP.diff S 0.0245 0.01226 0.00433 4.922* 0.000 E −0.0058 0.01233 0.00436 U4RPG.diff S 0.0210 0.00739 0.00261 3.752* 0.002 E −0.0001 0.01411 0.00499 U4LB.diff S −0.0051 0.02452 0.00867 0.079* 0.938 E −0.0060 0.01949 0.00689 U4LBG.diff S 0.0089 0.01975 0.00698 3.232* 0.006 E −0.0183 0.01317 0.00466 U4LP.diff S 0.0203 0.00506 0.00179 0.000† 0.000 E −0.0071 0.01009 0.00357 U4LPG.diff S 0.0259 0.01792 0.00634 4.500† 0.002 E −0.0045 0.01922 0.00680At U6RMB, U6RGB, U6RDP, U6LDP, U4RBG, U4RP, and U4LBG, the thickness was significantly greater in Shinseki aligners after intraoral exposure (P < 0.05). At U6RGP, U6LGB, and U6LGP, the thickness was significantly greater in Shinseki aligners both before and after intraoral exposure (P < 0.05). In the following points, a significant increase in thickness occurred in Shinseki aligners and a significant reduction in thickness occurred in Erkodur aligners after intraoral exposure: U6RMB, U6RGB, U6RMP, U6RDP, U6LMB, U6LDB, U6LGB, U6LMP, U6LDP, U4RBG, U4RP, U4LBG, U4RPG, U4LPG, and U4LP.
[Table 4] shows the changes in the thickness of aligners in the two groups after intraoral exposure compared with before at different points. As shown, a significant reduction in thickness was noted at U6RMB, U6RMP, U6LDP, U4RBG, and U4LBG in Erkodur aligners (P < 0.05). A significant increase in thickness was found at U6RMB, U6RDB, U6RGB, U6RGB, U6RDP, U6LMB, U6LDB, U6LGB, U6LMP, U6LDP, U4RP, U4RPG, U4LP, and U4LPG in Shinseki aligners (P < 0.05).
Table 4: Changes in thickness of aligners in the two groups after intraoral exposure compared with before at different points.
Brand/Point Erkodur Shinseki Mean SD Statistic P-value Mean SD Statistic P-value U6RMB.B.thickness-U6RMB.A.thickness 0.011125 0.009094 3.460* 0.011 −0.017000 0.015847 −2.111† 0.039 U6RDB.B.thickness-U6RDB.A.thickness 0.002375 0.020535 0.327* 0.753 −0.019000 0.008384 −2.524† 0.008 U6RGB.B.thickness-U6RGB.A.thickness 0.005375 0.012603 1.206* 0.267 −0.014000 0.014823 −2.671* 0.032 U6RMP.B.thickness-U6RMP.A.thickness 0.016375 0.018746 2.471* 0.043 −0.012125 0.013527 −2.535* 0.039 U6RDP.B.thickness-U6RDP.A.thickness 0.008375 0.012200 1.942* 0.093 −0.014875 0.016435 −2.240† 0.023 U6RGP.B.thickness-U6RGP.A.thickness 0.006000 0.015128 1.122* 0.299 −0.003000 0.020071 −0.423* 0.685 U6LMB.B.thickness-U6LMB.A.thickness 0.002750 0.009051 0.859* 0.419 −0.022000 0.008767 −7.098* 0.000 U6LDB.B.thickness-U6LDB.A.thickness 0.006000 0.008619 1.969* 0.090 −0.013750 0.008940 −4.350* 0.003 U6LGB.B.thickness-U6LGB.A.thickness 0.007000 0.011551 1.714* 0.130 −0.014125 0.012541 −3.186* 0.015 U6LMP.B.thickness-U6LMP.A.thickness 0.007750 0.010938 2.004* 0.085 −0.010500 0.007051 −4.212* 0.004 U6LDP.B.thickness-U6LDP.A.thickness 0.006375 0.007190 2.508* 0.041 −0.013375 0.011148 −2.176† 0.031 U6LGP.B.thickness-U6LGP.A.thickness 0.002375 0.020028 0.335* 0.747 −0.000750 0.018289 −0.116* 0.911 U4RB.B.thickness-U4RB.A.thickness −0.000875 0.017618 −0.140* 0.892 0.003750 0.010152 1.045* 0.331 U4RBG.B.thickness-U4RBG.A.thickness 0.019375 0.019770 2.772* 0.028 −0.009125 0.015995 −1.614* 0.151 U4RP.B.thickness-U4RP.A.thickness 0.005750 0.012326 1.319* 0.229 −0.024500 0.012259 −5.653* 0.001 U4RPG.B.thickness-U4RPG.A.thickness 0.000125 0.014106 0.025* 0.981 −0.021000 0.007387 −8.040* 0.000 U4LB.B.thickness-U4LB.A.thickness 0.006000 0.019486 0.871* 0.413 0.005125 0.024521 0.591* 0.573 U4LBG.B.thickness-U4LBG.A.thickness 0.018250 0.013167 3.920* 0.006 −0.008875 0.019752 −1.271* 0.244 U4LP.B.thickness-U4LP.A.thickness 0.007125 0.010092 1.997* 0.086 −0.020250 0.005064 −11.311* 0.000 U4LPG.B.thickness-U4LPG.A.thickness 0.004500 0.019221 −0.420† 0.742 −0.025875 0.017924 −4.083* 0.005 TgThe mean Tg of both Erkodur (from 78.2 to 77.5, P = 0.016) and Shinseki (from 76.5 to 72.9, P = 0.000) aligners significantly decreased after thermoforming. As shown in [Table 5], the Tg of Erkodur aligners was significantly higher than that of Shinseki aligners before intraoral exposure (P = 0.000). However, the Tg of the two aligner groups were not significantly different after intraoral exposure (P = 0.201). Paired t-test showed that the Tg of Erkodur aligners significantly decreased (mean change of 2.17 ± 0.76, P = 0.000) while the Tg of Shinseki aligners significantly increased (mean change of 2.87 ± 1.16, P = 0.000) after intraoral exposure.
Table 5: Measures of central dispersion of glass transition temperature for the two groups before and after intraoral exposure (n=8).
Time Brand Mean SD SE Statistic P-value Before intraoral exposure Shinseki 72.925 0.72457 0.25617 −14.192 0 Erkodur 77.5625 0.57306 0.20261 After intraoral exposure Shinseki 75.8 0.69076 0.24422 1.342 0.201 Erkodur 75.3875 0.52763 0.18655 XRD[Figures 3 and 4] show the XRD patterns of Shinseki and Erkodur aligners. [Table 6] shows the FWHM of the two groups of aligners.
Export to PPT
Export to PPT
Table 6: Full width at half maximum of the two groups of aligners.
Group/Aligner After intraoral exposure Before intraoral exposure Raw sheet before thermoforming Shinseki 10.105 10.119 10.001 Erkodur 10.218 9.426 9.784 DISCUSSIONThis study assessed the physical and chemical changes of clear aligners after thermoforming and intraoral exposure.
ATR-FTIRThe present results showed that the ATR-FTIR spectra of both Shinseki and Erkodur aligners matched those of PETG before thermoforming, and before and after intraoral exposure, with no significant difference between the two groups. Previous studies performed ATR-FTIR and reported that Invisalign (Align Technology, Inc. San Jose, CA, USA) and Zendura Flx (Zendura, Bay Materials LLC, Fremont, CA, USA) aligners are made of polyurethane while Essix ACE Plastic (Dentsply Sirona, York, PA, USA), Erkodur, and Ghost Aligner (BART MEDICAL S.r.l., Mezzano, Italy) are made of PETG.[4,12,14-16] However, no previous study was found on the material of Shinseki aligners. The above-mentioned studies evaluated the chemical composition of aligners after thermoforming, after intraoral exposure, or exposure to simulated intraoral environment. In the present study, raw sheets of aligners before thermoforming were evaluated and the results showed optimal chemical stability of PETG after thermoforming. A previous study introduced PETG as a material with high transparency, optimal flow, and favorable resistance against different solvents, which is suitable for different fabrication processes such as printing, die-cut, and hot-stamp.[17] The present results confirmed the optimal resistance of PETG against chemical changes following thermoforming and intraoral exposure.
Stability of aligner polymer material can be influenced by chemical groups on the material surface. The peak at 2923 cm-1 in ATR-FTIR spectra belongs to the C-H bond with stretching vibration, which is a hydrophobic group and can further stabilize the material by reduction of water sorption.[18] This peak was found in all ATR-FTIR spectra of the specimens in the present study and can explain their structural stability. Bradley et al.[14] found no significant change in chemical structure of reference aligners (before intraoral use) and retrieved aligners (after clinical use for 44 ± 15 days). Their results were in agreement with the present findings despite different assessment times. Gracco et al.[19] reported some molecular surface changes following intraoral use and immersion of Invisalign aligners in artificial saliva. However, gas chromatography-mass spectrometry confirmed their chemical stability. Memè et al.[16] reported no significant change in chemical properties of Invisalign aligners following exposure to tea, coffee, cola, and UV light for 24 and 48 h; however, tea and coffee pigments caused their significant color change. Despite the use of different types of aligners, their results regarding optimal chemical stability of aligners were in line with the present findings.
Surface hardnessThe present results showed that thermoforming significantly decreased the VHN of both Shinseki and Erkodur aligners; however, intraoral exposure for 2 weeks did not significantly change their VHN. Hardness is defined as resistance against plastic deformation. Increased hardness of aligners not only affects their load application profile but can also cause patient discomfort during insertion and removal.[20] Kohda et al.[21] showed a strong correlation between the hardness of Duran, Erkodur, and Hardcast aligners and the applied load by them. Thus, change in hardness can be a good indicator of change in applied load and efficacy of aligners.
Dalaie et al.[10] reported a significant reduction in VHN of Duran and Erkodur aligners following thermoforming and aging, which was in agreement with the present results. However, aging by 200 thermal cycles following immersion in 37°C distilled water for 24 h significantly decreased the hardness of Erkodur aligners in their study, which was different from the present results that showed no significant change in hardness of aligners following their intraoral exposure. This difference can be due to different aging processes since their study had an in vitro design and aging was performed by thermocycling, while, in the present study, aligners were used by patients for 2 weeks. Bradley et al.[14] reported that intraoral aging of Invisalign aligners decreased their VHN and wear resistance, which was different from the present results since the hardness of the two groups of aligners did not significantly change after 2 weeks of intraoral exposure in the present study. This difference can be due to differences in aligner materials and different durations of use. Schuster et al.[22] indicated an increase in VHN of Invisalign aligners after intraoral use, probably due to cold work of mastication. Their results were in contrast to the present findings which may be attributed to the difference in aligner materials (polyurethane in their study versus PETG in the present study). Ryu et al.[23] evaluated the effect of thermoforming on the physical and mechanical properties of Duran, Essix A+, Essix ACE, and eCligner aligners and reported no change in Knoop hardness of Duran and eCligner and an increase in hardness of Essix A+ and Essix ACE; however, in the present study, the VHN of both aligners significantly decreased after thermoforming. This difference can be attribute
Comments (0)