
Remember me


This was a single-center experimental study conducted on patients with chest pain presenting to the Emergency Medicine Department of a tertiary care teaching hospital in South India after receiving IEC clearance and CTRI registration.
Study populationThe study population includes patients from the southern state of India, Karnataka.
Sample sizeTo detect an effect size of 0.4 using a paired t-test at a 5% level of significance with 90% power, we require a minimum of 68 pairs. Since the outcome variable is not normally distributed, a non-parametric test must be performed, which requires the minimum sample size to be adjusted as 68 multiplied by 1.2. Thus, a hypothesized sample size of 82 is needed for comparison. Hence, 85 adults who presented to the Emergency Medicine Department with chest pain and consented to participate were enrolled after meeting the inclusion and exclusion criteria.
Statistical methodsWe used a paired t-test to compare the normally distributed data, and the Wilcoxon paired t-test was used for the rest.
Inclusion criteriaPatients presented complaints of chest pain to the Emergency medicine department.
Exclusion criteria 1)Patients with abdominal mass or other pathology.
2)Severe pulmonary artery hypertension.
3)Femoral vein occlusion.
4)Deep vein thrombosis, Inferior vena cava filter.
5)Pregnancy.
6)ST elevation MI (STEMI).
7)Pulmonary embolism.
8)Pulmonary oedema.
9)Heart failure with reduced EF.
10)Hemodynamic instability (Hypotension/ arrhythmia).
11)Mechanical ventilation.
The images are obtained using a single machine, the GE Versana® active TM ultrasound machine, and captured by a single operator.
After obtaining informed consent and explaining the procedure, the patient was placed in a supine position. Heart rate, blood pressure, oxygen saturation, and respiratory rate were monitored continuously during the procedure. Using a curvilinear probe(2-5Mhz) of the ultrasound placed in the subcostal area, a long-axis view of the inferior vena cava (IVC) was obtained and confirmed by visualizing the IVC entering the right atrium and a segment of the hepatic vein joining the IVC. After acquiring a good view of IVC, M-mode was used to obtain the respiratory phasic variation of IVC. The M-mode pointer was placed 2 cm away from the junction of the hepatic vein joining IVC. The image was frozen, and using calipers, maximum and minimum IVC diameters perpendicular to the long axis were measured (Fig. 1). IVC collapsibility index (IVC CI) was calculated using the formula.
IVC CI = (Maximum IVC diameter – Minimum IVC diameter) ÷ Maximum IVC diameter × 100.
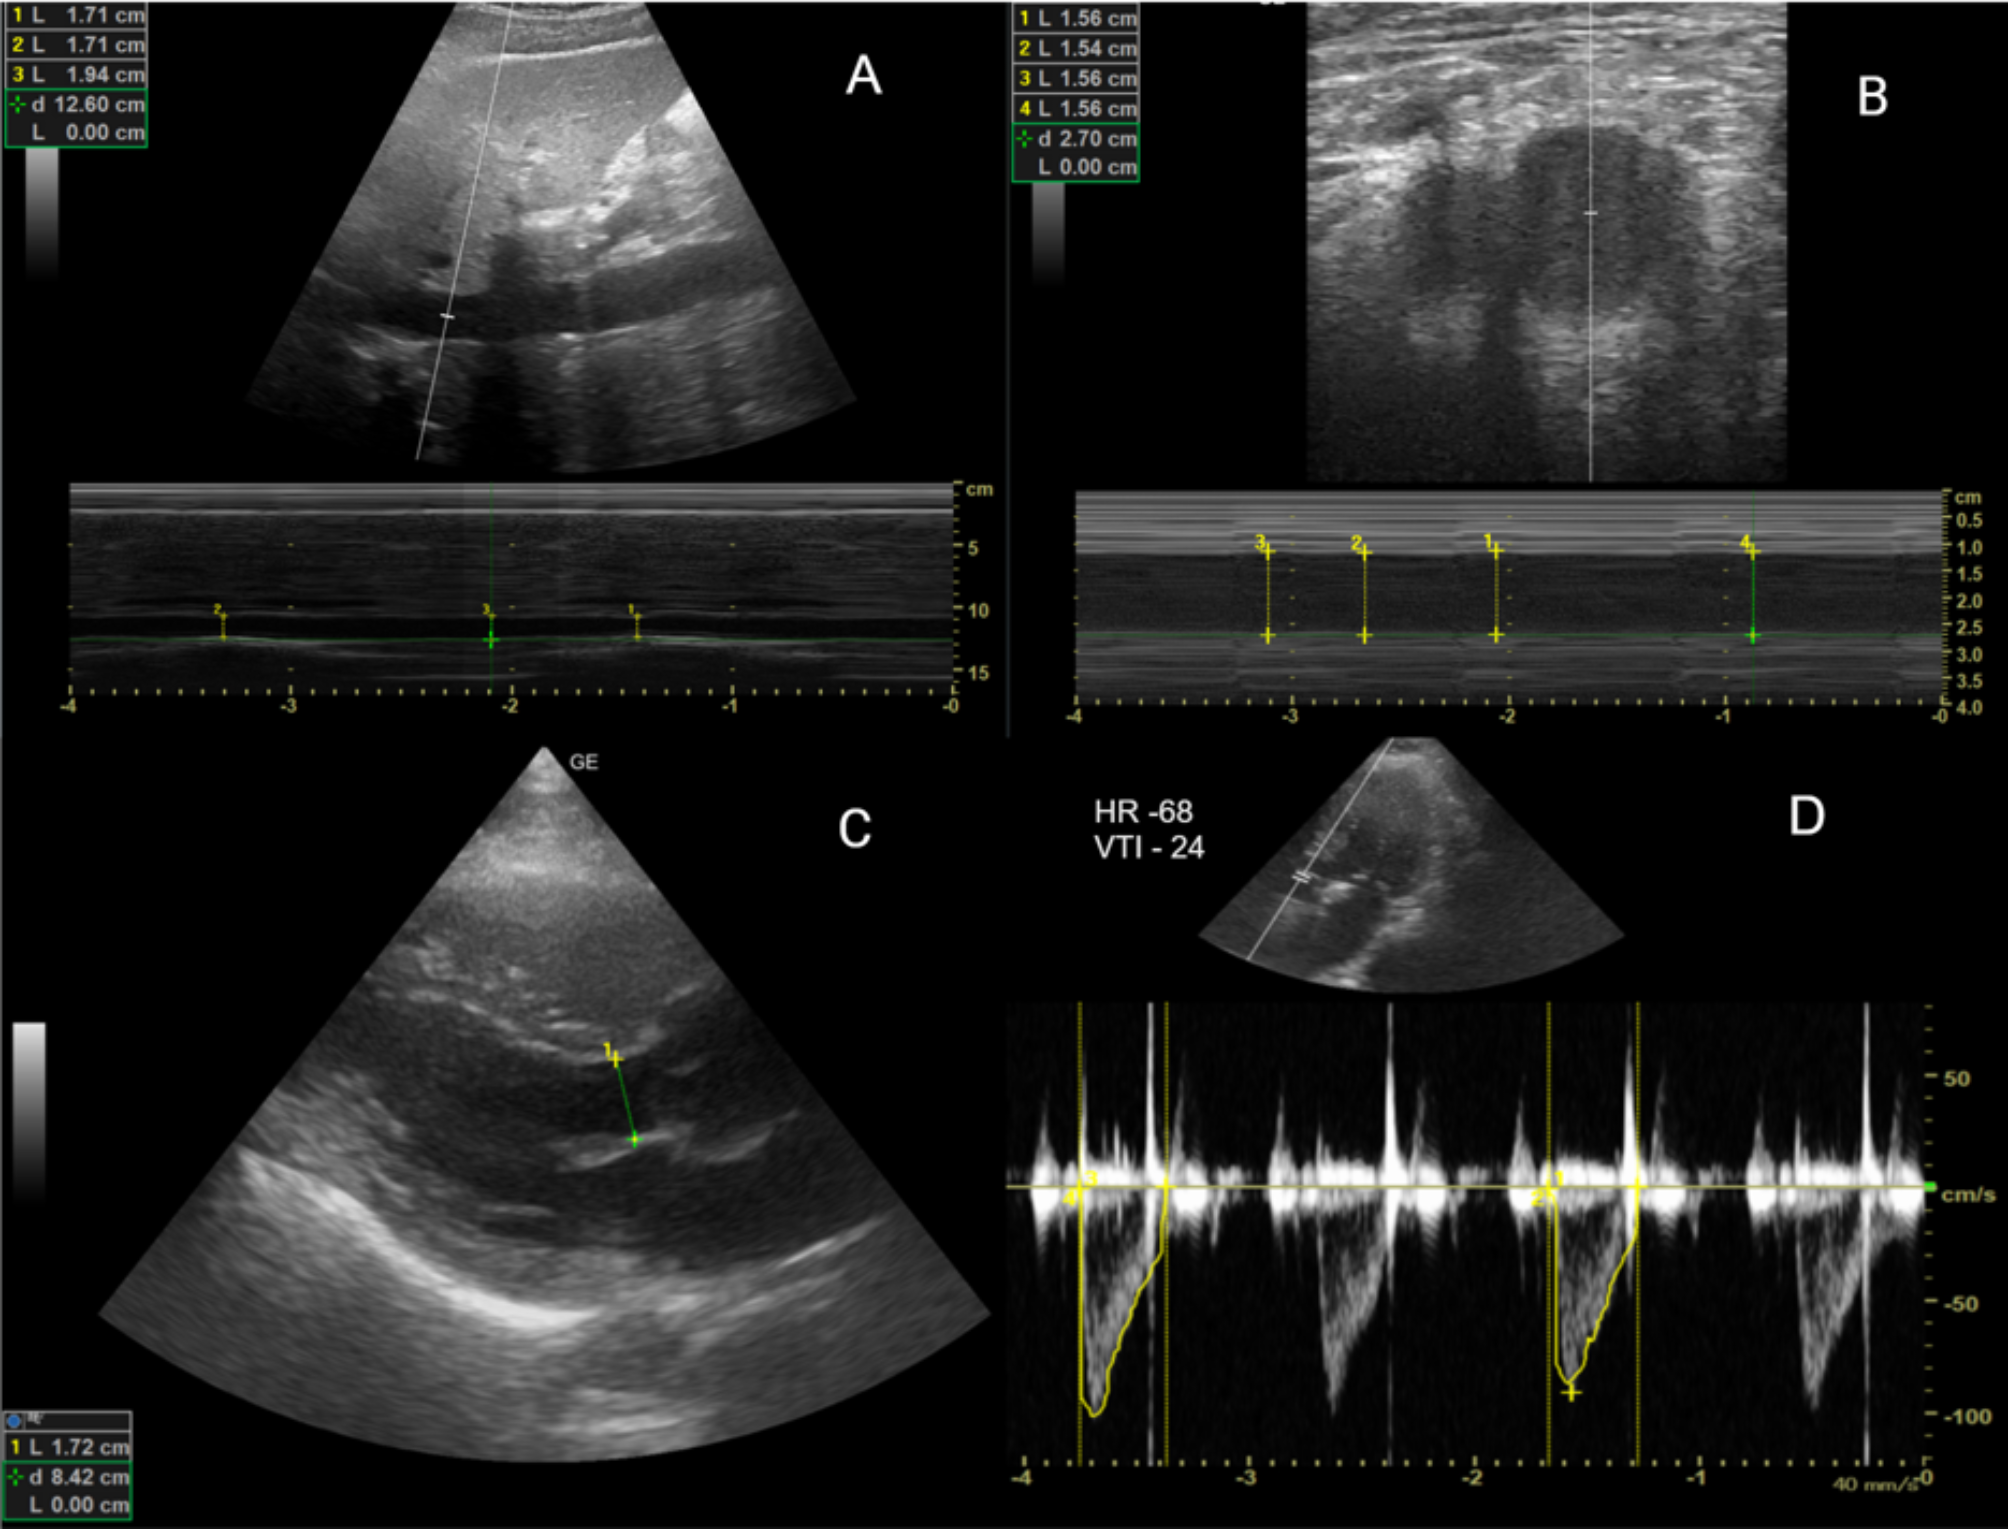
Fig. 1
Ultrasound images of IVC, femoral vein & LVOT-VTI
Image A -Ultrasound image of IVC using M mode. L1, L2, L3– 3 values of IVC diameters; d – depth at which IVC is measured
Image B - Femoral artery(left), Femoral vein(right) L1, L2, L3, L4 – Diameters of femoral vein on inspiration and expiration; d – depth at which femoral vein is measured
Image C - Ultrasound image of parasternal long axis view of LVOT; L – diameter of LVOT; d – depth at which LVOT is measured
Image D - Ultrasound image of LVOT with VTI measurement in apical 5 chamber view
VTI Velocity time integral of 24; HR – Heart rate of 68 bpm
Technique- With the linear probe(5-10Mhz), the right common femoral vein was identified using the inguinal ligament crease as the landmark, 2–4 cm below the level of the inguinal ligament, above the inguinal canal. The great saphenous vein take-off was traced by scanning caudally at the anteromedial aspect of the common femoral vein. The measurements were taken when the great saphenous vein was no longer seen caudally. DVT screening of the common femoral vein was also performed simultaneously. Using the M-mode of the ultrasound, the largest diameter of the vein is measured. Maximum and minimum FV diameter is measured with respiratory phasic variation (Fig. 1). The following formula calculates the femoral vein collapsibility index (FV CI);
FV CI = (Maximum FV diameter – Minimum FV diameter) ÷ Maximum FV diameter × 100.
A phased array transducer(1-2Mhz) was used to measure the stroke volume using the LVOT-VTI method. LVOT diameter was measured in parasternal long-axis view within 0.5 to 1 cm of the aortic annulus, as this location best reflects the exact anatomic location of the laminar LVOT velocity profile [16]. VTI measurements were taken in an apical 5-chamber view (Fig. 1). LVOT VTI was calculated by placing the pulse wave doppler in the outflow tract below the aortic valve and recording the velocity (cm/s). With the assumption of laminar flow through the LVOT, this measurement correlates well with cardiac output, which is the product of stroke volume and heart rate [17]. After attaining both values, stroke volume was calculated using the formula.
SV = (LVOT Diameter ÷ 2)2 × π × VTI.
A passive leg-raising (PLR) maneuver was done to assess both the femoral vein and IVC response to volume. From the supine position, the patient was shifted to a semi-recumbent position where the trunk was at 45°. Then, the patient’s upper body was lowered to a horizontal position while the lower limbs were elevated to 45°. All these positional changes were done by adjusting the bed without manipulating the patient. An angle of 45° was measured using a goniometer, and the bed was adjusted accordingly. After the passive leg raising test, all measurements were obtained within 2 min. PLR was repeated to obtain the values within the time limit of 2 min. Along with these, hemodynamic parameters mentioned in Table 1 are also monitored and documented during the maneuver.
A total of 2 sets of values, pre-PLR and post-PLR, of IVC diameter, femoral vein diameter, and stroke volume were measured and documented.
Comments (0)