Alcohol-associated liver disease is one of the most common liver diseases worldwide, affecting an estimated 123 million individuals and contributing to approximately 25% of cirrhosis-related deaths 1, 2. Alcohol-associated hepatitis represents a severe form of alcohol-associated liver disease and is associated with the fastest disease progression 3. Alcohol-associated hepatitis is also associated with bacterial infections and the development of acute-on-chronic liver failure, multiorgan failure, culminating in high short-term mortality rates of 20-50% within three months 4. Approximately 60% of hospitalizations due to complications of cirrhosis or acute-on-chronic liver failure were caused by alcohol-associated cirrhosis and alcohol-associated hepatitis 5. There appears to be a growing global incidence of alcohol-associated hepatitis, particularly among young adults and women, incurring a growing health and clinical burden 6. Gut microbial dysbiosis has been associated with the development and progression of chronic liver diseases via the gut-liver axis 7. In particular in alcohol-associated liver disease, various populations of the gut microbiota have been implicated in the pathogenesis and worsening of liver disease 8. Excessive alcohol consumption increases gut permeability by disrupting tight junctions in intestinal epithelial cells and changes the composition of the gut microbiota 9, 10. Furthermore, evidence of bacterial translocation from the gut-colonized niche has been observed in patients with alcohol-associated hepatitis 11. Specifically, we have unveiled that approximately one-third of patients with alcohol-associated hepatitis were colonized with cytolysin-positive Enterococcus faecalis (E. faecalis), which confers more severe liver disease and elevated mortality rates 8.
E. faecalis is a Gram-positive bacterium found in the intestinal tracts of healthy individuals. It also acts as an opportunistic pathogen and is frequently isolated in nosocomial settings 12. E. faecalis has developed the ability to colonize and persist in hospital environments, leading to nosocomial transmission through patient-to-patient contact or via invasive medical devices 13. E. faecalis has been reported to cause hospital outbreaks of bacteremia, urinary tract infections, and endocarditis 14. The estimated annual incidence of E. faecalis bloodstream infections is ~ 4.5 per 100,000, with a case fatality rate ranging between 10 and 20% 15. Ethanol administration facilitates the translocation of gut-originated pathogenic E. faecalis to the liver in mice, exacerbating the progression of liver disease 8. Therefore, exploring the association of pathogenic E. faecalis with the outcomes of patients with alcohol-associated hepatitis is of significant clinical relevance.
Gelatinase is a neutral metalloprotease requiring Ca2+ for activity and plays a role in proteolysis and disruption of basement membranes through collagen degradation 16, 17. In E. faecalis, gelatinase is considered a virulence factor and is associated with biofilm formation 18. Furthermore, gelatinase has been identified as a principal mediator of pathogenesis in endocarditis caused by E. faecalis in animals 16. Gelatinase was prevalent in clinical isolates from patients with bacterial infections, such as endocarditis 19, 20 and bacteremia 20, 21 and fecal isolates 19. Gelatinase has been shown to promote the translocation of E. faecalis in vitro 22. Importantly, colonization with gelE (encodes gelatinase)-positive E. faecalis has been linked to liver carcinogenesis in vivo via the translocation of lipopolysaccharide to the liver and an increase in the expression of proliferative genes 23. Further, it has been shown that the enrichment and translocation of E. faecalis is associated with more severe ethanol-induced liver disease in mice 8, thus, it is likely that the presence of gelatinase in feces could cause more severe alcohol-associated liver disease in patients. This study aims to investigate the significance of fecal gelatinase on clinical outcomes in patients with alcohol-associated hepatitis.
RESULTSPatient Cohort
The study population consisted of 65 patients with alcohol-associated hepatitis (Table 1). Of these, 60% (39/65) were male, with a median age of 48.5 years and body-mass index (BMI) of 26.9 kg/m2. 19 out of 29 (65.5%) biopsied patients had cirrhosis. The median value of ALT and AST was 49 U/L and 146 U/L, respectively. See additional serum disease markers and scores in Table 1.
TABLE 1. Baseline demographic and laboratory data of the study population.
n
Alcohol-associated Hepatitis (n=65)
Gender: Male
65
39 (60.0%)
Age [years]
65
48.5 [39.2;57.0]
Body-mass index (BMI) [kg/m2]
59
26.9 [23.8;30.1]
Aspartate aminotransferase (AST) [U/L]
64
146 [90.0;201]
Alanine aminotransferase (ALT) [U/L]
63
49.0 [29.5;66.5]
Gamma-glutamyltransferase (GGT) [U/L]
38
162 [115;562]
Alkaline phosphatase (AP) [U/L]
63
174 [123;250]
Bilirubin [mg/dL]
64
13.9 [8.00;22.2]
Albumin [g/dL]
63
2.50 [2.14;3.00]
International normalized ratio (INR)
64
2.00 [1.60;2.20]
Creatinine [mg/dL]
64
0.76 [0.60;1.10]
White blood count (WBC) [109/L]
64
10.6 [6.36;13.9]
Hemoglobin [g/dL]
64
10.2 [9.10;11.7]
Platelets [109/L]
63
122 [77.5;164]
Dialysis: yes
49
2 (4.08%)
Antibiotics: yes
64
15 (23.4%)
Steroid treatment: yes
64
28 (43.8%)
Child-Pugh Class
62
C [B;C]
Fibrosis-4 Index (FIB-4)
62
6.49 [4.70;13.5]
Maddrey’s DF
56
70.5 [52.9;127]
ABIC
64
8.11 [6.85;8.92]
MELD
64
23.7 [21.8;28.6]
MELD-Na
64
27.0 [24.1;31.4]
Gelatinase: positive
65
20 (30.8%)
Cytolysin: positive
48
12 (25%)
Presence of Fecal Gelatinase does not Predict 30-day and 90-day Mortality in Patients with Alcohol-Associated Hepatitis
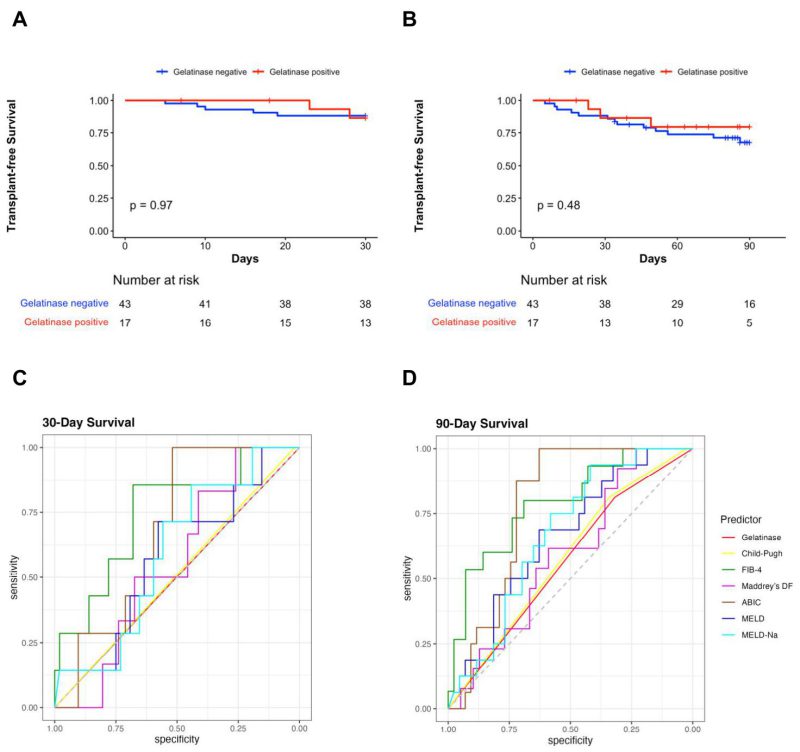
Of the total, 30.8% (20/65) patients were positive for gelatinase in their stool samples (Table 1). The contribution of each center for gelatinase-positive and gelatinase-negative patients is shown in Table 2. However, because of the limited number of patients from each country, matching of the area using statistical techniques could not be carried out in a meaningful way. Twelve out of 48 (25%) patients were cytolysin positive, and no difference regarding gelatinase-positivity between the cytolysin-positive and cytolysin-negative groups (33.3% vs. 33.3%) was observed. Six gelatinase-positive and 13 gelatinase-negative patients of the entire population had cirrhosis. For five out of the 65 subjects, no mortality data was available and therefore there were 60 patients remaining to study the association of gelatinase with outcomes. There were no significant differences in 30-day survival and 90-day survival between gelatinase-positive (n=17) and gelatinase-negative patients with alcohol-associated hepatitis (n=43) (Figure 1A, 1B). Overall, seven out of 60 (11.7%) and 16 out of 60 patients with alcohol-associated hepatitis (26.7%) were confirmed dead within 30 and 90 days, respectively. Two out of 17 gelatinase-positive patients (11.8%) and five out of 43 gelatinase-negative patients (11.6%) were confirmed dead within 30 days, whereas three out of 17 gelatinase-positive patients (17.6%) and 13 out of 43 gelatinase-negative patients (30.2%) were confirmed dead within 90 days. We subsequently assessed whether the presence of fecal gelatinase could predict mortality of patients with alcohol-associated hepatitis. In our cohort, fecal gelatinase demonstrated poorer performance in predicting 30-day mortality compared with all other tested liver disease markers (FIB-4, ABIC score, Child-Pugh class, MELD, MELD-Na, and Maddrey’s DF), with a low AUC of 0.50 and low best Youden Index of 0.00 compared to the best performer FIB-4, which exhibited an AUC of 0.75 and best Youden Index of 0.54 (Figure 1C, Table 3). Fecal gelatinase also had a sensitivity of 0.29, specificity of 0.72, accuracy of 0.67, a positive predictive value (PPV) of 0.12, and negative predictive value (NPV) of 0.88 for 30-day mortality (Table 3). Similarly, its predictive performance was poor for 90-day mortality, with an AUC of 0.57 and best Youden Index of 0.13, whereas the FIB-4 and ABIC score displayed a significantly better AUC of 0.79 and 0.78 and higher best Youden Index of 0.49 and 0.63, respectively (Figure 1D, Table 4). Additionally, the Cox hazard ratio of death for gelatinase-positive vs gelatinase-negative patients was 0.6152, 95% confidence interval (0.1753, 2.159), p=0.448 for 30 days and 0.6389, 95% confidence interval (0.1818, 2.245), p=0.485 for 90 days.
TABLE 2. Number of gelatinase-positive and gelatinase-negative patients in each country.
Number
Spain
UK
France
Mexico
Canada
USA
Gelatinase positive
4
0
4
1
0
11
Gelatinase negative
2
12
4
2
6
19
–

FIGURE 1: Fecal gelatinase does not predict 30-day or 90-day mortality in patients with alcohol-associated hepatitis. (A) Kaplan-Meier curve for 30-day survival in gelatinase positive and gelatinase negative patients with alcohol-associated hepatitis. (B) Kaplan-Meier curve for 90-day survival in gelatinase positive and gelatinase negative patients with alcohol-associated hepatitis. (C) ROC curves of liver disease markers for 30-day mortality in patients with alcohol-associated hepatitis. (D) ROC curves of liver disease markers for 90-day mortality in patients with alcohol-associated hepatitis (Gelatinase n=60, Child-Pugh n=57, FIB-4 n=57, Maddrey’s DF n=52, ABIC n=59, MELD score n=59, and MELD-Na score n=59). ABIC, ‘Age, serum bilirubin, INR, and serum creatinine score’; FIB-4, Fibrosis-4 Index; INR, international normalized ratio; Maddrey’s DF, Maddrey’s Discriminant Function; MELD, model for end-stage liver disease; MELD-Na, sodium-adjusted model for end-stage liver disease; ROC, receiver operating characteristic.
–
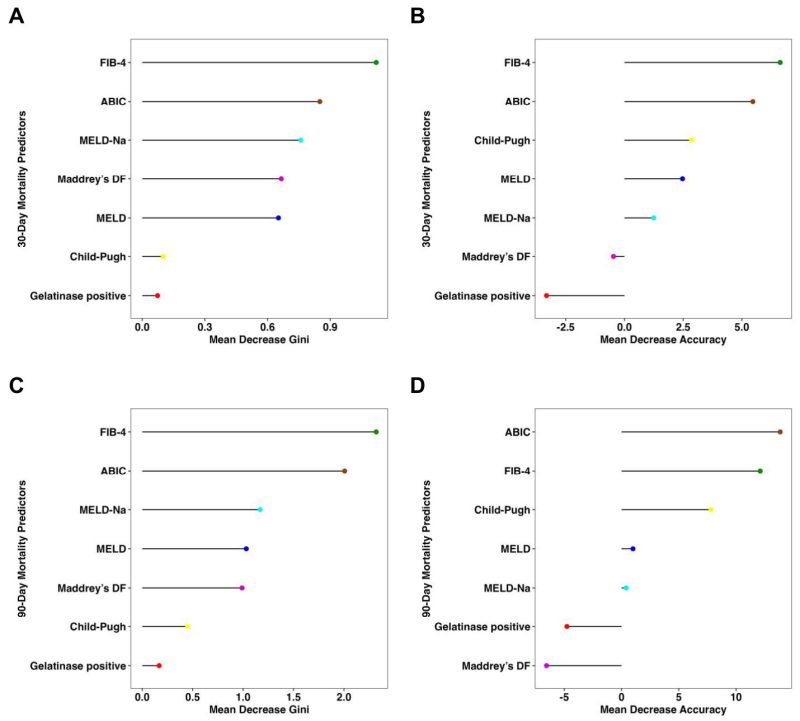
Consistent with the findings above, the presence of fecal gelatinase exhibited low feature importance for predicting both 30-day and 90-day mortality according to random forest analysis, with very low mean decrease Gini score and mean decrease accuracy when compared with other established liver disease markers (Figure 2). The FIB-4 and ABIC scores were the best predictors for 30-day mortality per mean decrease Gini (Figure 2A) and mean decrease accuracy (Figure 2B). FIB-4 also had the highest predictive value for 90-day mortality by mean decrease GINI (Figure 2C), whereas the ABIC score had the highest predictive value for 90-day mortality by mean decrease accuracy (Figure 2D).
TABLE 3. 30-Day Mortality Predictors.
Marker
AUC
Threshold
Youden
Sens
Spec
Acc
PPV
NPV
p
value vs Gel. AUC
Gelatinase
0.50
Presence
0.00
0.29
0.72
0.67
0.12
0.88
–
Child-Pugh
0.51
B
0.02
1.00
0.02
0.14
0.12
1.00
0.949
FIB-4
0.75
8.37
0.54
0.86
0.68
0.70
0.27
0.97
0.059
Maddrey’s DF
0.56
132.70
0.26
1.00
0.26
0.35
0.15
1.00
0.716
ABIC
0.68
7.83
0.52
1.00
0.52
0.58
0.22
1.00
0.214
MELD
0.58
23.94
0.29
0.71
0.58
0.59
0.19
0.94
0.690
MELD-Na
0.59
25.46
0.30
0.86
0.44
0.49
0.17
0.96
0.583
–

FIGURE 2: Fecal gelatinase is not an important feature for 30-day or 90-day survival in patients with alcohol-associated hepatitis per random forest analysis. (A) Mean decrease Gini score and (B) mean decrease accuracy for 30-day mortality by random forest analysis were quantitated for presence of gelatinase and multiple liver disease markers to determine their respective feature importance for mortality. (C) Mean decrease Gini score and (D) mean decrease accuracy for 90-day mortality by random forest analysis were quantitated for gelatinase and multiple liver disease markers to determine their respective feature importance for mortality (Gelatinase n=60, Child-Pugh n=57, FIB-4 n=57, Maddrey’s DF n=52, ABIC n=59, MELD score n=59, and MELD- Na score n=59). ABIC, ‘Age, serum bilirubin, INR, and serum creatinine score’; FIB-4, Fibrosis-4 Index; INR, international normalized ratio; Maddrey’s DF, Maddrey’s Discriminant Function; MELD, model for end-stage liver disease; MELD-Na, sodium-adjusted model for end-stage liver disease.
Fecal Gelatinase-Positive Patients do not Exhibit More Severe Liver Disease than Gelatinase-Negative Patients
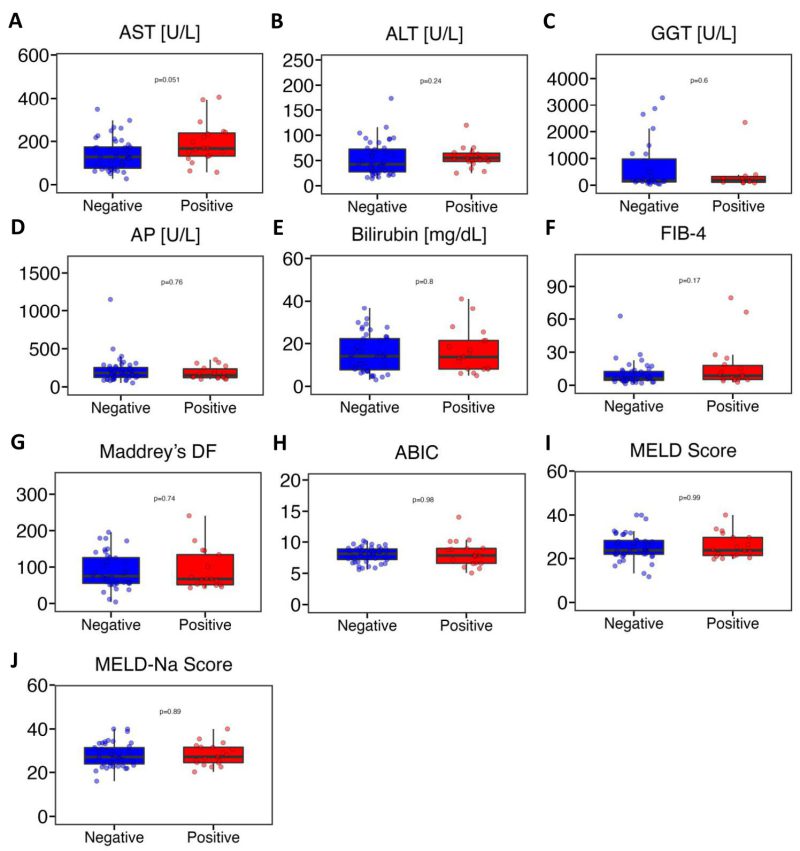
Next, we conducted a comprehensive comparison of various liver disease indicators between the gelatinase-positive and gelatinase-negative groups. The markers assessed included AST, ALT, GGT, AP, bilirubin, FIB-4, Maddrey’s DF, ABIC, MELD score, and MELD-Na score. Our analysis revealed no significant differences between the gelatinase-positive and gelatinase-negative groups (Figure 3). AST levels in gelatinase-positive patients were higher compared with gelatinase-negative patients but the difference was not statistically significant (medians of 167 U/L vs. 128 U/L, P = 0.051) (Figure 3A). The levels of ALT showed similarity between gelatinase-positive and gelatinase-negative patients (medians of 55.0 U/L vs. 42.5 U/L, P = 0.24) (Figure 3B). GGT levels were 189 U/L in gelatinase-positive patients and 162 U/L in gelatinase-negative patients (Figure 3C). The alkaline phosphatase and bilirubin levels between gelatinase-positive and gelatinase-negative patients were very similar (medians of 152 mg/dL vs. 181 mg/dL, P = 0.76, and medians of 13.7 mg/dL vs. 14.1 mg/dL, P = 0.80, respectively) (Figure 3D, 3E). The median value of FIB-4 was 8.64 in gelatinase-positive patients and 6.28 in gelatinase-negative patients. Additionally, the median values of Maddrey’s DF (67.1 vs. 71.7) and ABIC (7.84 vs. 8.12) were lower in gelatinase-positive patients compared with gelatinase-negative patients. Furthermore, the median values of MELD score and MELD-Na score between gelatinase-positive and gelatinase-negative patients were nearly identical (Figure 3F-J). Additionally, we found that seven out of 56 patients (30.4%) with MELD>20 were gelatinase-positive, compared with two out of eight patients (25.0%) with MELD of 20 or lower were gelatinase-positive (P = 0.76, Pearson’s Chi-squared test). Furthermore, ten out of 28 patients (35.7%) on steroids were gelatinase-positive, whereas nine out of 36 patients (25.0%) were not on steroids (P= 0.35, Pearson’s Chi-squared test). Additionally, four out of 15 patients (26.7%) on antibiotics were gelatinase-positive, compared with 15 out of 49 patients (30.6%) not on antibiotics (P = 0.77, Pearson’s Chi-squared test). Finally, we found that neither gender nor overweight or obesity were associated with gelatinase positivity (data not shown).
TABLE 4. 90-Day Mortality Predictors.
Marker
AUC
Threshold
Youden
Sens
Spec
Acc
PPV
NPV
p
value vs Gel. AUC
Gelatinase
0.57
Absence
0.13
0.81
0.32
0.45
0.30
0.82
–
Child-Pugh
0.58
C
0.15
0.81
0.34
0.47
0.32
0.82
0.877
FIB-4
0.79
7.75
0.49
0.80
0.69
0.72
0.48
0.91
0.019
Maddrey’s DF
0.59
48.08
0.23
1.00
0.23
0.42
0.30
1.00
0.574
Maddrey’s DF
0.59
51.98
0.23
0.92
0.31
0.46
0.31
0.92
0.574
ABIC
0.78
7.83
0.63
1.00
0.63
0.73
0.50
1.00
0.012
MELD
0.66
23.94
0.32
0.69
0.63
0.64
0.41
0.84
0.250
MELD-Na
0.67
24.67
0.36
0.94
0.42
0.56
0.38
0.95
0.214
–

FIGURE 3: Fecal gelatinase positive patients with alcohol-associated hepatitis do not have more severe liver disease than gelatinase negative patients. (A) AST (n=64). (B) ALT (n=63). (C) GGT (n=38). (D) AP (n=63). (E) Bilirubin (n=64). (F) FIB-4 (n=62). (G) Maddrey’s DF (n=56). (H) ABIC (n=64). (I) MELD score (n=64). (J) MELD-Na score (n=64). ABIC, ‘Age, serum bilirubin, INR, and serum creatinine score’; ALT, alanine aminotransferase; AP, alkaline phosphatase; AST, aspartate aminotransferase; FIB-4, Fibrosis-4 Index; GGT, gamma-glutamyltransferase; HE, hepatic encephalopathy; INR, international normalized ratio; Maddrey’s DF, Maddrey’s Discriminant Function; MELD, model for end-stage liver disease; MELD-Na, sodium-adjusted model for end- stage liver disease. P value of equal or less than 0.05 was considered as statistically significant.
DISCUSSIONThe development and exacerbation of alcohol-associated liver disease has been strongly linked to alterations in gut microbiota
Comments (0)