
Remember me

The study protocol was approved by the University of Vienna Ethics Committee (reference no. 00161) and the University of Southampton Ethics and Research Governance Office (reference no. 78743). All meta(data) were 100% anonymized and compliant with the University’s regulations. Human faecal samples were collected from 9 healthy adult individuals (3 males and 6 females between 22 and 39 years old) who had not received antibiotics in the previous 3 months and had no history of digestive disease. All study participants provided written informed consent and self-sampled using an adhesive paper-based faeces catcher (FecesCatcher, Tag Hemi) and a sterile polypropylene tube with the attached sampling spoon (Sarstedt). The participants did not receive any compensation to participate in this study.
Drug concentrations used for incubationsWe used two drug concentrations (low and high) of each drug for our incubations. The low drug concentration (ENT-Low or LOX-Low: 20 μM) was previously used in a screening aimed at determining drug effects on pure culture isolates, while the high concentrations (ENT-Hi: 1,965 μM, LOX-Hi: 100 μM) were based on estimated colon concentrations for each drug and were included to better reflect the exposure of gut microbes to these drugs in the large intestine1. The colon concentration estimated for entacapone is 1,965 μM (ref. 1), based on a typical oral dose of 200 mg, while for loxapine no estimate was available. We predicted that loxapine would reach similar colon concentrations as its chemical and therapeutic analogues amoxapine and clozapine, prescribed at similar doses (10–20 mg daily) and estimated to reach colon concentrations of 138 μM and 153 μM, respectively1. Using these values as a reference, we predicted that loxapine succinate should be present in the colon at concentrations of at least 100 μM and chose it as the LOX-Hi concentration. Both drugs are found in their parent form in human plasma samples54,55. Some drug metabolites have also been shown to be present, but these are largely products of liver metabolism56, which is an indication of low levels of chemical transformation of these drugs in the upper gastrointestinal tract before absorption.
Ex vivo gut microbiome incubations with drugsFor data shown in Figs. 1, 2 and 3, samples from 6 donors (2 males, 4 females, between 25 and 39 years old) were transferred into an anaerobic tent (Coy Laboratory Products) within 30 min after sampling, and all sample manipulation and incubations were performed under anaerobic conditions (5% H2, 10% CO2, 85% N2). Each sample was suspended in M9 mineral medium supplemented with 0.5 mg ml−1d-glucose (Merck), 0.5% (v/v) vitamin solution (DSMZ Medium 461) and trace minerals, herein referred to as sM9. Samples were suspended in sM9 to yield a 0.05 g ml−1 faecal slurry. At this point, one aliquot of each sample was collected, pelleted and stored at −80 °C for metagenomic analysis. The homogenate was left to settle for 10 min, and the supernatant (devoid of any large faecal particles) was transferred into a different flask where supernatants from the 6 different donors were combined. This combined sample was further diluted 1:10 in sM9 medium (as described above) or in supplemented brain heart infusion (BHI) medium containing either 0% or 55% D2O (99.9% atom % (at%) D, Merck) for a final 0% (control) or 50% D2O in the incubation medium (Fig. 1a). Supplemented BHI medium consisted of 37 g l−1 BHI broth (Oxoid), 5 g l−1 yeast extract (Oxoid), 1 g l−1l-cysteine (Merck) and 1 g l−1 NaHCO3 (Carl Roth). Incubation tubes were supplemented with dimethylsulfoxide (DMSO, Merck), entacapone (Prestwick Chemicals) or loxapine succinate (Prestwick Chemicals) predissolved in DMSO. The final concentration was 2% (w/v) DMSO in all vials (except for the H2O control, where water was added instead of DMSO). After short incubation times (6 and 24 h) under anaerobic conditions at 37 °C, samples were collected as detailed below and processed to determine: (1) changes in the total microbial loads; (2) microbial community profile dynamics based on 16S rRNA gene amplicon sequencing; (3) reconstructed microbial genomes based on long-read metagenomics and (4) single-cell microbial activity changes via tracing of the incorporation of deuterium from isotopically labelled heavy water (D2O) into single cells of microbiota by chemical imaging based on SRS32 (Fig. 1a).
At time 0 and after an incubation time of 6 or 24 h at 37 °C under anaerobic conditions, two sample aliquots from each incubation and from controls were collected by centrifugation. One aliquot was washed with 1× PBS and then fixed in 3% paraformaldehyde (PFA) solution for 2 h at 4 °C. Samples were finally washed twice with 1 ml PBS and stored in PBS:ethanol (50% v/v) at −20 °C until further use. The second pelleted aliquot was stored at −20 °C until further processing. A third aliquot was collected into sealed anaerobic vials containing 40% glycerol (Carl Roth) in PBS for a final 50% (v/v) cell suspension in 20% glycerol and stored at −80 °C until further use. In addition, amendment of ENT-Hi to 3 individual faecal samples (2 females and 1 male, average age: 26.3 years) and sample processing were carried out as described above, except that samples were not mixed before incubation (Extended Data Fig. 2).
For iron rescue experiments, fresh faecal samples received from 5 out of the 6 individuals that participated in the initial drug supplementation experiment (except for 1 male that was travelling at the time of the experiment) were collected and processed as described above. Donors were between 25 and 38 years old. To establish appropriate controls for imaging of entacapone bioaccumulation by microbiota cells, an aliquot of the freshly prepared 0.05 g ml−1 faecal slurry was immediately fixed with either 3% PFA solution or ethanol (50% v/v) at 4 °C for 2 h. Fixed faecal samples were washed with 1× PBS as described above and incubations with fixed samples and entacapone or entacapone:iron (see below) were conducted in parallel with incubations using live samples. Incubation vials were then supplemented with 2% (v/v) DMSO with or without 1,965 μM entacapone, in the presence or absence of supplemented iron (1 mM FeSO4, Merck; Fig. 5). Additional incubation vials (triplicates) were treated with entacapone pre-complexed with iron: briefly, entacapone and iron (FeSO4 or FeCl3) powder were mixed and resuspended in 2 ml DMSO, yielding a final concentration of 1,965 μM entacapone and 1 mM FeSO4 (or FeCl3), and stored overnight under anaerobic conditions. The next day, 120 μl of monobasic sodium phosphate (0.5 M) was added and the samples were mixed well. After 20 min, samples were centrifuged at 14,000 g for 5 min to remove unbound iron precipitated by the addition of sodium phosphate57. The supernatant containing the iron-complexed entacapone was collected into a new Eppendorf tube and supplemented to the faecal incubation vials. Incubations were sampled as described above.
Cell counts from ex vivo microbiome incubationsMicrobial loads in faecal incubation vials were determined using flow cytometry and counting beads as detailed below. Samples preserved in glycerol were diluted 200–800 times in 1× PBS (Supplementary Table 1). To remove any additional debris from the faecal incubations, samples were transferred into a flow cytometry tube by passing the sample through a snap cap containing a 35-μm-pore-size nylon mesh. Next, 500 μl of the microbial cell suspension was stained with the nucleic acid dye SYTO 9 (Thermo Fisher, 0.5 μM in DMSO) for 15 min in the dark. The flow cytometry analysis of the microbial cells present in the suspension was performed using a BD FACSMelody cell sorter (BD Biosciences), equipped with a BD FACSChorus software v.3.0 (BD Biosciences). Briefly, background signals from the instrument and the buffer solution (PBS) were identified using the operational parameters forward scatter (FSC) and side scatter (SSC). Microbial cells were then displayed with the same settings in a scatterplot using the forward scatter (FSC) and side scatter (SSC), and pre-gated on the basis of the presence of SYTO 9 signals (Extended Data Fig. 10). Singlets discrimination was performed. Absolute counting beads (CountBright, Thermo Fisher) added to each sample were used to determine the number of cells per ml of culture by following manufacturer instructions. Fluorescence signals were detected using the blue (488 nm, staining with SYTO 9 and CountBright beads) and yellow-green (561 nm, CountBright beads only) optical lasers. The gated fluorescence signal events were evaluated on the forward–sideways density plot to exclude remaining background events and obtain an accurate microbial cell count. Microsoft Excel v.16.87 was used for data sorting (Supplementary Table 1). Instrument and gating settings were identical for all samples (fixed staining–gating strategy), and gating strategy is exemplified in Extended Data Fig. 10.
Nucleic acid isolation and 16S rRNA gene sequencingPellets of microbiome incubation samples were resuspended in 600 μl of lysis solution RL (InnuPREP DNA/RNA mini kit, Analytik Jena) and subjected to bead beating for 30 s at 6.5 m s−1 in lysis matrix E (MP Biomedicals) tubes. After pelleting cell debris for 10 min at 8,000 g, supernatants were transferred into the InnuPREP DNA/RNA mini kit spin filter tubes (Analytik Jena), and DNA and RNA were extracted according to manufacturer protocol. Amplification of bacterial and archaeal 16S rRNA genes from DNA extracts was performed with a two-step barcoding approach (UDB-H12)58.
In the first-step PCR, the primers 515F59 (5′-GTGYCAGCMGCCGCGGTAA-3′) and 806R60 (5′-GGACTACNVGGGTWTCTAAT-3′), including a 5′-head sequence for 2-step PCR barcoding, were used. PCRs, barcoding, library preparation and Illumina MiSeq sequencing were performed by the Joint Microbiome Facility (Vienna, Austria) under project numbers JMF-2208-05 and JMF-2103-29. First-step PCRs were performed in triplicate (12.5 μl vol per reaction) with the following conditions: 1× DreamTaq buffer (Thermo Fisher), 2 mM MgCl2 (Thermo Fisher), 0.2 mM dNTP mix (Thermo Fisher), 0.2 μM of forward and reverse primer each, 0.08 mg ml−1 bovine serum albumin (Thermo Fisher), 0.02 U DreamTaq polymerase (Thermo Fisher) and 0.5 μl of DNA template. Conditions for thermal cycling were: 95 °C for 3 min, followed by 30 cycles of 30 s at 95 °C, 30 s at 52 °C and 50 s at 72 °C, and finally 10 min at 72 °C. Triplicates were combined for barcoding (with 8 PCR cycles). Barcoded samples were purified and normalized over a SequalPrep Normalization Plate kit (Invitrogen) using a Biomek NXP Span-8 pipetting robot (Beckman Coulter), and pooled and concentrated on PCR purification columns (Analytik Jena). Indexed sequencing libraries were prepared with the Illumina TruSeq Nano kit according to manufacturer instructions61 and sequenced in paired-end mode (2× 300 bp, v3 chemistry) on an Illumina MiSeq system following manufacturer instructions. The workflow systematically included four negative controls (PCR blanks, that is, PCR-grade water as template) for each 90 samples sequenced. The 16S rRNA gene sequences were deposited in the NCBI Sequence Read Archive (SRA) as BioProject Accession PRJNA1033532.
Analysis of 16S rRNA gene amplicon sequencesAmplicon pools were extracted from the raw sequencing data using the FASTQ workflow in BaseSpace (Illumina) with default parameters58. Demultiplexing was performed with the Python package demultiplex v.1.2.1 (Laros JFJ, github.com/jfjlaros/demultiplex) allowing one mismatch for barcodes and two mismatches for linkers and primers. DADA2 (ref. 62) R package v.1.16.0 (https://www.r-project.org/, R 4.0.2) was used for demultiplexing amplicon sequencing variants (ASVs) using a previously described standard protocol63. FASTQ reads were trimmed at 150 nt with allowed expected errors of 2. Taxonomy was assigned to 16S rRNA gene sequences on the basis of the SILVA taxonomy64 (release 138) using the DADA2 classifier.
Samples were analysed using the vegan (v.2.5-.6; https://CRAN.R-project.org/package=vegan) and phyloseq65 (v.1.30.0) packages in R (https://www.r-project.org/, R 4.0.2). For samples subjected to different drug treatments, sequencing in parallel with two extraction controls (without adding faecal samples) yielded 10 (control 1) and 189 reads (control 2). In control 1, 9 of the 10 reads were assigned to Cyanobacteria or chloroplast and were not detected in the samples. Likewise, in control 2, more than 90% of the reads originated from either Cyanobacteria ASVs or a single Comamonadaceae (Aquabacterium) not detected in any of the samples. These ASVs were removed from analysis. The remaining negative control reads (control 1: 1 read, control 2: 8 reads) were assigned to taxa typically found in the gut that were also detected in the samples and were therefore retained for subsequent analyses. We assumed these low number of reads to originate from a low level of cross-contamination that can occur when multiple samples are handled in parallel. After quality filtering and removal of contaminant sequences, a total of 1,132 ASVs were retained. The average read number per sample was 11,176 ± 3,087 high-quality sequences and sample coverage was above 98% (Supplementary Table 2). For alpha and beta diversity analysis, sequence libraries were rarefied to 4,681 reads per sample. For samples referring to the entacapone and iron supplementation experiment, sequencing in parallel with two extraction controls yielded 2 (control 1) and 134 reads (control 2). After quality filtering and removal of contaminant sequences (using the rationale described above), a total of 716 ASVs were retained. The average read number per sample was 18,733 ± 4,427 high-quality sequences and the sample coverage was above 99% (Supplementary Table 2). For alpha diversity analysis, sequence libraries were rarefied to 9,729 reads per sample. For quantitative microbiome analyses, relative abundances of each taxon in a sample were calculated after correcting for the different number of copies of the 16S rRNA gene, according to rrnDB (v.5.7). For this correction, we classified ASVs using DADA2 and the RDP66 taxonomy 18, release 11.5 (https://doi.org/10.5281/zenodo.4310151), by applying default parameters. These corrected relative abundances were then multiplied by the total microbial loads obtained from flow cytometry (Supplementary Table 1), yielding the total abundance of each taxon per sample.
DESeq2 (v.1.26.0)67 implemented in phyloseq was used to identify significant differences in ASV abundances between drug treatments. Only ASVs that had in total ≥10 reads (relative abundance microbial profile) or 5.0 × 10⁵ reads (quantitative microbial profile) were considered for comparisons by DESeq2 analyses. All statistical analysis of microbiome data was carried out in R (R 4.0.2). The applied significance tests and obtained P values are referred to in the main text and figure legends.
Long-read sequencingDNA for long-read sequencing was isolated using the DNeasy PowerSoil Pro kit (Qiagen), according to manufacturer instructions. A pool of 6 DNA extracts was prepared for sequencing using the ligation sequencing kit (SQK-LSK112, Oxford Nanopore) following manufacturer protocol. The DNA was sequenced on a Promethion P24 sequencing device (Oxford Nanopore) on an R10.4 flow cell (FLO-PRO112, Oxford Nanopore). The DNA sequencing was carried out using Minknow (v.21.10.8, Oxford Nanopore).
Shotgun metagenomic sequencingThe same 6 samples were individually sequenced in an Illumina Novaseq 6000 platform by the Joint Microbiome Facility (Vienna, Austria) under project number JMF-2110-04. The Illumina reads were trimmed using cutadapt (v.3.1)68. Illumina reads were mapped to the assemblies using Minimap2 (v.2.17)69.
Metagenomic analysisThe Nanopore reads were assembled using flye70 (v.2.9-b1768) with ‘–nano-hq’, polished three times with Minimap2 (v.2.17)69 and Racon (v.1.4.3)71, followed by two rounds of polishing with Medaka (v.1.4.4, github.com/nanoporetech/medaka). Illumina and Nanopore reads (Supplementary Table 7) were mapped to the assemblies using Minimap2 (v.2.17) and read mappings were converted using SAMtools (v.1.12)72. Read coverage and automatic binning was performed using MetaBAT2 (v.2.15)73. Contigs labelled as circular by the assembler were extracted as independent bins before the automated binning process. The quality of the recovered MAGs was checked using QUAST (v.5.0.2)74 and CheckM (v.1.1.1)75, and genomes were classified using GTDBtk (v.1.5.1)42. rRNA genes were detected using Barrnap (v.0.9, https://github.com/tseemann/barrnap) and transfer (t)RNA genes were detected using trnascan (v.2.0.6)76. MAGs with completeness >90% but where barrnap did not pick up a 5S rRNA gene were checked for 5S rRNA genes using INFERNAL (v.1.1.3)77. MAGs were searched for iron-related genes and gene neighbourhood protein orthologues using FeGenie (v.1.2)78.
All MAGs were searched for AMR and virulence genes using AMRFinderPlus (v.3.10.21)47, which identified genes encoding resistance to, among others, beta-lactams, tetracyclines, macrolides and aminoglycosides, as well as more general antimicrobial resistance genes such as efflux pumps and virulence genes (Supplementary Table 17). The AMR and virulence index (Fig. 6e) was calculated as follows: the total copies of AMR and virulence genes found to be present in each MAG were multiplied by the absolute abundance of the MAG (abundance of the ASV matching the 16S rRNA gene of the MAG) in the sample. The same was repeated for all MAGs for which AMRFinderPlus identified AMR or virulence genes and by summing these, we were able to predict the total number of copies of AMR and virulence genes for each sample, per ml of culture. The resulting values were then normalized to the total biomass per ml of each sample to obtain an AMR and virulence index per sample.
FISH probe design and optimizationPhylogenetic analysis and FISH probe design were performed using the software ARB (v.7.0)79. By analysis of the 16S and 23S rRNA gene, phylogenetic trees were calculated with IQ-TREE (v.1.6.12) using the RAxML GTR algorithm with 1,000 bootstraps in ARB80. For abundant groups, 4 FISH probes were designed for this study and 2 additional published probes were used (Supplementary Table 10). The probes were validated in silico with mathFISH to test the in silico hybridization efficiency of target and non-target sequences81,82. The number of non-target sequences was assessed using the probe match function in ARB and the mismatch analysis function in mathFISH. All probes were purchased from biomers (Biomers.net) and were double labelled with indocarbocyanine (Cy3) or sulfo-cyanine5 (Cy5) fluorochromes.
Pure cultures of Escherichia coli K12, P. dorei 175 (DSM 17855) and B. thetaiotaomicron VPI-5482 (DSM 2079) were grown in supplemented BHI until the mid-exponential phase and collected by centrifugation. Pure cultures were fixed for 2 h by addition of 3 volumes of 4% (w/v) PFA solution at 4 °C. After washing once with PBS, cells were stored in a 1:1 mixture of PBS and 96% (v/v) ethanol at −20 °C. Where pure cultures were not available, fixed faecal samples with a high relative abundance (as determined by amplicon sequencing) of the specific target taxon were used.
To evaluate probe dissociation profiles, cells obtained from fixed pure cultures or faecal incubation samples (Supplementary Table 10) were spotted onto microscopy slides (Paul Marienfeld). FISH was performed as described before81, with 3 or 5 h hybridization to obtain fluorescence signals with sufficient intensity. The optimal hybridization formamide concentration was found using formamide dissociation curves, obtained by applying a formamide concentration series in the range of 0–70% in 5% increments83. After a stringent washing step and counterstaining using 4′,6-diamidino-2-phenylindole, samples were visualized using a Leica Thunder epifluorescence microscope with an APO ×100/1.40 Leica oil immersion objective and the Leica Application Suite X software (LAS X 5.1.0). Probe EUB338 (ref. 84), which is complementary to a region of the 16S rRNA conserved in many members of the domain Bacteria, was used as a positive control, and a nonsense NON-EUB probe was applied to samples as a negative control for binding. Images for inferring probe dissociation profiles were recorded using the same microscopy settings and exposure times. The probe dissociation profiles were determined on the basis of the mean fluorescence signal intensities of at least 100 probe-labelled cells and evaluated using the ImageJ software (v.1.53t). From the calculated average values, a curve was plotted and the respective value right before a decline on each curve was defined as the optimal formamide concentration.
FISH in solutionFixed cells (100 μl) were pelleted at 14,000 g for 10 min, resuspended in 100 μl 96% analytical grade ethanol and incubated for 1 min at room temperature for dehydration. Subsequently, the samples were centrifuged at 14,000 g for 5 min, the ethanol was removed and the cell pellet was air dried. For SRS–FISH analysis, cells were hybridized in solution (100 μl) for 3 h at 46 °C. The hybridization buffer consisted of 900 mM NaCl, 20 mM Tris-HCl, 1 mM EDTA and 0.01% SDS, and contained 100 ng of the respective fluorescently labelled oligonucleotide as well as the required formamide concentration to obtain stringent conditions (Supplementary Table 10). After hybridization, samples were immediately transferred into a centrifuge with a rotor preheated at 46 °C and centrifuged at 14,000 g for 15 min at the maximum allowed temperature (40 °C) to minimize unspecific probe binding. Samples were washed in a buffer of appropriate stringency for 15 min at 48 °C, and cells were centrifuged for 15 min at 14,000 g and finally resuspended in 20 μl of PBS. Cells (5 μl) were spotted on poly-l-lysine-coated cover glasses no. 1.5H (170 μm ± 5 μm thickness, Paul Marienfeld) and allowed to dry overnight at 4 °C under protection from light. Salt precipitates were removed by dipping the coverslips twice in ice-cold Milli-Q water and the coverslips allowed to dry at room temperature under protection from light.
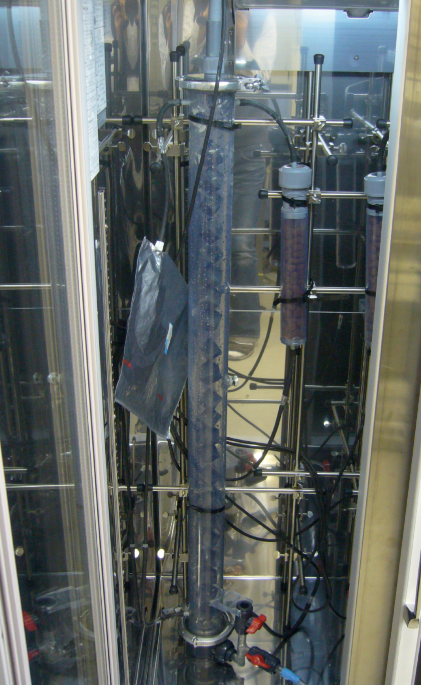
Picosecond SRS and microscopyIn complex microbial communities, all metabolically active cells will incorporate deuterium (D) from D2O present in the medium into their biomass during synthesis of new macromolecules29. The newly formed carbon-deuterium (C-D) bonds can then be used as a read-out of microbial activity. SRS efficiently excites the Raman active vibrational modes coherently with two synchronized ultrafast lasers and was employed to determine the presence of C-D bonds and thus, microbial activity. In the SRS set up employed, an 80-MHz pulsed laser (InSight DeepSee+, Spectra-Physics) emitting two synchronized femtosecond beams was used (Extended Data Fig. 3a). One beam was tunable in wavelength from 680 nm to 1,300 nm, while the other beam had a fixed wavelength of 1,040 nm. The time delay between single pulses of the two beams is adjustable by a motorized delay line on the 1,040 nm beam. To implement the picosecond (ps) SRS (Extended Data Fig. 3), the fixed beam (termed Stokes beam) was intensity modulated at 2.5 MHz by an acousto-optic modulator (1205c, Isomet Corporation) and co-aligned with the tunable beam (termed pump beam) by a dichroic mirror (DMLP1000, Thorlabs). Both beams were chirped by SF57 rods to 2-ps pulse width and directed towards the lab-built upright microscope frame. Then, a 4-focal system and a flip mirror conjugated a pair of galvo mirrors to the back aperture of a ×60 water objective (UPlanApo ×60W, 1.2 NA, Olympus) or a ×100 1.49 NA oil objective (UAPON 100XOTIRF, Olympus), allowing the collinear pump and Stokes beams to raster-scan the sample via synchronized movement of the galvo mirrors. A 1.4 numerical aperture oil condenser (Aplanat Achromat 1.4, Olympus) collected the output beams, which were then reflected by a flip mirror and filtered by a short-pass filter (DMSP950, Thorlabs). Finally, the filtered-out pump beam was focused onto a silicon photodiode connected to a resonant amplifier effective at a resonant frequency of ~2.5 MHz. The output alternative current signal was further amplified by a lock-in amplifier (UHFLI, Zurich Instrument) at the frequency and in phase (x channel detection) with the modulation. The output direct current signal was recorded for normalization. A data acquisition card (PCIe-6363, National Instruments) collected the output signal for image generation.
To perform widefield fluorescence imaging for FISH visualization of the identical sample areas analysed by SRS and photothermal imaging, two flip mirrors were flipped off (Extended Data Fig. 3a). A halogen lamp (12V100WHAL, Olympus) provided Kohler illumination of the sample from the condenser side. Then, the objective and the tube lens conjugated the sample plane to the camera (CS505CU, Thorlabs). To enable imaging of various fluorophores, different excitation and emission filter sets were inserted between the lamp and condenser, and in front of the camera. For Cy3 imaging, two 530/10 nm bandpass filters (FBH530-10, Thorlabs) were used as excitation filters and two 570/20 nm bandpass filters (ET570/20x, Chroma) were used as emission filters. For Cy5 imaging, two 640 nm bandpass filters (FBH640-10, Thorlabs) were used as excitation filters and two 670/20 nm bandpass filters (ET670/50 m, Chroma) were used as emission filters.
Photothermal imaging of entacapone accumulationBy utilizing the multiphoton absorption of entacapone at 10 mM, we detected the photothermal signal originating from optical absorption to generate entacapone distribution maps. A concentrated solution of entacapone was needed for a test and we chose 10 mM to provide a strong signal (Fig. 3a). The experimental setup was identical to picosecond SRS, but with detection of the lock-in signal by the y channel, which exhibits a π/2 phase delay relative to the intensity modulation by the acousto-optic modulator (Supplementary Text and Extended Data Fig. 6b). With this orthogonal phase detection, the interference of the photothermal signal with the signals emerging from cross-phase modulation and SRS was minimized (Extended Data Fig. 6d).
Image acquisition and processingSamples were prepared by drying fixed bacterial cells spotted onto poly-l-lysine-coated coverslips (VistaVision cover glasses, No. 1, VWR) in a 4 °C refrigerator and subsequent dipping into water three times to dissolve precipitates from the growth media. Then the bacteria were immersed in 5 μl of water and sandwiched by another coverslip with a 0.11-mm-thick spacer in between. To acquire deuterium incorporation profiles of microbiome members labelled by FISH probes, widefield fluorescence was performed first. For different fluorophores, corresponding excitation and emission filters were applied. The signal and colour gain of the camera were set to 5. Then the exposure time was adjusted to 0.5–5 s depending on the fluorescence signal intensity. The widefield transmission image was acquired by minimizing the condenser aperture and removing the filters.
To acquire the deuterium incorporation profile of the FISH-visualized cells, two flip mirrors were inserted into the beam path to guide the pump and Stokes lasers to the sample. Three SRS images, specific for Raman active vibrational modes of C-D bonds, carbon-hydrogen (C-H) bonds as well as the off-resonance background signal were recorded by tuning the wavelength of the pump beam to 849 nm, 796 nm and 830 nm, respectively. These wavelength values correspond to spectral wavenumbers of 2,163 cm−1 (C-D), 2,947 cm−1 (C-H) and 2,433 cm−1 (silent region). Signal intensities were accumulated over increments of 20 cm−1. Images were acquired sequentially within the identical field of view of 32 × 32 μm2 with a raster step size of 106.8 nm. The per-pixel dwell time was set to 10 μs and, depending on the signal intensity level, 1~10 image cycles were recorded to achieve a signal-to-noise ratio (SNR) of >5 for single bacterial cells in the C-H spectral region.
For acquisition of entacapone distribution maps, the pump laser was tuned to 849 nm and the signal detection was switched to the y channel of the lock-in amplifier. All images were recorded utilizing the identical scanning parameters as applied for SRS.
To process the image data sets: first, the illumination patterns were corrected for both widefield images (FISH) and point-scan images (SRS and entacapone distribution). Then, the widefield images and point-scan images were co-localized via a calibrated projective transform matrix. The fluorescence images were utilized to generate a single-cell mask for inference of the single-cell activity and the drug accumulation level. The single-cell activity is expressed as %CDSRS = (ICD−Ioff) / (ICD + ICH−2Ioff), where the symbols ICD, ICH and Ioff refer to the SRS signal intensities detected at the spectral positions assigned to C-D bonds, C-H bonds and the silent region (off-resonance background). All intensity values were normalized to the direct current intensity level detected at the photodiode. The relative entacapone accumulation level is expressed as the signal intensity level detected in the y channel of the lock-in amplifier. Intensity outliers (>mean ± 2s.d.) observed in the SRS signals and the photothermal signal of the human gut microbiome samples were rejected from the single-cell masks. This intensity threshold was set after testing and validation with independent samples32, as food residues can be distinguished on the basis of an irregular shape compared with cells, and by a stronger signal due to other absorption processes that will gradually decrease due to the degradation of the absorption component. All imaging data analysis was performed with CellProfiler v.4.2.6 and Matlab R2023a.
Bleaching of entacapone photothermal signalEntacapone has a contribution to the lock-in amplifier x channel measurement that affects accurate %CDSRS measurements. To measure the levels of entacapone signal and activity (%CDSRS) in the same cell, we implemented a protocol to bleach the photothermal signal of entacapone that enables subsequent accurate activity measurements (%CDSRS). After measuring the entacapone photothermal signal, cells in the same field of view were bleached by continuous laser scanning with the same power used for imaging (power on sample: 30 mW pump and 120 mW Stokes; dwell time: 10 μs; 800 frames scanned in 720 s). This resulted in a sharp drop of signal in the y channel, which plateaud at 500 s, indicating a drop in entacapone signal to levels below the limit of detection (Extended Data Fig. 7a). This bleaching resulted in a smaller but detectable drop in intensity in the x channel that reached a plateau at around the same time as the y channel (500 s; Extended Data Fig. 7b). SRS measured in the x channel signal in cells that were not exposed to entacapone remained constant throughout the entire bleaching process, indicating that the drop in the x channel in ENT-Hi cells is indeed driven by the entacapone bleaching (Extended Data Fig. 7c). After bleaching, the SRS intensity became independent of entacapone levels and could then be used to determine the levels of activity per cell (%CDSRS). Correlation between PT at %CDSRS was done in a mix of faecal samples (from 2 donors, 1 male and 1 female, age range 22–39 years) incubated with Ent-Hi and 50% D2O in sM9 medium.
Nanoscale secondary ion mass spectrometry (NanoSIMS) sample preparation and analysisAfter incubation, cell fractions of faecal samples and P. dorei were washed once in PBS, fixed in a 3% PFA solution at 4 °C for 2 h and then stored in a suspension of PBS and ethanol (1:1) at 4 °C. For sample preparation, each suspension was diluted in 150 µl ultrapure water and homogenized in a sonication bath (Sonorex-Super_RK-31, Bandelin) at 35 kHz twice for 30 s to separate single cells from cellular aggregates. Cells were then collected and concentrated by filtration on gold coated (film thickness 150 nm, obtained by sputter deposition) polycarbonate filters (GTTP type, 0.2 µm pore size, Millipore) to a density of 200–300 cells per 65 × 65 µm2. To remove PBS precipitates and residual ethanol, filters were washed with ultrapure water and air dried after spotting of the cell suspensions. The density and distribution of single cells was inspected by light microscopy utilizing air objectives. Appropriate regions for NanoSIMS analysis were marked by a laser microdissection microscope (Leica LMD 7000). Selected filter regions were attached to antimony-doped silicon wafer platelets (7.1 × 7.1 mm, Active Business) serving as sample carriers.
NanoSIMS measurements were conducted on a NanoSIMS 50L ion microprobe (Cameca) equipped with a Hyperion RF-Plasma O− ion source (Oregon Physics) at the Large-Instrument Facility for Environmental and Isotope Mass Spectrometry at the University of Vienna. Before data acquisition, analysis areas were presputtered by rastering of a high-intensity (500 pA beam current), defocused O− ion beam to an O− ion fluence of 2.6 × 10¹⁶ ions cm−2. Data were acquired as multilayer image stacks by repeated scanning of a finely focused O− primary ion beam (~100 nm probe size at 12 pA beam current) over areas between 50 × 50 µm2 and 65 × 65 µm2 at 512 × 512 pixel image resolution and a primary ion beam dwell time of 5 ms pixel−1. The detectors of the multicollection assembly were positioned for simultaneous detection of 12C+, 23Na+, 31P+, 40Ca+ and 56Fe+ secondary ions. The mass spectrometer was tuned to achieve a mass resolving power of >8,000 (according to Cameca’s definition) for detection of 56Fe+ secondary ions.
NanoSIMS images were generated and analysed with the OpenMIMS85 plugin v.3.0.5 in the image processing package Fiji (1.54g)86. All images were autotracked for compensation of primary ion beam and/or sample stage drift, and secondary ion signal intensities were corrected for detector dead time. For visualization of the iron distribution pattern between cells from individual samples, overlay images of the secondary ion signal intensities of 12C+ (shown on a grey scale) and 56Fe+ (shown on a rainbow colour scale) were generated (Fig. 5). Region of interest (ROI) specific numerical data evaluation was applied to display the relative iron content of single cells via normalization of the 56Fe+ signal intensity to the respective 12C+ signal intensity (Supplementary Table 18). ROIs were defined utilizing carbon as a reference element indicating biomass, visualized by the 12C+ secondary ion signal intensity distribution images. The presence of single cells was confirmed via their morphological appearance in the 23Na+ and 40Ca+ secondary ion maps.
Siderophore assayThe iron binding capacity of entacapone was tested using the SideroTec Assay (Accuplex Diagnostics), a colorimetric test for the detection of siderophores, following manufacturer instructions. Wells were read photographically and on a microplate reader at 630 nm wavelength (Multiskan GO microplate spectrophotometer, Thermo Fisher).
Measurement of Fe(II) using ferrozineThe ferrozine chromogenic method, in which ferrozine reacts with free divalent Fe to form a stable magenta complex species with a maximum absorbance at 562 nm (ref. 87), was used to determine the ability of entacapone to complex Fe(II) and to follow the presence of Fe(II) in incubations with entacapone. All solutions were prepared in degassed solvents or buffers to prevent spontaneous iron oxidation. To determine the ability of entacapone to complex Fe(II), FeSO4·7H2O (Carl Roth) was dissolved in distilled water to produce a 183.3 µM Fe(II) working solution. Ferrozine (BLD Pharmatech) was dissolved in distilled water to produce a 246.3 µM ferrozine working solution. Na2H2EDTA (Carl Roth) was dissolved in Tris-HCl buffer pH 7.5 to produce a 50 mM stock solution, and entacapone was dissolved in DMSO/water (1:1) to produce a 2 mM solution. Both Na2H2EDTA and entacapone were further diluted to the final concentrations shown in Extended Data Fig. 9a. A volume of 50 µl of Fe(II) working solution was then added to a 96-well plate, followed by addition of 50 µl of a chelator solution (diluted in water as needed). Ferrozine working solution (100 µl) was then added and the absorption was measured at 526 nm with a Tecan plate reader after 10 min of incubation. To determine the ability of pure DMSO to oxidize iron, FeSO4·7H2O (Carl Roth) was dissolved in pure DMSO (Merck) or water to produce 50 µM Fe(II) working solutions. Each solution was aliquoted into a 96-well plate and an equal volume of a 0.2 M ferrozine solution (and respective dilutions) was added. Absorption was measured at 526 nm with a Tecan plate reader after 10 min of incubation. Finally, to determine the oxidation of Fe(II) in sM9 media, a 1 mM FeSO4 stock solution was prepared by dissolving FeSO4·7H2O in sM9 media or water. After 1, 5, 10, 15 and 30 min of incubation at room temperature, 50 µl was added to a 96-well plate and diluted with 50 µl water. Ferrozine solution (100 µl, 2 mM) was added and the absorption was measured at 526 nm with a microplate reader (Tecan). For the immediate timepoint, 48.75 µl of sM9 media was added to a 96-well plate. Subsequently, 1.25 µl of a 40 mM FeSO
Comments (0)