Ethics statement
To ensure that animal experimental protocols adhered to scientific principles and humanity, all experiments using mice in vivo were performed with the supervision and approval of the Animal Ethics Committee of Dalian Medical University. (Doc. No. AEE24009)
Collection and analysis of data
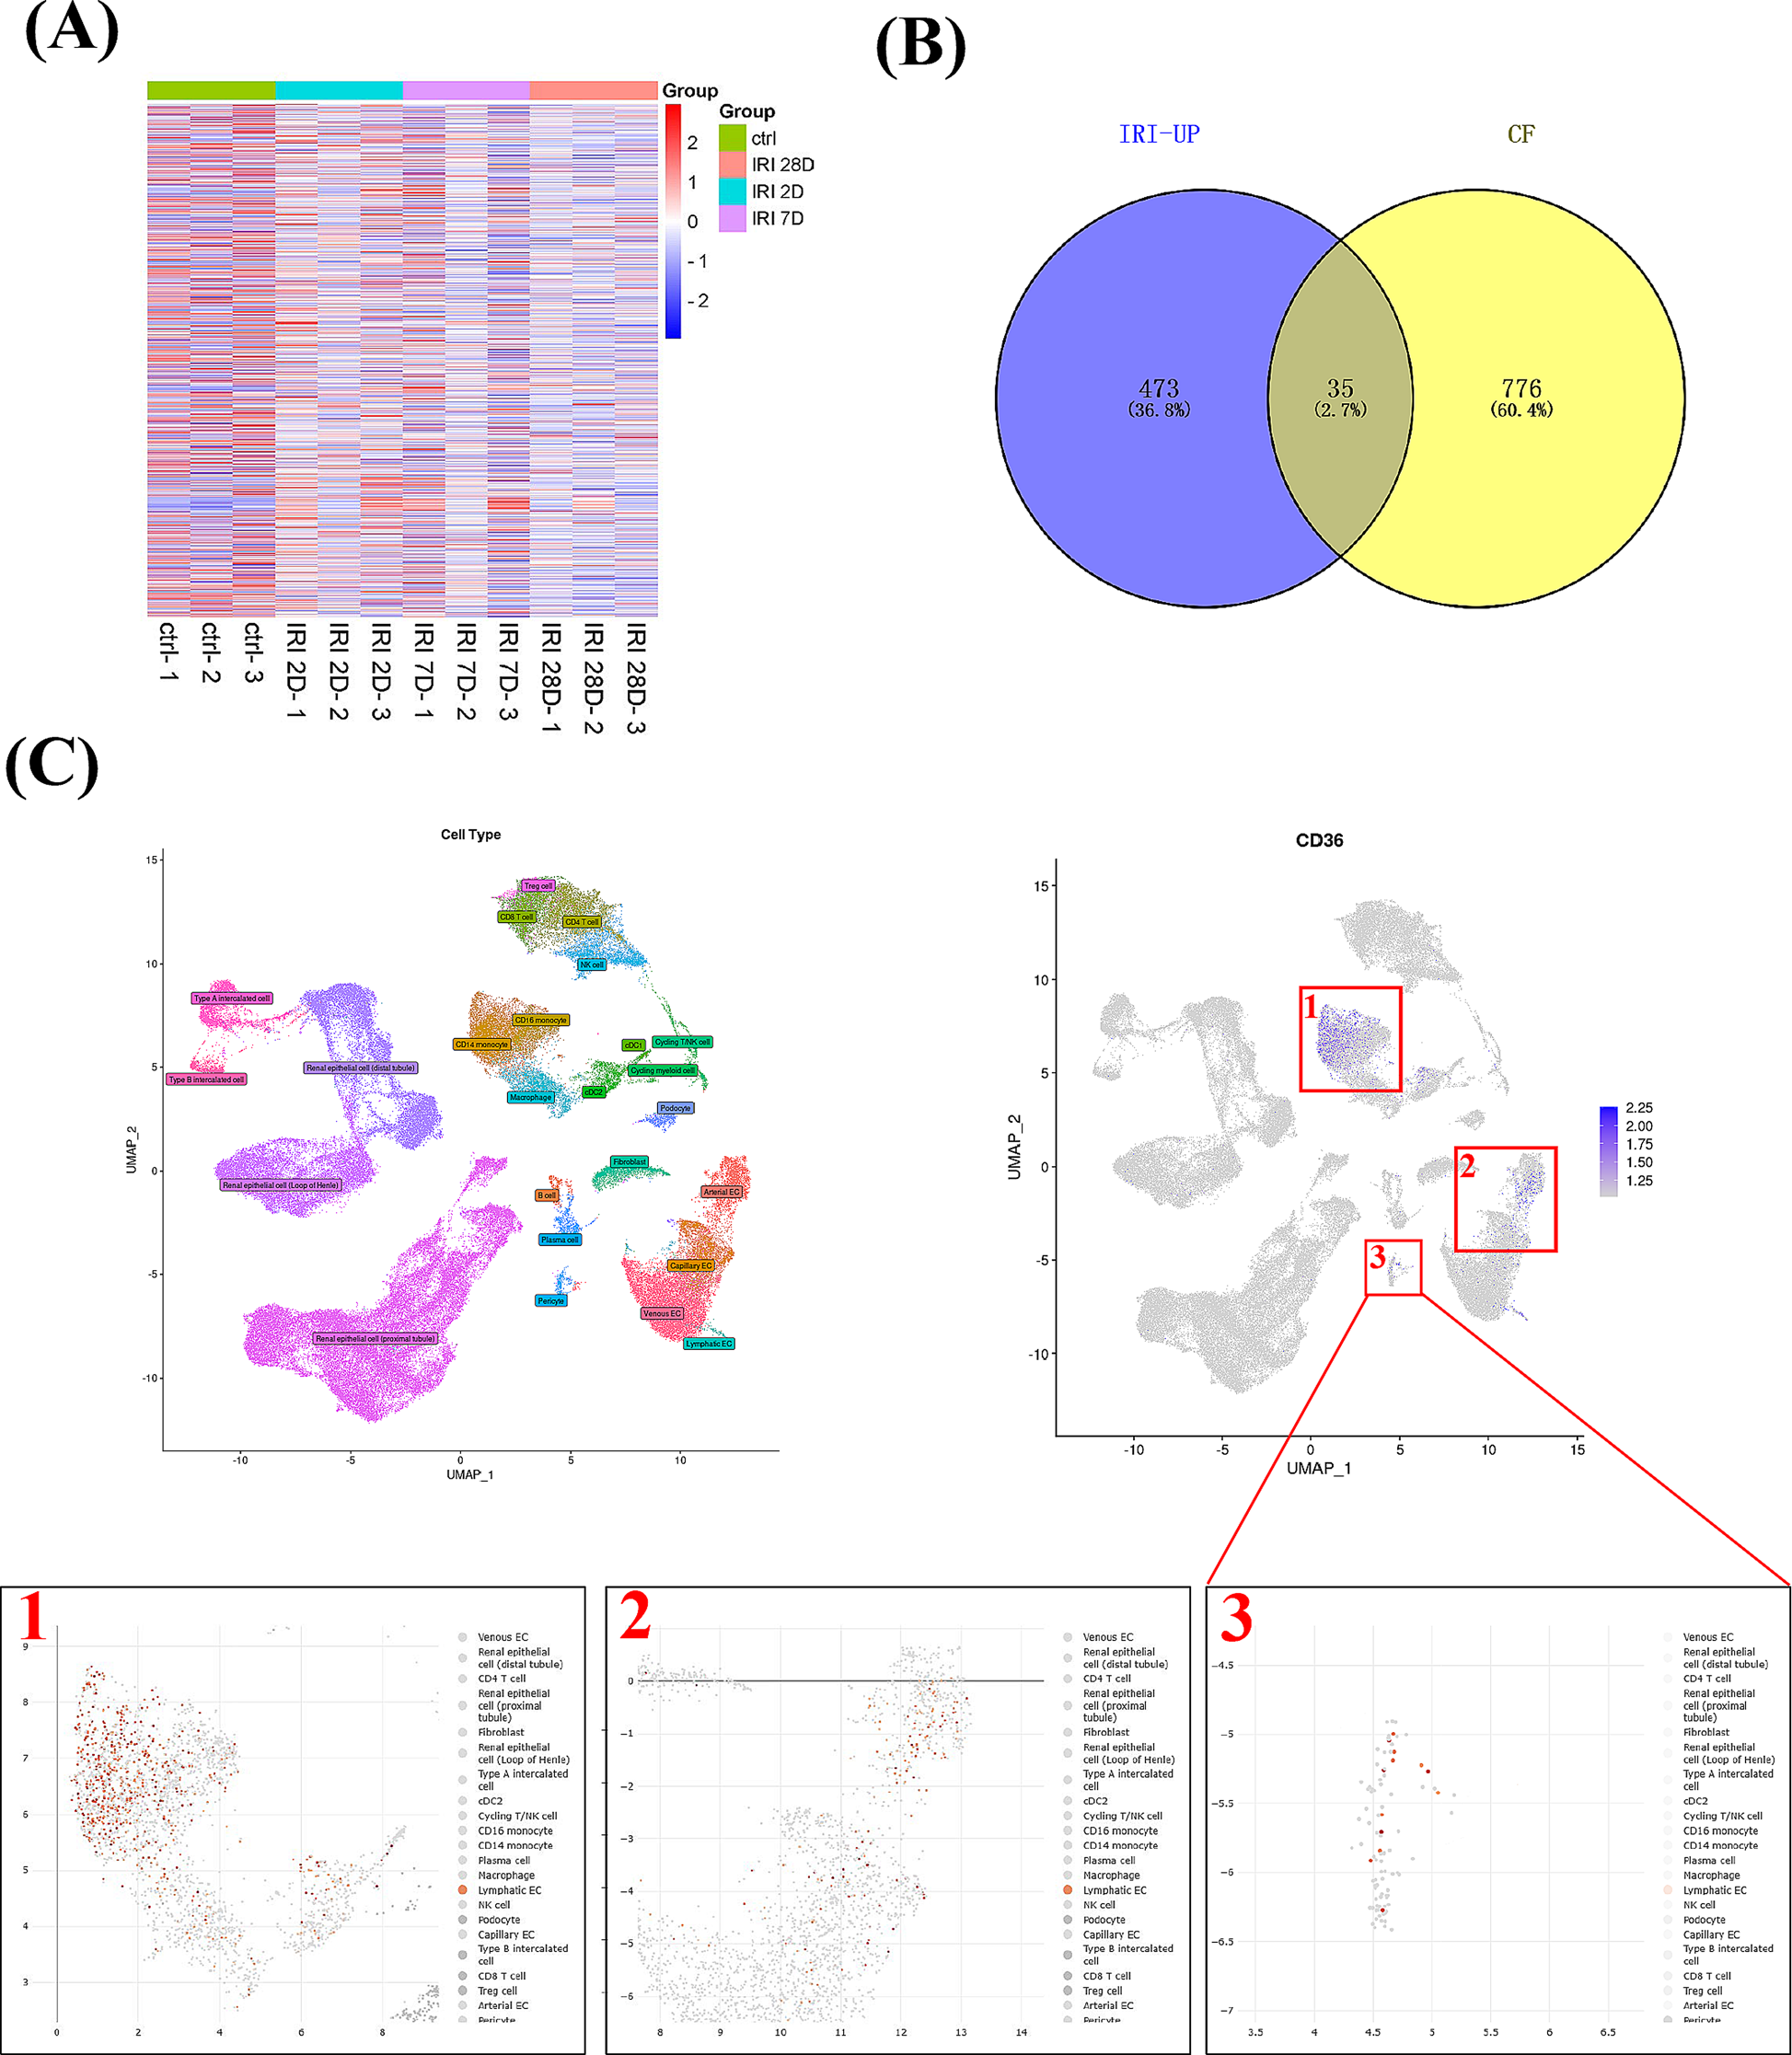
The GSE140988 dataset, a gene expression data focusing on pericytes from mice kidneys before or on day 2,7 and 28 after acute kidney injury, was sourced from the gene expression omnibus (GEO) database (https://www.ncbi.nlm.nih.gov/geo/). Fold changes of gene expression after normalization were calculated through the “limma” R package (R Core Team. 2020). Single-cell RNA sequencing data of kidney tissues was acquired and analyzed via the deeply integrated human single-cell omics database (DISCO) database (https://www.immunesinglecell.org).
Animals and renal ischemia-reperfusion injury model
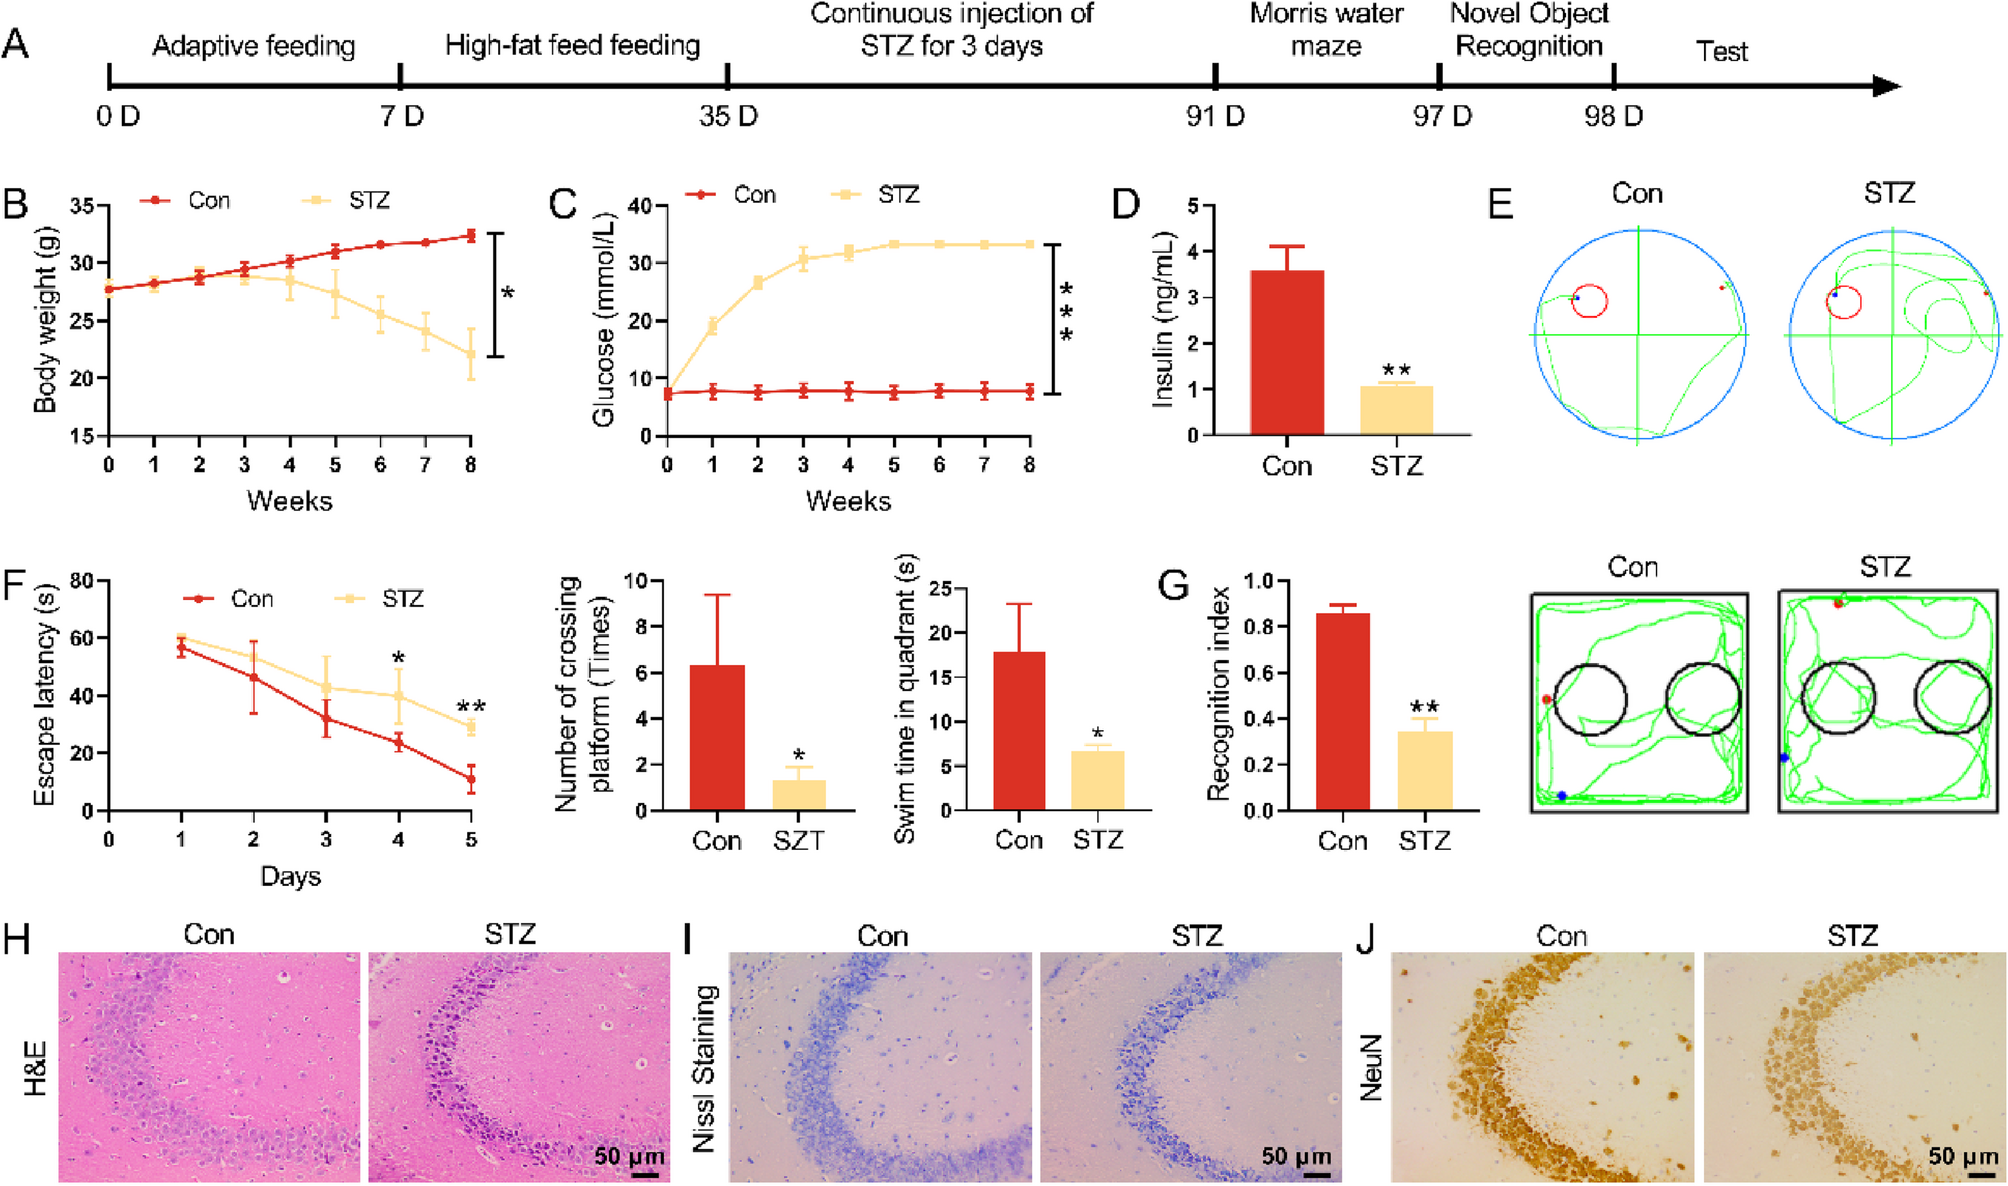
Wild-type male C57BL/6 mice aged 8–12 weeks and weighing 20–30 g were purchased from Liaoning Changsheng Biotechnology Co., Ltd. (Shenyang, China), they were all placed in a mouse-friendly environment with standard rodent chow and water provided by the Renal Pathology Center of the First Affiliated Hospital of Dalian Medical University. Animal surgeries were performed by the same surgeon under sterile conditions with most efforts made to reduce the suffering of animals. On a constant temperature blanket, the mice were induced by clamping bilateral renal pedicles for 55 min via a dorsal incision under sodium pentobarbital anesthesia to establish the acute kidney injury model. Mice were divided into Sham, ischemia-reperfusion injury (IRI) 2D, IRI 7D, and IRI 30D groups. The mice in the sham group only underwent skin and muscle incisions without renal pedicle clamping. Renal tissues and sera were collected subsequently.
Histological analysis
The harvested mouse kidneys were put in 4% paraformaldehyde, dehydrated, and packed in paraffin. Paraffin-embedded tissue was cut into slices using a paraffin slicer and attached to glass slides. Each section was first dewaxed and dehydrated with xylene and ethanol before staining with Masson’s Trichrome and Periodic Acid Schiff (PAS). Image acquisition was scanned on a 3DHISTECH Pannoramic Scanner (3DHISTECH, Budapest, Hungary).
Immunohistochemical analysis
Sections first underwent dewaxing and hydration, followed by antigen retrieval and quenching of endogenous peroxidase activity. After clearing in 0.01 M phosphate-buffered saline (PBS) and incubating in blocking buffer for 20 min, the primary antibodies were trickled to the sections and placed for one night at 4 ℃. Appropriate secondary antibodies were then applied. The color was developed using the substrate diaminobenzidine. Finally, dehydration and purification of slices were performed in 95% alcohol and xylene. Prepared sections were sealed in neutral gum for image acquisition.
Immunofluorescence (IF) staining
Paraffin sections were dewaxed and subjected to antigen retrieval in a microwave with citrate buffer (0.01 M citrate buffer, pH 6.0). At the same time, cells in twelve-well plates were incubated for 5 minutes in 0.5% Triton X 100 solution (Sigma, St. Louis, MO, USA) after being fixed in 4% paraformaldehyde for 30 min at 25℃. All samples were soaked with 10% blocking goat serum in PBS for 30 min at 25℃ before primary antibodies incubation at 4℃. The sections were returned to room temperature and added some fluorescently-labeled secondary antibodies next day. 4’,6-diamidino-2-phenylindole (DAPI) was used to label cell nuclei at the end. Photographs were captured using a confocal laser scanning microscope (SP8, Leica, Wetzlar, Germany).
Pericyte extraction from kidney tissue
Pericytes were extracted from C57/BL6 wild-type male mouse kidneys through dicing and digestion with liberase (0.5 mg/mL, Roche, Mannheim, Germany) and DNase (100U/mL, Roche) in Hank’s buffered salt solution at 37 °C for 45 min. Cells which were centrifuged and resuspended with Hank’s buffered salt solution were filtered (40 μm) and purified by gradient using a 42% Percoll solution. Then platelet derived growth factor receptor beta + (PDGFRβ+) cells were picked with the help of fluorescence-activated cell sorting (FACS) (FACSAria cell sorting, BD Biosciences, San Jose, CA, USA). Finally, pericytes were cultured in Dulbecco’s modified Eagle’s medium (DMEM)-F12 (Gibco Life Technologies, Grand Island, NY, USA) supplemented with 10% fetal bovine serum (FBS) and 1% penicillin/streptomycin (Gibco Life Technologies) in a normal incubator (37 °C, 5% CO2 atmosphere, 90% humidity). Pericytes in the first passage were used for the experiments. Pericytes cultured without FBS were subjected to simulated ischemia-reperfusion injury in vivo by exposure to hypoxic conditions in a hypoxic incubator for 24 h (94% N2, 5% CO2, and 1% O2) and reoxygenation for an additional 6–72 h.
SiRNA and overexpression (OE) plasmid transfection
Pericytes were transfected with designed CD36 and FUT8 siRNA or negative controls (NC) (Unibio, Chongqing, China) and overexpression or GFP (Green fluorescent protein) plasmid using lipofectamine 3000 reagents (L3000015, Invitrogen, Waltham, MA, USA). Briefly, cells were cultured in a complete DMEM/F12 medium without penicillin/streptomycin. Upon reaching 50% confluence, the Opti-MEM medium (31985070, Gibco) with the siRNA or the overexpression plasmid and 5µL of lipofectamine 3000 reagents was mixed into the cells. 6 h later, pericytes were switched back to complete DMEM/F12 medium and grown to 80% confluence.
Transmission electron microscopy (TEM)
TEM was employed to further detect mitochondrial morphology. Pericytes harvested by 0.25% trypsinization were soaked in 2.5% glutaraldehyde at 4 °C for at least one night and then incubated with 1% osmic acid for 2 h at 4 °C. Subsequently the dehydrated pericytes were embedded in EPON 812 (14130, Electron Microscopy Sciences, Hatfield, PA, USA) and sectioned into ultrathin slices which were stained with uranyl acetate dihydrate and lead citrate. Images were performed on a TEM (1400plus, Hitachi, Tokyo Japan).
Flow cytometry analysis
An annexin V alexa fluor647(AV)/propidium iodide (PI)/Apoptosis detection kit (KGA1101-100, KeyGENBioTECH, Nanjing, China) for flow cytometry was used to detect apoptotic pericytes. In short, cells were prepared by washing, digesting, and resuspension in binding buffer, followed by replenishment with 5 µL of Annexin V and 5 µL of PI for 15 min on ice in the dark room. At last, a 200ul binding buffer was added. The final inspection is carried out on a Navios Flow cytometer (Beckman Coulter, Indianapolis, IN, USA). Data were analyzed with FlowJo software (TreeStar, Ashland, OR, USA).
Deglycosylation for N-glycan analysis
According to the instructions of the N-glycosidase F kit (GE10001, Glpbio, Montclair, CA, USA), 10% NP-40 and N-glycosidase F (PNGase F) were added to pericyte lysates at 2 µL per 50 µg of cell lysates and incubated for 3 h at 37 °C. Then, the deglycosylated lysates were used for western blotting (WB) using corresponding antibodies to assess the effects of deglycosylation.
Real-time fluorescence quantitative reverse transcription PCR (RT-qPCR)
Total RNA was extracted from pericytes according to the TRIzol reagent’s (Invitrogen) protocol. Reverse transcription was performed by the FastKing cDNA First Strand Synthesis Kit (Genome-free) (TIANGEN, Beijing, China). The real-time quantitative polymerase chain reaction was carried out with the help of a Talent Fluorescent Quantitative PCR Kit (SYBR Green) (TIANGEN) on the 7500 FAST Real-Time PCR system (Thermo Fisher Scientific, Waltham, MA, USA). Relative CD36 expression was normalized to glyceraldehyde-3-phosphate dehydrogenase (GAPDH) expression using the ΔΔCt method (Livak and Schmittgen 2001). The several primer sequences used were: CD36, F5′-ACAGTCTCTTTCCTGCAGCC-3′; R5′-CTGCCACAGCCAGATTGAGA-3′; GAPDH, F5′-AGGTCGGTGTGAACGGATTTG-3′; R5’-TGTAGACCATGTAGTTGAGGTCA-3′.
Western blotting
Protein expression in kidneys and pericytes was detected by western blotting. Cell or tissue lysates were denatured by heating at 99 °C for 5–10 min with sodium dodecyl sulfate-polyacrylamide gel electrophoresis (SDS-PAGE) loading buffer. The separated protein on 10% SDS-PAGE gels was transferred onto polyvinylidene fluoride membranes. After blocking with gelatin blocking solution in PBST (PBS with 0.1% Tween20) buffer for 2 h at 25 °C. Every membrane was probed with appropriate primary antibodies at 4 °C for 12 h. Afterwards, excess solution on the membranes was washed three times for 10 min each time in PBST buffer followed by incubation with horseradish peroxidase (HRP)-conjugated antibodies at 25℃ for 1–2 h. Different protein bands were then colored using ECL Western Blotting Substrate (Millipore, Billerica, MA, USA). Quantification of protein expression levels was performed by Image J software.
Immunoprecipitation (IP)
Protein A/G PLUS-Agarose (Santa Cruz Biotechnology, Santa Cruz, CA, USA) was used to pre-purify proteins. Tissue lysates (500 µg) were mixed with anti-CD36 (Proteintech, Rosemont, IL, USA) or normal rabbit IgG (A7016, Beyotime, Haimen, China) and put in the incubator shaker (60 rpm) for one night at 4 °C. Protein-antibody complexes were captured using 20 µl of Protein A/G PLUS-Agarose in the incubator shaker (60 rpm) for another night at 4 °C. They were washed with precooled PBS containing 1 mM phenylmethylsulfonyl fluoride the next day. Equal amounts (5 µL/lane) of proteins were used for western blotting, which could be separated and analyzed by SDS-PAGE.
Renal function evaluation
Serum creatinine (SCr) levels were assessed utilizing Creatinine (Cr) Assay kit (C011-2-1, Nanjing Jiancheng, Nanjing, China). Blood urea nitrogen (BUN) was quantified utilizing Urea Assay Kit (C013-2-1, Nanjing Jiancheng, Nanjing, China).
Antibodies
The primary and secondary antibodies used were as follows: anti-CD36 (Santa Cruz Biotechnology; sc-7309, 1:1000 for WB 1:50 for Immunohistochemical (IHC), 1:50 for IF, and 1:100 for IP), anti-dynamin-related protein 1 (DRP1) (Abcam, Cambridge, MA, USA; ab156951, 1:1000 for WB), anti- optic atrophy protein 1 (OPA1)(Abcam, ab119685, 1:1000 for WB), anti-PDGFRβ (Abcam, ab32570, 1:1000 for WB,1:200 for IF), lectin enrichment assay (LCA)-Biotin (Vector Labs, Newark, CA, USA; B-1045, 1:200 for IP), anti-GAPDH (CST, Danvers, MA, USA; 2118, 1:1000 for WB), anti-alpha smooth muscle actin (α-SMA) (Abcam, ab124964, 1:1000 for WB, 1:200 for IHC, 1:200 for IF), anti-Collagen I (Abcam, ab138492, 1:200 for IHC, 1:200 for IF), anti-Fibronectin (Abcam, ab2413, 1:200 for IHC, 1:200 for IF), anti-NG2 (Abcam, ab275024, 1:200 for IF), anti-FUT8 (Biorbyt, Wuhan, China; orb627158, 1:1000 for WB), anti-rabbit IgG, HRP-linked antibody (ZSGB-Bio, Beijing, China; ZB-2301, 1:5000 for WB), and anti-mouse IgG, HRP-linked antibody (ZSGB-BIO, ZB2305, 1:5000 for WB).
Mitochondrial membrane potential assessment
The mitochondrial membrane potential of pericytes was measured through the JC-1 Assay Kit (C2006, Beyotime). Pericytes were incubated with JC-1 working solution and MitoTracker RED (C1035, Beyotime) for 30 min at 37 °C. Then the liquid was replaced with a fresh culture medium. Confocal laser scanning microscope (SP8, Leica) was used to capture images.
Statistics
Data are shown as the mean ± SD. The probability (p) values of each experiment were analyzed and plotted in the figure legends with the convenience of GraphPad Prism software (GraphPad Inc., La Jolla, CA, USA). Parametric data’s comparison was performed using two-sample independent t-tests or one-way ANOVA with post-hoc Dunnett or Bonferroni corrections. A p-value < 0.05 was considered statistically significant.


Comments (0)