
Remember me


Mungbean (Vigna radiata L. Wilczek) is a crucial summer season legume crop predominantly grown across tropical and subtropical regions of Asia. Its significance lies not only in its high nutritional value but also in its adaptability to diverse agro-climatic conditions. Globally, mungbean holds substantial agricultural importance with an annual production of approximately 6.0 million tons, which comes from an area of about 7.3 million hectares (Gayacharan et al., 2023). India stands out as the largest producer, contributing up to 41% of the global mungbean production, followed by Myanmar, Bangladesh and Pakistan (Schreinemachers et al., 2019). The short growing season of 65–90 days makes mungbean an ideal crop for multiple cropping systems prevalent in South and Southeast Asia (Lambrides and Godwin, 2007). Additionally, as a leguminous crop, mungbean plays a vital role in nitrogen fixation, thus enhancing soil fertility and breaking pest and disease cycles in cereal-based cropping patterns. Intercropping mungbean with cereals has been shown to significantly boost the yield of companion crops (Rachaputi et al., 2002). However, despite its immense significance, mungbean cultivation faces numerous challenges, particularly from environmental stressors such as drought, heat, and waterlogging. Among these, heat stress poses a significant threat to mungbean productivity, with temperatures exceeding 25°C at night adversely affecting pollen viability (Kumar et al., 2013). Although the mungbean plant is adapted to tropical and sub-tropical climatic conditions, prolonged atmospheric temperature rise above 40°C is very detrimental especially during flowering and pod development stages leading to substantial yield losses (Bhandari et al., 2016). The warmer temperature can also exacerbate pest and disease problems in mungbean crops. Insects such as the mung bean weevil (Callosobruchus spp.) and pathogens like mungbean yellow mosaic virus (MYMV) may become more prevalent. However, to a certain extent, mungbean production can be sustained by using the available mungbean variability in the genebank collections.
The crop genetic diversity is the key to sustainable crop improvement programs that allow researchers to develop new cultivars with improved yield, and tolerance to biotic and abiotic stresses. Mungbean genetic diversity primarily evolved in the Indian subcontinent as India is the center of its origin (Vavilov, 1926; Zukovskij, 1962). In the Indian sub-continent, the mungbean diversity is widely distributed from the foothills of the Himalayas to the Southern Peninsula and northeastern regions. The conservation efforts of the mungbean genetic diversity have led to ex-situ collections of over 43,000 mungbean accessions conserved worldwide (Gayacharan S. et al., 2020). As the mungbean has evolved in diverse climatic zones and food taste preferences, its rich genetic diversity is playing crucial roles in crop improvement programs. Genebank collections from ICAR-NBPGR, New Delhi, The World Vegetable Centre, Taiwan, and the U.S. Department of Agriculture (USDA), United States has played significant roles in crop improvement (Wang et al., 2018; Gayacharan et al., 2020). The ex-situ mungbean collections have been analyzed to understand the magnitude and nature of genetic diversity available in mungbean (Bisht et al., 1998; Schafleitner et al., 2015; Wang et al., 2018; Gayacharan et al., 2020), as well as utilized for identification sources for biotic and abiotic stress tolerance. Although limited studies have been done for the improvement of mungbean for heat stress tolerance, promising accessions for heat stress attributing traits are identified (Bhardwaj et al., 2023). Large-scale studies for germplasm evaluation against heat stress tolerance are still lacking.
Although, it is established across the plant species that in response to heat stress, plants deploy various defense mechanisms, unlike other major crops, mungbean lacks comprehensive molecular resources, such as identified QTLs, genes, and gene regulatory factors, related to heat stress tolerance. To date, only a few molecular studies have been conducted to elucidate the mechanisms underlying heat stress resilience in the crop. Notably, the upregulation of heat shock proteins (HSPs), antioxidant enzymes, osmoprotectants and signaling molecules plays a crucial role in mitigating the adverse effects of heat stress (Wang et al., 2004; Li et al., 2019). Transcriptomic studies have identified several heat-responsive genes in mungbean, including those encoding HSPs, late embryogenesis abundant (LEA) proteins, reactive oxygen species (ROS) enzymes and osmoprotectants such as proline and glycine-betaine (Li et al., 2015; Gupta et al., 2022). Albeit, advances in understanding the physiological and molecular responses of various crops to heat stress, there remains a gap in knowledge regarding genotype-specific responses in mungbean to elevated temperatures. Given the genetic diversity within mungbean germplasm, different genotypes may exhibit varying degrees of heat tolerance and employ distinct mechanisms to cope with heat stress. Therefore, comprehensive studies investigating the effect of heat stress on physiological parameters and related gene expression in different mungbean genotypes are essential for the identification of new sources of heat stress tolerance, which may further help in elucidating the underlying mechanisms of heat stress tolerance in mungbean.
In this context, the present study was aimed to investigate the effect of heat stress on morphological and physiological parameters in eighty-seven diverse mungbean genotypes. By employing a multifaceted approach integrating physiological, biochemical and molecular analyses, this study revealed the genotype-specific adaptive responses in response to heat stress in mungbean. Some mungbean genotypes also showed superior heat stress response, which were further validated using key candidate genes involved in the physiological processes. Results obtained from this study are expected to be useful in breeding strategies aimed at developing heat-tolerant mungbean varieties, thereby contributing to sustainable agricultural practices and food security in regions prone to heat stress.
2 Materials and methods2.1 Plant material and field trialPlant materials comprised of 87 mungbean genotypes, which were grown during the summer season in the first week of April 2022, when day/night temperatures at the reproductive stage were >40/28 C (sown in such a way that the reproductive stage coincided with heat stress periods). The experiment was conducted at the National Bureau of Plant Genetic Resources, New Delhi, India (28° 34′47″N; 76° 50′52″E) India. The basic passport information on tested mungbean genotypes is presented in Table 1. The mungbean genotypes used in this study were obtained from ICAR-NBPGR Gene Bank in New Delhi, India. Genotypes were selected with similar maturity duration (70–75 days in this experiment), so exposure of heat stress is synchronized at the reproductive stage of each genotype. The field experiments were done in a randomized complete block design (RCBD) in two replications in each season. Four check mungbean varieties viz., SML668, IPM-99-125, Pusa Vishal and Virat were used. These varieties were selected as checks in this experiment as these are known for their heat stress tolerance nature and are recommended for summer cultivation in different parts of India (Tiwari and Shivhare, 2019). Each plot consisted of double rows of 3 m in length. Rows were spaced at 30 cm and interplant distance was 10 cm. Two trials were conducted during the “summer season (SS)” and “rainy season (RS).” The heat tolerance of mungbean germplasm was determined by measuring leaf area, chlorophyll content, MSI, pollen viability, number of pods per cluster, 100 seed weight, number of pods/plant, number of seeds/pod and grain yield/plant.
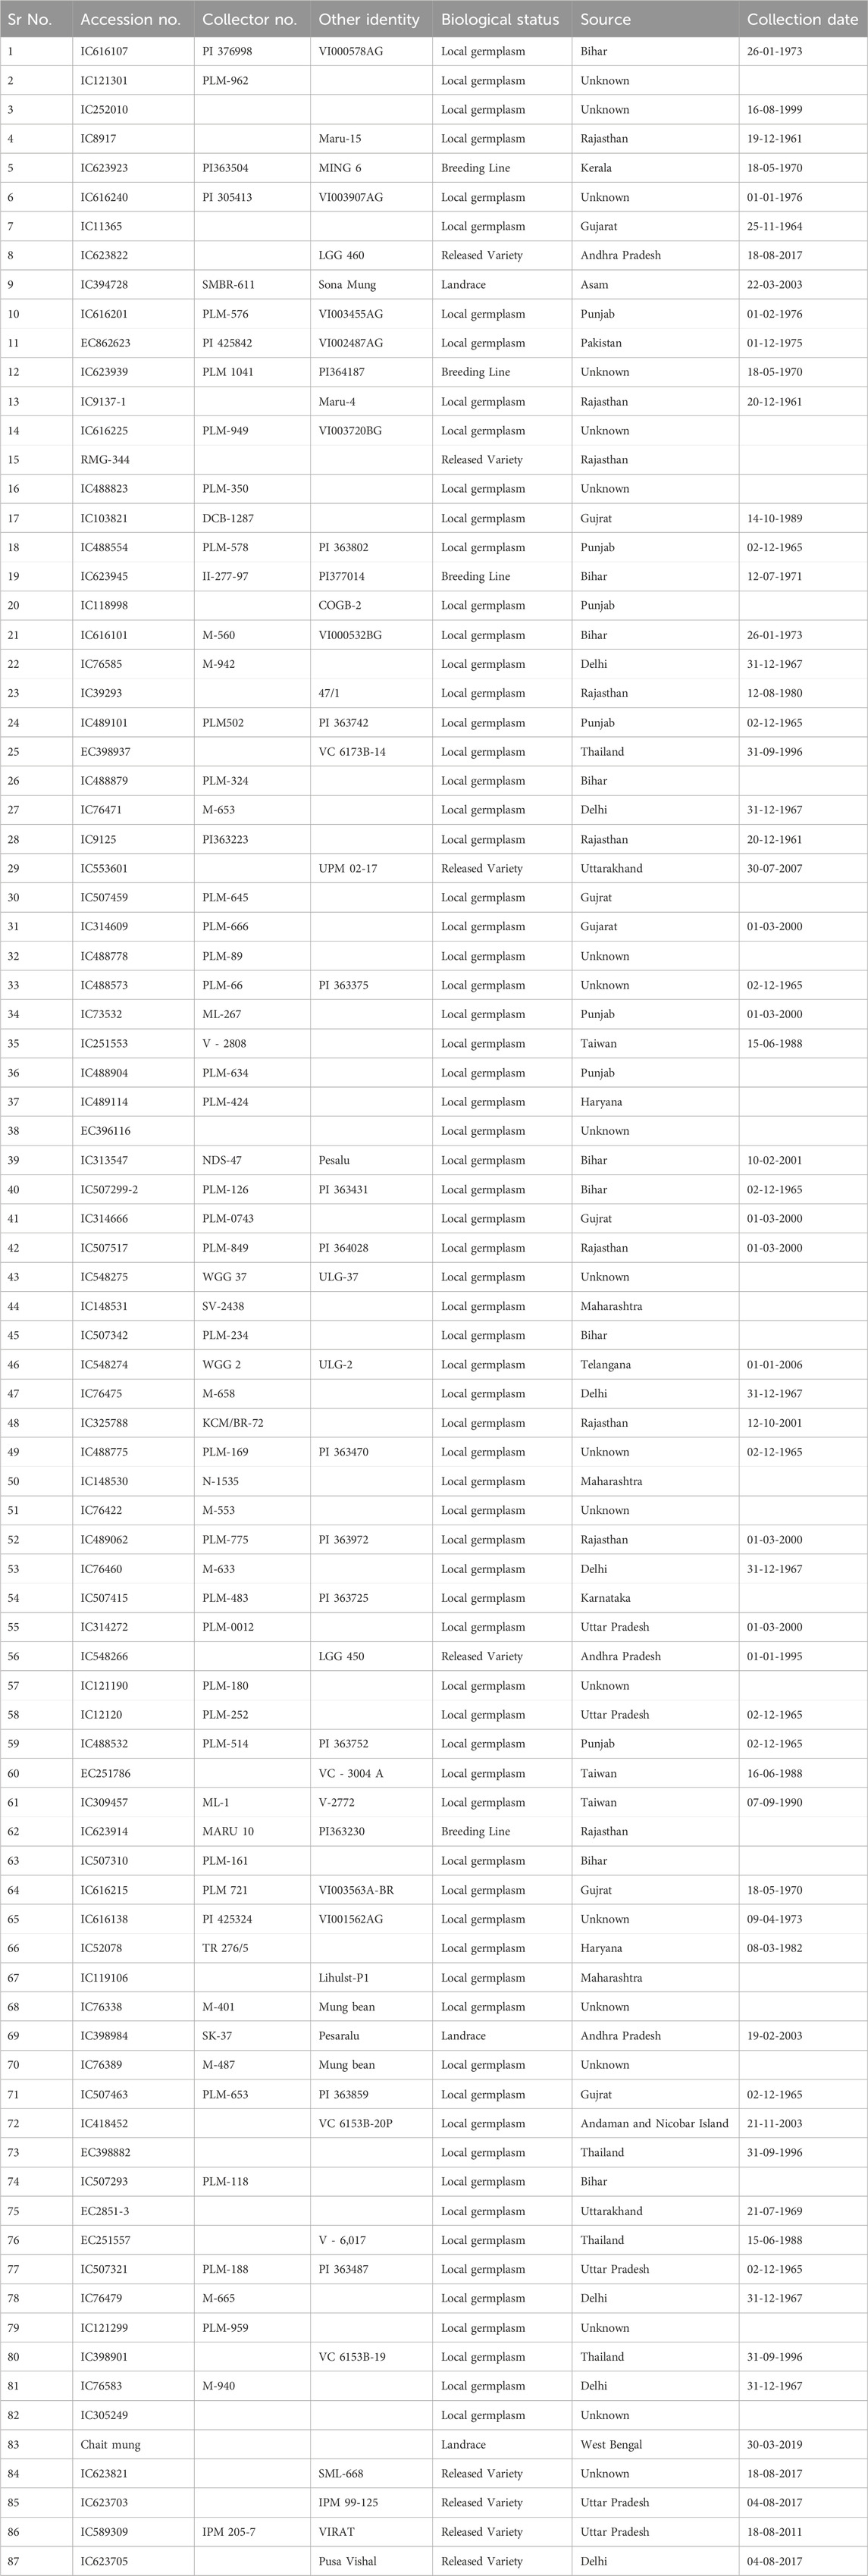
Table 1. List of accessions used in this study with biological status, source, and collection date.
2.2 Meteorological dataWeather data for the New Delhi Area location for both the seasons viz. RS and SS was recorded throughout the growing period by the meteorological observatory available at the location (Supplementary Material; Figure 1).
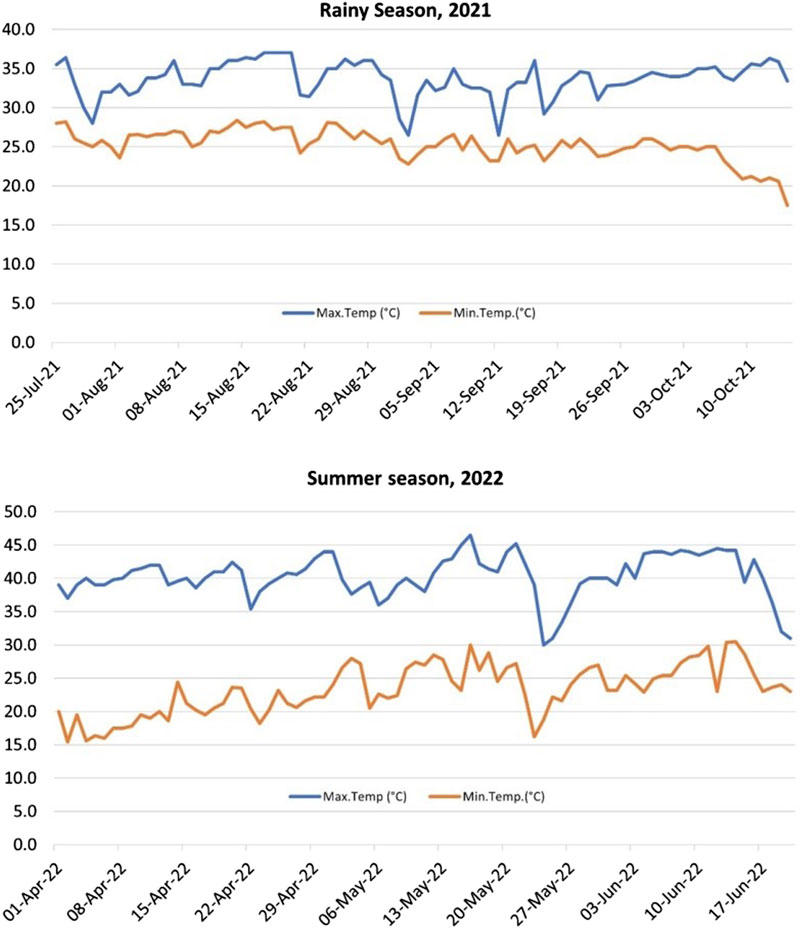
Figure 1. Atmospheric temperature profile for the rainy season (RS), 2021 and summer season (SS), 2022 of the experiments. The average maximum day temperature for SS was significantly higher (40.3°C) than the RS (33.6°C).
2.3 Physio-morphological traitsThe morphological and physiological parameters were taken at the appropriate plant growth stage, between flowering initiation to maturity of genotypes. To measure leaf parameters such as leaf area, chlorophyll content, membrane stability index (MSI) and stomatal conductance, young and fully developed leaves were marked in each genotype. Similarly, for pollen viability assessment fully developed flower buds about to open were selected. To measure the number of pods per cluster the central branch of three plants from each genotype were selected. Three random plants were used to count number of pods/plant and number of seed/pod. 100-seed weight and grain yield/plant were other morphological parameters estimated from each replication. The SPAD chlorophyll meter reading (SCMR) was used as an indicator of leaf chlorophyll content. The SPAD value of a marked leaf in each line was recorded between 10.00 and 11.00 a.m., using an Apogee-SPAD meter. The stomatal conductance was measured using SC-1 Leaf Porometer (METER Group, Inc.). The membrane stability index (MSI) was calculated using the method given by Lutts et al. (1996). In this process, three young leaves were collected from all genotypes is thoroughly washed with distilled water. The leaf tissues are then placed in 10 mL of distilled water at 40°C for 30 min and electrical conductivity readings are recorded (C1) using a conductivity meter. The same samples are subsequently subjec€ted to boiling water at 100°C for 10 min and readings are recorded again (C2). The percentage of membrane stability index (MSI %) is calculated using the formula MSI%=1−C1C2×100 with the units expressed as a percentage. For the examination of pollen viability, the percentage of viable pollen grains is determined using either a 0.5% acetocarmine solution or the Alexander triple stain (ATS) solution described by Alexander (1969). Heat susceptibility index (HSI) was estimated for seed yield/plant using the formula HSI=1−YsiYpi/1−YsYp as suggested by Fischer and Maurer (1978). Where, Ysi and Ypi are yield/plant under heat stress and control conditions respectively, while Ys and Yp are the mean yield of all genotypes under heat stress and control conditions.
2.4 Validation of promising heat stress tolerant mungbean genotypes under an artificially controlled environment using qRT-PCRSeven mungbean genotypes were selected based on the field evaluation data on morphological and physiological performance under heat stress (SS) and normal control (RS) environments. Seven mungbean genotypes used for key candidate gene expression analysis using qRT-PCR analysis included three heat tolerant (IC76475, IC418452, IC489062), two heat-sensitive genotypes (IC616138, IC548275) and two control check cultivars (SML668, IPM99-125). The check varieties SML-668 and IPM 99-125 were selected as they were found superior among all the four check varieties used in this study. These genotypes were grown in plastic pots (8 inch radius) containing soil and fertilizer mix. Randomized complete block design was used for both heat-treated and control plants. The experiment was conducted in the control environment chambers of the National Phytotron Facility of ICAR-IARI, New Delhi. The initial growth conditions were set as 28°C temperature and 16-h light/8-h dark photoperiod conditions. After 3 weeks of the growth period, heat stress treatment of 40°C was given. The day temperature was 40°C and the night temperature was 28°C. The leaf samples from both treatments were collected in liquid nitrogen for the candidate gene expression analysis.
2.5 RNA isolation, cDNA synthesis and qRT-PCR analysisTotal RNA was isolated from treated and untreated mungbean seedling samples using the TRIAZOL method. The first strand synthesis was carried out from control and stressed plant samples using a Thermoscientific RevertAid first-strand cDNA synthesis kit. The samples were mixed through pipetting and centrifuged briefly in a micro-centrifuge, then tubes were incubated in a thermal cycler for 1 h at 42°C. After finishing the reaction time, tubes were immediately kept on ice for termination of the reaction. Later, 30 µL RNase free water was added to dilute the cDNA and stored at −20°C or instantly started the second-strand cDNA synthesis. The primers for key candidate genes known to play a significant role in heat stress tolerance were taken from the published research works (Table 2).
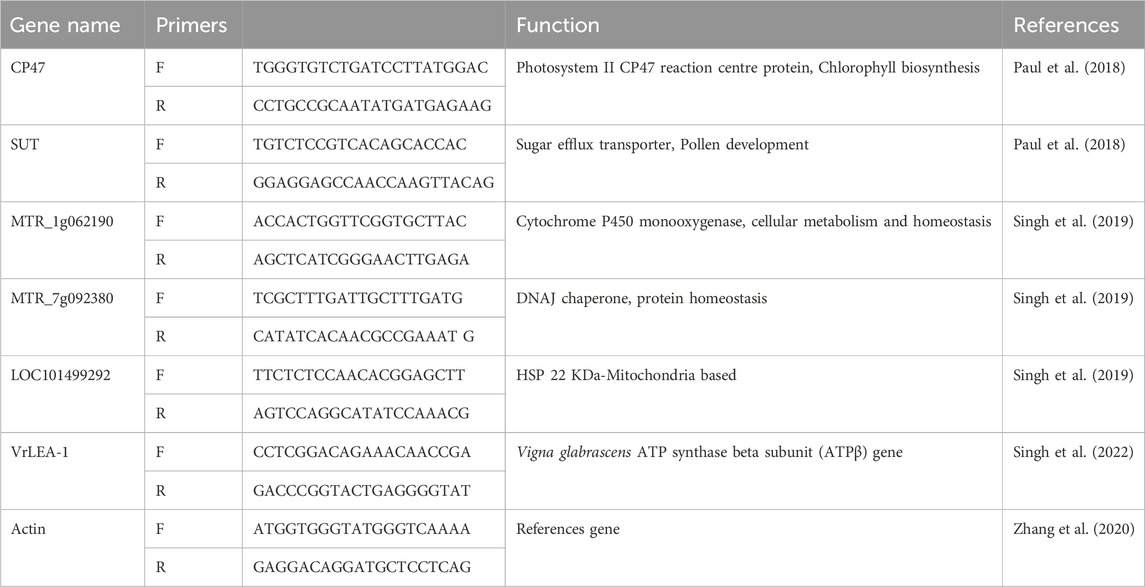
Table 2. List of primers of key candidate genes used for the analysis of their expression using qRT-PCR.
The key candidate genes involved in heat stress defense mechanisms were identified through the literature search based on the criteria of their potential roles in regulating physiological and phenotypic traits in Vigna or any other legume crops. From this, six key candidate genes were selected for qRT-PCR analysis, meeting the criteria of relevance and successful PCR amplification (Table 2). The gene expression quantification was done using SYBR® Premix kit in Light Cycler 480® Real-Time PCR System (CFX96 Real-time PCR system). For each sample, three biological replicates were used and three technical replicates were kept for each biological replicate. Actin was used as a housekeeping gene for the RT-PCR. The thermal cycler conditions included initial denaturation at 95°C for 2 min and 40 amplification cycles. Each amplification cycle included denaturation at 95°C for 20 s, primer annealing at 60°C for 35 s, and extension at 72°C for 30 s. To identify non-specific amplification the melt curve analysis was done with a gradual temperature increase of 1°C/s from 60°C to 95°C. Analysis of qRT-PCR data was carried out based on the quantification of cycle (Cq) values from each well. The resulting data was calculated by the 2-(ΔΔCT) method (Schmittgen and Livak, 2008). The log2-fold change of 2-(ΔΔCT) values used to quantify the gene expression in response to heat stress treatments for each candidate gene. A t-test was used to calculate statistical significance using SPSS software (Park, 2009). The qRT-PCR results were used to compare the expression level of six key candidate genes (listed in Table 2). The enhanced expression of these genes helps plants to combat heat stress. Therefore, these genes were used to validate their role in the selected mungbean genotypes including three heat tolerant, two susceptible, and two check varieties of mungbean. The qRT-PCR results helped in the validation of mungbean genotypes as heat stress tolerant.
2.6 Statistical analysisMicrosoft Excel was used for arranging the raw data and conducting calculations for the mean and standard deviation of both the control group and each treatment trait. The statistical analysis in this research was performed using R version 4.0.4 and SAS 9.4 software. For cluster analysis package “cluster” used which facilitates in various cluster analysis, including hierarchical clustering. The “gplots” R package enhances the graphical representation of data, offering functions for constructing dendrograms. Other packages include “corrplot” and “Hmisc” for correlation studies. The “FactoMineR” and “factoextra” packages are instrumental in creating biplots, particularly in principal component analysis (PCA). In SAS, the “proc glm” procedure used for analysis of variance (ANOVA), providing an ANOVA table to assess group mean differences. The “means” statement with the “tukey” option in “proc glm” used for Tukey post hoc test, generating p-values for pairwise comparisons, essential for identifying significant differences among treatment groups.
3 Results3.1 Physiological changes of mungbean genotypes under heat stressA significant amount of variation in response to heat stress was observed for morphological and physiological characteristics such as number of pods/plant, number of pods/cluster, number of seed/pod, MSI, chlorophyll content, pollen viability %, 100 seed weight (Table 3; Figure 2). The promising genotypes under RS and SS conditions superior to the check variety are shown in Table 3).
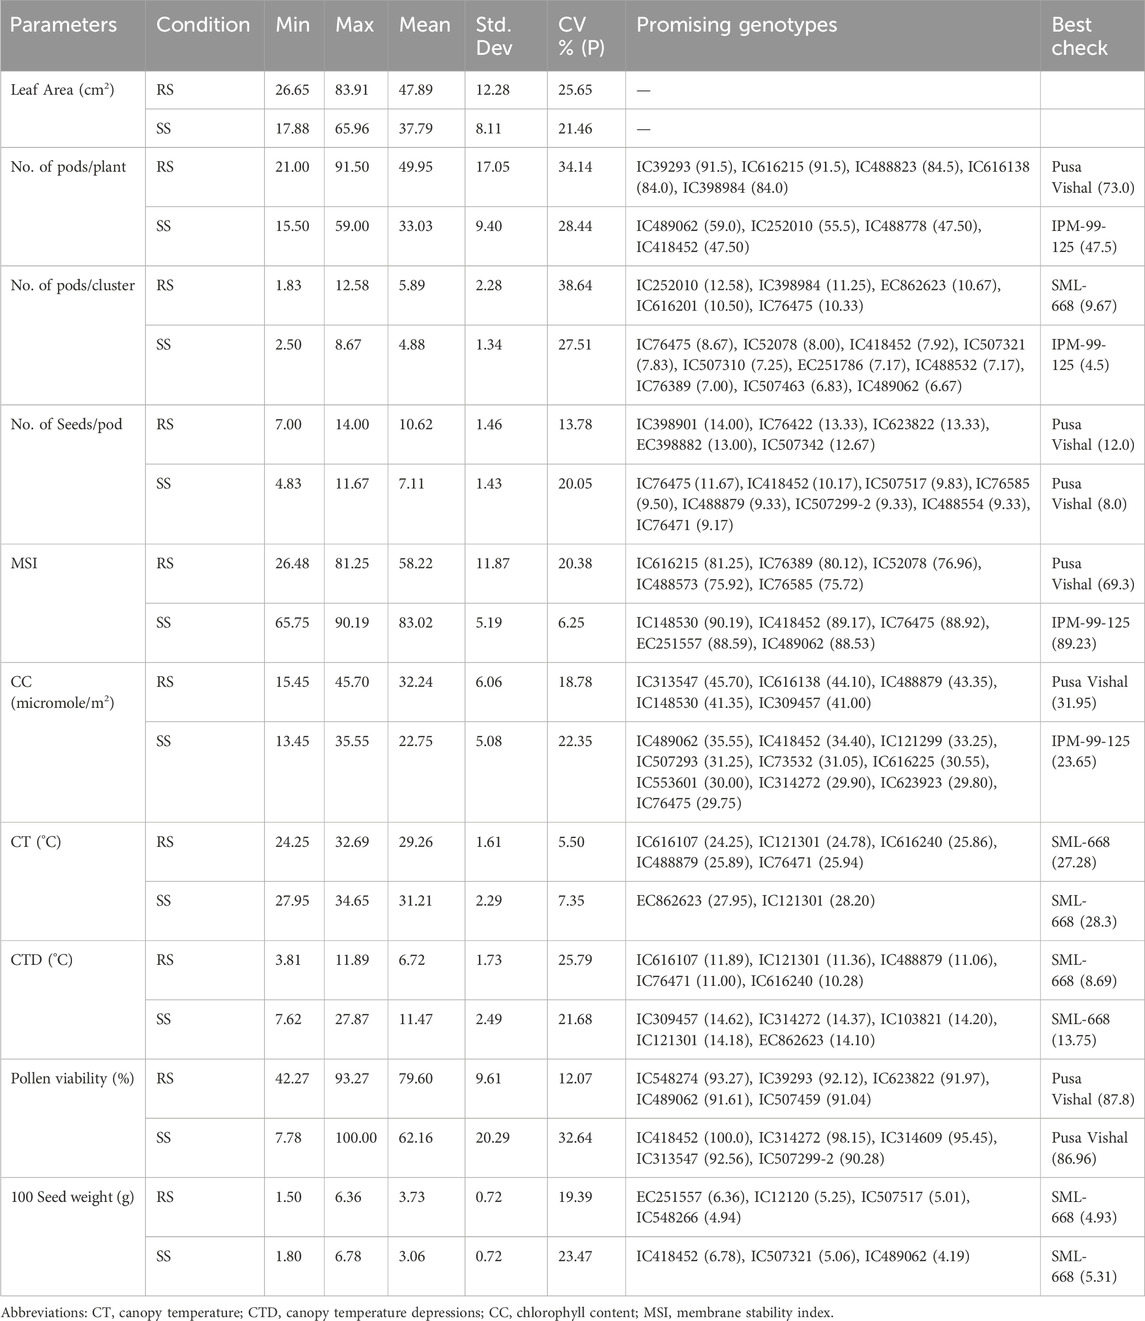
Table 3. Summary statistics of morpho-physiological parameters and promising mungbean genotypes under RS and SS conditions.
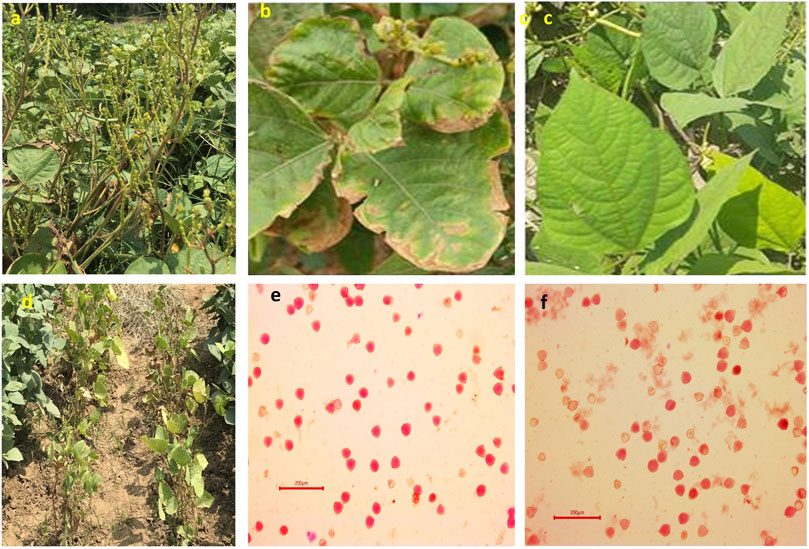
Figure 2. Typical morphological symptoms in mungbean plants in response to heat stress for various mungbean plant parts such as severe flower drop in susceptible mungbean genotype (A); SML668, a check variety used in this experiment showed leaf margin burning (B) under SS condition, and no symptom of leaf burning (C) under RS conditions; effect of heat stress on heat-sensitive genotypes showing poor plant growth and leaf burning (D) under SS conditions. Photographs showing comparative higher pollen viability in IC76475, a tolerant mungbean genotype (E), and low pollen viability in IC616138, a susceptible genotype (F) under SS conditions.
Significant deviations in morphological characteristics are observed across the mungbean genotypes under heat stress (SS) in comparison to normal sown (RS) environment conditions (Figure 3). Although a significant amount of variation was observed for the traits studied in both the environments, i.e., RS and SS, a reduction in the amount of variation is observed in the SS environment for all the traits, except for the number of seeds/pod and pollen viability % (Table 3). It is also observed that each genotype follows its own distinct mechanism of heat stress tolerance, as observations on multiple parameters revealed that no individual genotype is superior for all the parameters (Table 3). However, superior genotypes are observed for most of the traits. A notable reduction in leaf area, along with the appearance of associated morphological symptoms such as wilting and scorching was observed in the SS environment. Under RS condition the higher leaf areas were recorded in mungbean genotypes viz., IC103821 (83.90 cm2), IC623914 (79.54 cm2) and IC9125 (78.31 cm2). While, in SS condition the maximum leaf areas were observed in mungbean germplasm lines viz., IC623914 (65.95 cm2), IC507415 (57.78 cm2) and IC418542 (52.68 cm2). Among check varieties, SML-668 exhibited superior performance in both seasons for the leaf area. Similarly, superior mungbean germplasm lines are identified for other traits also as mentioned in table 3.
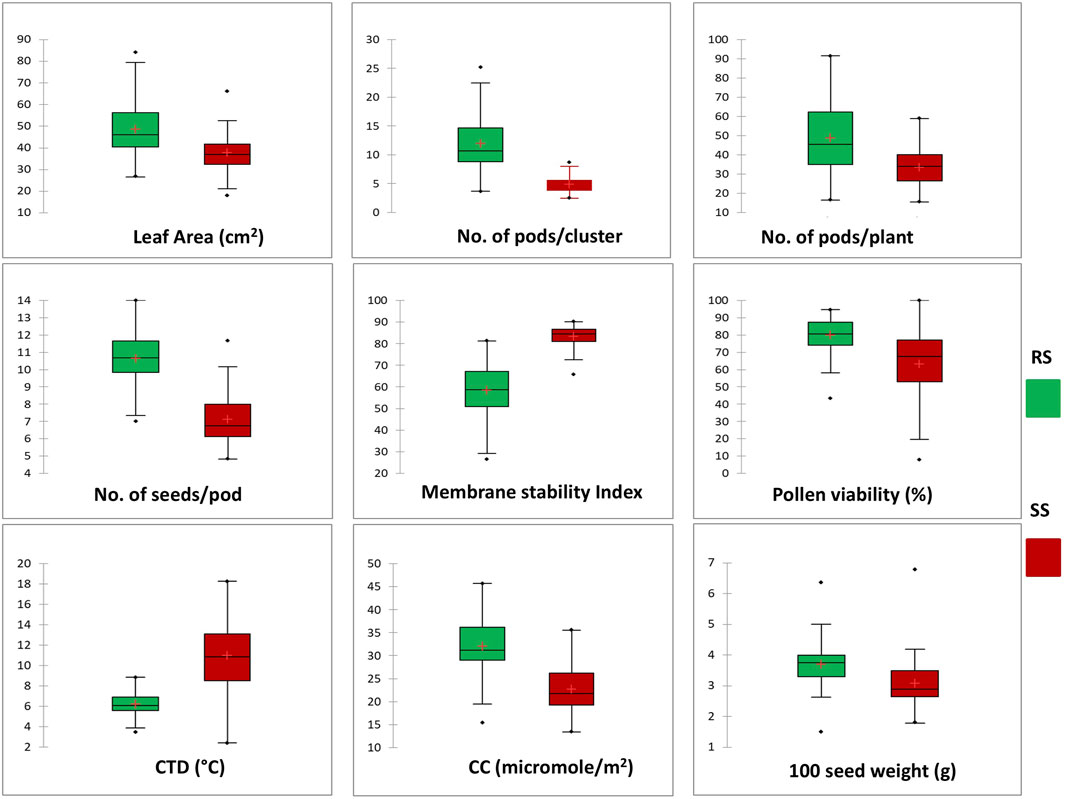
Figure 3. Box plot chart distribution of morphological and physiological traits under RS and SS conditions. The distribution for each trait shows a significant change in the phenotypic expression of mungbean genotypes in response to heat stress.
The genotype IC418452 excelled among all the genotypes under the heat stress (SS) environment (Table 3), although its performance under normal conditions (RS) was not significant. The genotype has shown excellent heat stress adaptability for traits viz., number of pods/plant, number of pods per cluster, number of seeds/pod, MSI (%), chlorophyll content, CT, CTD, and pollen viability and also retained grain weight. Another genotype IC489062 has also shown good adaptability for heat stress tolerance as revealed by its superior performance for traits viz., number of pods/plant, number of pods/cluster, MSI, chlorophyll content and seed weight. The passport information indicates that the genotype IC418452 originated from the Andaman and Nicobar Islands, while the genotype IC489062 belonged to Rajasthan (Table 1). The genotype IC76475 was found superior for multiple traits viz., number of pods/plant, number of pods/cluster, number of seeds/pod and MSI (%) under SS conditions. The genotype IC314272 is found superior for canopy temperature and canopy temperature depression. IC314272 showed heat stress adaptability through better CTD, higher pollen viability and better chlorophyll content. The genotype EC862623 was found superior for traits viz., number of pods/cluster, CT and CTD. There is another group of genotypes that have excellently performed in terms of their adaptability for a single or two traits (Table 3). Some genotypes have performed relatively better under the control environment (RS), which can find their direct use in mungbean trait improvement programs other than the heat stress (Table 3). The stomatal conductance (mol m⁻2 s⁻1) showed variation ranging from 2.87 to 10.93 mol m⁻2 s⁻1 under SS conditions. The check varieties viz., SML-668 (4.10), IPM 99-125 (4.83), Virat (4.680) and Pusa Vishal (4.00) showed moderate levels of stomatal conductance. The promising mungbean genotypes viz., IC489062 (5.30), IC76475 (4.33) and IC418452 (4.07) also showed moderate levels of stomatal conductance. This indicates that a plant needs to adapt to heat stress conditions by evaporation to cool down its canopy, while it also must maintain desired leaf water potential to maintain turgor pressure, gaseous exchange, photosynthesis and other physiological activities.
Ranking of 87 mungbean genotypes based on their heat susceptibility index (HSI) indicated a good range of variability for heat stress tolerance in terms of their yield performance under a heat stress environment. The genotypes viz., IC623822, IC616201 and IC489062 were found superior to the best mungbean check variety, i.e., SML-668 (Table 4).
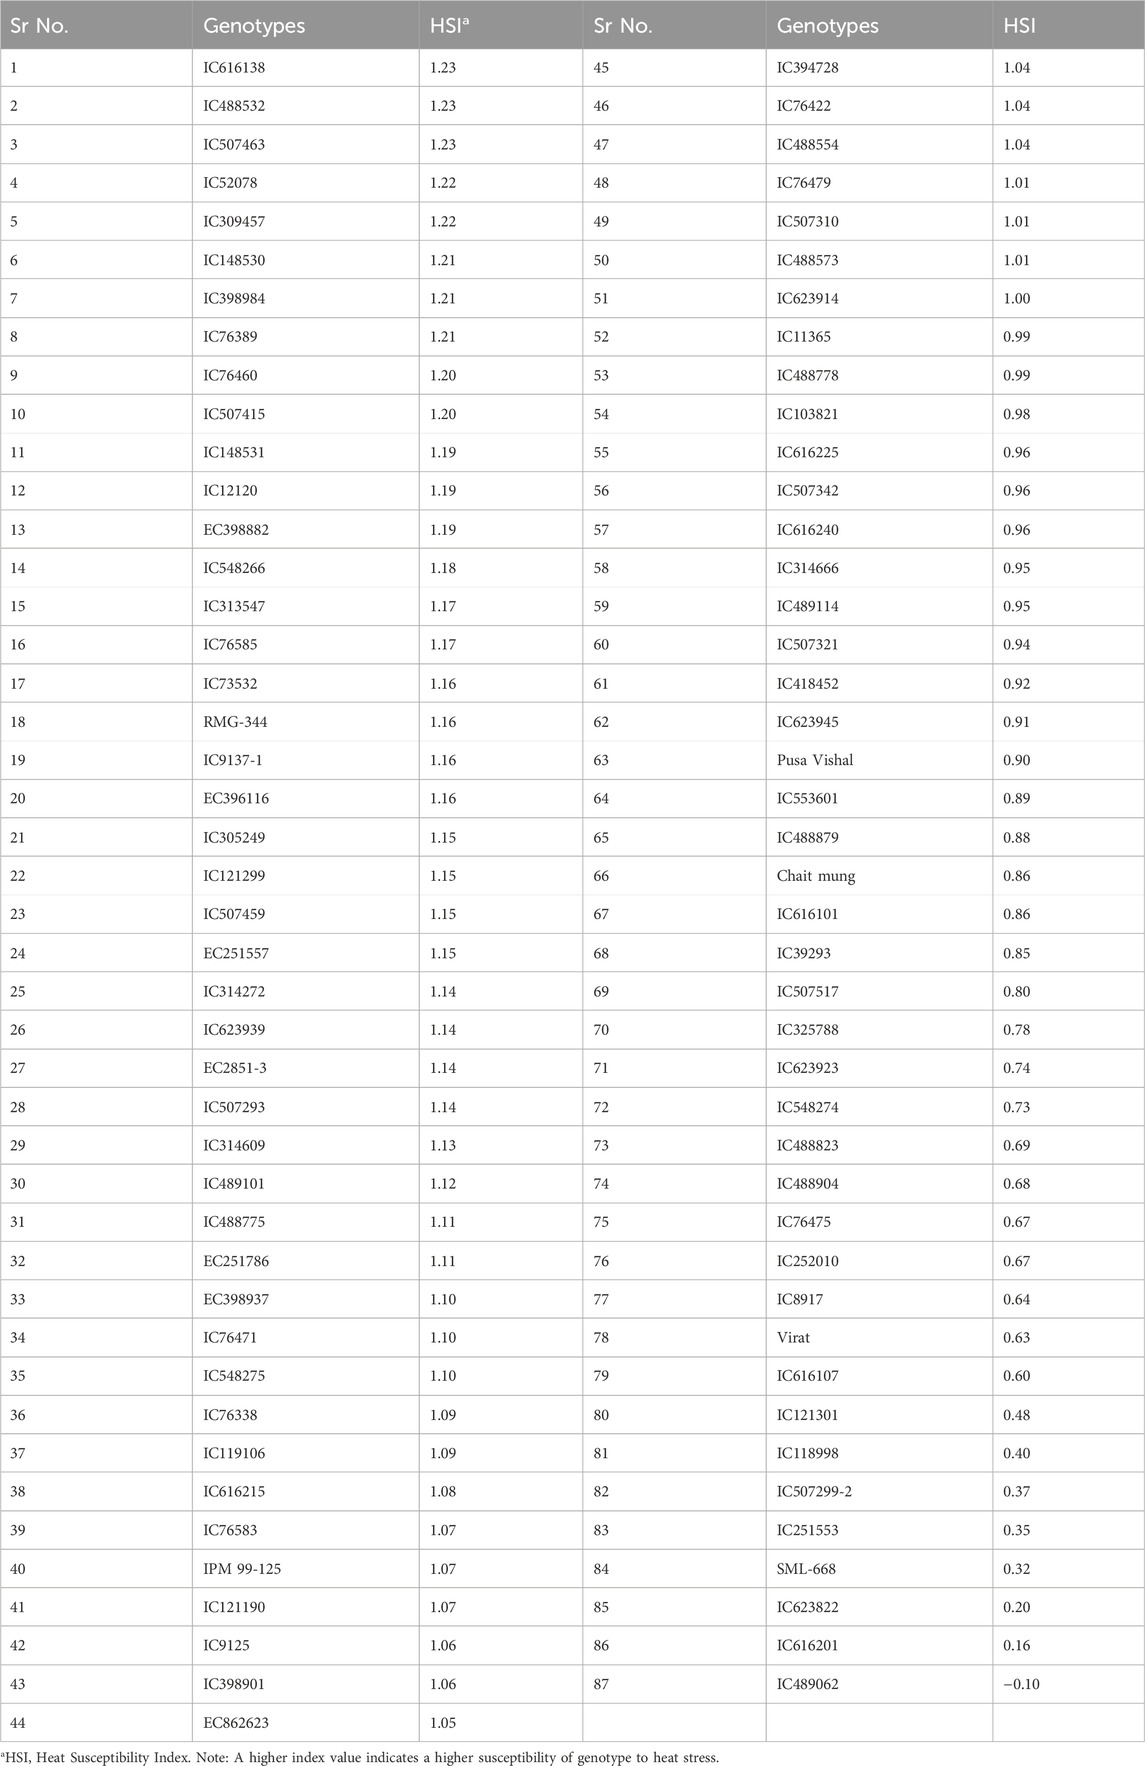
Table 4. Categorization and ranking of mungbean genotypes’ relative susceptibility to heat stress.
3.2 Correlation analysis and ANOVACorrelation analysis is a statistical method used to evaluate the relationship between two variables. In the context of plant physiology and morphology, correlation analysis can help uncover their relationships with the adaptability of the genotypes. In this study the correlations among the physiological and morphological parameters under SS and RS conditions were examined (Figure 4). The correlation analysis showed the important relationships between the morphological and physiological parameters studied under RS and SS conditions. A strong and negative correlation is observed between canopy temperature (CT) and canopy temperature depression (CTD), which indicates the efficiency of mungbean genotypes to cool down the canopy temperature through transpiration (Figure 4). Positive correlations were observed among leaf area, leaf length and leaf width. The leaf dimension traits have shown moderately negative correlations with CT under RS conditions, while the correlations are negligible under SS conditions (Figure 4).
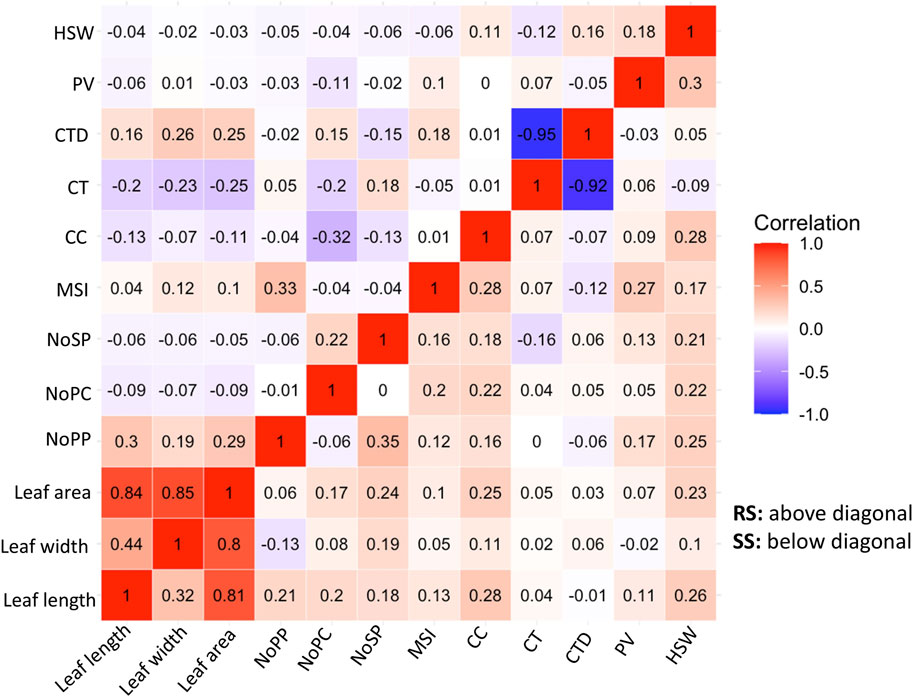
Figure 4. Correlation Matrix of morpho-physiological traits of 87 mungbean genotypes under normal sown conditions (RS) and heat stress (SS) environments showing character correlation with each other [A positive correlations are shown in red and negative correlations are shown in blue color. The color intensity indicates the magnitude of correlation in either direction].
ANOVA was done to understand the differences among the genotypes under the two distinct growing conditions, i.e., SS and RS with respect to morpho-physiological parameters. The ANOVA indicated that the expressions of traits viz., leaf area, number of pods/cluster, number of pods per plant, seed per pod, pollen viability, canopy temperature, chlorophyll content, 100 seed weight and membrane stability index under rainy season (RS) and summer season (SS) environments are significantly different at the given significance level (α) of 0.0001 (Table 5). Overall, ANOVA proved to be a valuable statistical tool for detecting the impact of treatment on morpho-physiological traits in plants.
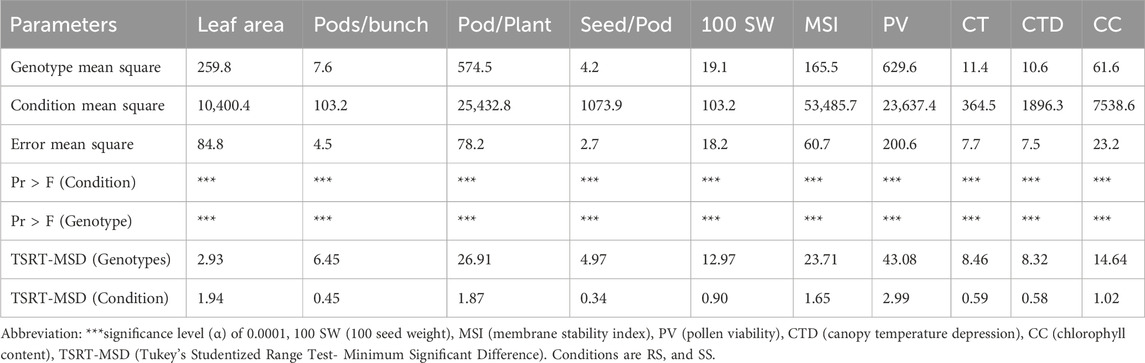
Table 5. ANOVA for morpho-physiological parameters under SS conditions (heat stress) than the RS conditions (normal) of 87 mungbean genotypes.
3.3 Principal component analysisThe Principal Component Analysis (PCA) was employed in this study to reduce the dimensionality of the multivariate dataset and identify underlying patterns in the data. By transforming the original variables into a set of orthogonal principal components, PCA allowed us to capture the most significant sources of variation and extract meaningful information from the complex dataset. In this study, PCA was employed to analyze a dataset of morpho-physiological traits in plants, e.g., leaf area, number of pods/cluster, number of pods/plant, seeds/pod, pollen viability%, chlorophyll content, 100 seed weight and MSI.
The first five PCs could only explain 72% of the entire variability under both environments, i.e., RS and SS (Table 6). Loading values in each PC indicate the major contributing parameter for the variation. For instance, traits related to leaf dimension and CTD are the major contributors of PC1. PC2 captures a contrast between CT and CTD, likely indicating a trade-off between growth parameters and canopy temperature. PC3 focuses on reproductive characteristics such as the number of pods and pod volume, as opposed to leaf area and width. PC4 differentiates primary branch counts and reproductive outputs like NOPP and NOSP. PC5 contrasts pod volume with other growth factors, including CC and NOPP. PC1 accounts for the most variance, followed sequentially by PC2, PC3 and so on. Conversely, during the rainy season, the table shows PCA loadings where PC1 contrasts leaf dimensions and canopy temperature against CT, with higher scores indicating reduced leaf size and canopy temperature. PC2 contrasts CT and NOPP with CTD and NOPB, pointing to a balance between reproductive output and temperature resilience. PC3 differentiates reproductive traits, such as the number of branches and pods, from CC, possibly a stress or nutrient content indicator. PC4 contrasts MSI and NOPP against leaf size, while PC5 contrasts pod volume and seed weight with CC, hinting at a relationship between reproductive productivity and stress or nutrient content. These loading patterns indicate that relationships among plant traits shift between the summer and rainy seasons, as a result of their adaptation efficiency. The Principal Component Analysis (PCA) under stress conditions (SS) revealed that the first two PCs, i.e., PC1 and PC2, accounted for 24.1% and 16.5% of the total variation, respectively, summing to a cumulative variance of 40.6% (Figure 5; Table 6). In contrast, under rainy conditions (RS), PC1 and PC2 explained 24.6% and 15.3% of the variance, respectively, resulting in a slightly lower cumulative variance of 39.9% (Figure 5; Table 6).

Table 6. The principal components and the variance explained by each component under RS condition.
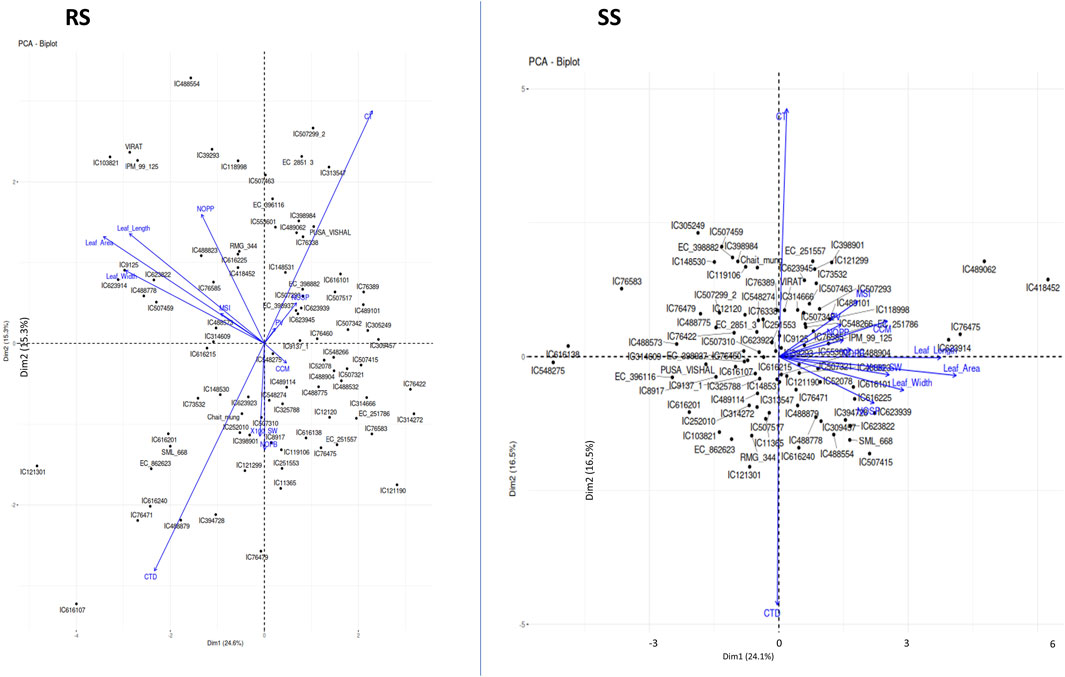
Figure 5. Principal Component Analysis (PCA) plots showing the multivariate variation among 87 mungbean genotypes in terms of environmental variables. The first two PCs explained 39.91% and 40.65% of the total variance under RS conditions and SS conditions. The variables with closer angles are more positively correlated, while variables in opposite directions are negatively correlated. A similar pattern is observed in both environments except for a few variables, which may be due to the partitioning of the variability in other PCs.
These results indicate that the variation explained by the first two PCs under SS conditions is slightly higher compared to RS conditions. This suggests that under stress, the dominant physiological traits that contribute to variance are relatively more pronounced, thereby capturing more of the total variability in fewer components.
3.4 Agglomerative hierarchical clustering (AHC)Cluster analysis was employed to classify mungbean lines based on their morpho-physiological characteristics during both the rainy season (RS) and the summer season (SS). The dendrogram visualizes the hierarchical clustering of a dataset with items color-coded to indicate different clusters.
In RS, the genotypes are primarily divided into four clusters and a similar clustering pattern is observed in SS. Notably, the differentiation between clusters was more pronounced under SS conditions, indicating greater divergence among genotypes in response to heat stress. Cluster (black colour) under SS conditions, which has three genotypes viz., IC76475, IC489062 and IC418452, are found as heat tolerant based on various morpho-physiological characters. Out of these three genotypes, IC76475 and IC489062 also clustered together in RS conditions, while the genotype IC418452 clustered separately (Figure 6). This indicates that hierarchical clustering is helpful in identification of the similar genotypes for heat stress tolerance, as the tolerant genotypes generally follow similar patterns of trait expression.
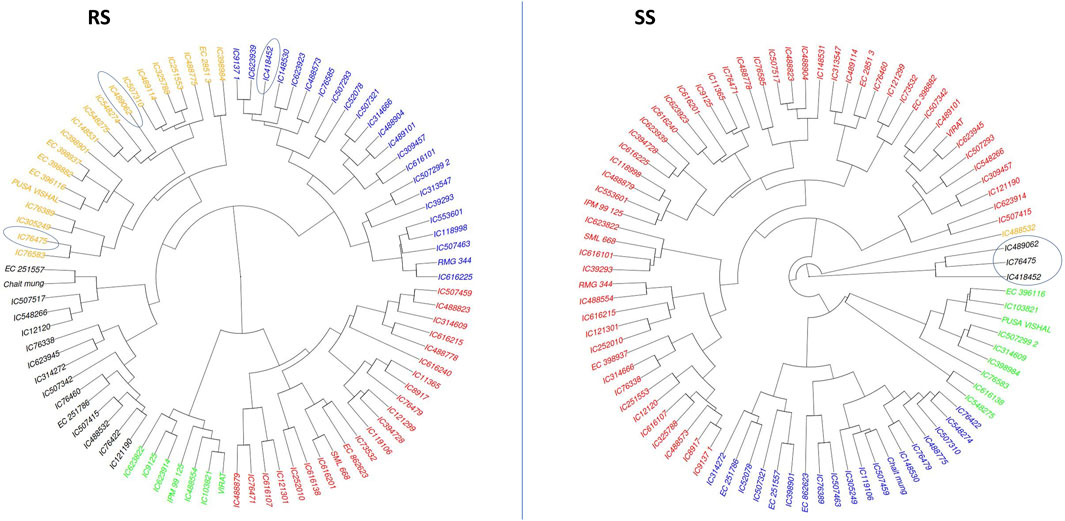
Figure 6. The agglomerative hierarchical clustering of 87 mungbean genotypes under RS and SS conditions. The promising accession identified as promising for heat stress tolerance based on their expression for multiple traits are circled.
3.5 Expression analysis of key candidate genesThe expression study of selected key candidate genes was done to validate the results obtained through morpho-physiological work. Here six key candidate genes viz., CP47, SUT, MTR_1g062190, MTR_7g092380, LOC101499292 and VrLEA-1 which are known to control important cellular processes as mentioned in table 2 were analyzed for their level of expression under normal temperature and elevated temperature conditions as mentioned in materials and methods.
The expression of all genes under study was significantly altered under heat-stress conditions (Figure 7). All these genes were found to be upregulated under heat stress conditions, however, the expression of IC76475 IC418452 and IC489062 mungbean genotype was relatively higher (Table 7; Figure 8). Conversely, the expression of the candidate genes in heat-sensitive mungbean genotypes viz., IC616138 and IC548275 was downregulated as compared to control conditions.
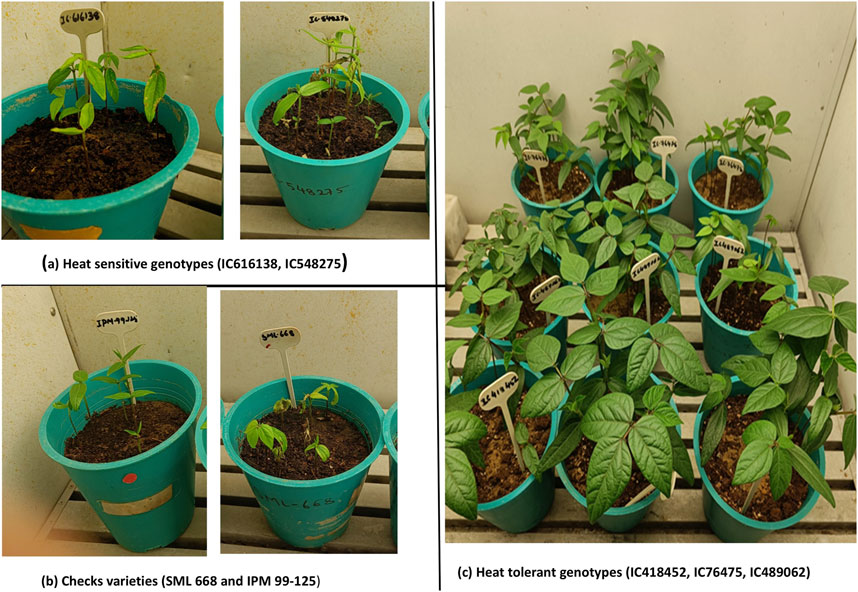
Figure 7. Growth chamber view of mungbean genotypes used for qRT-PCR. Under the heat stress treatment (SS) vigorous canopy growth was observed in heat stress tolerant genotypes viz., IC76475, IC418452 and IC489062 (C), while the check varieties which are popular for summer season-grown mungbean crop viz., SML668 and IPM99-125 (B) showed poor growth and leaf burning at the elevated temperature of 40 °C. The heat-susceptible genotypes viz., IC616138 and IC548275 (A) also showed poor growth and leaf burning.
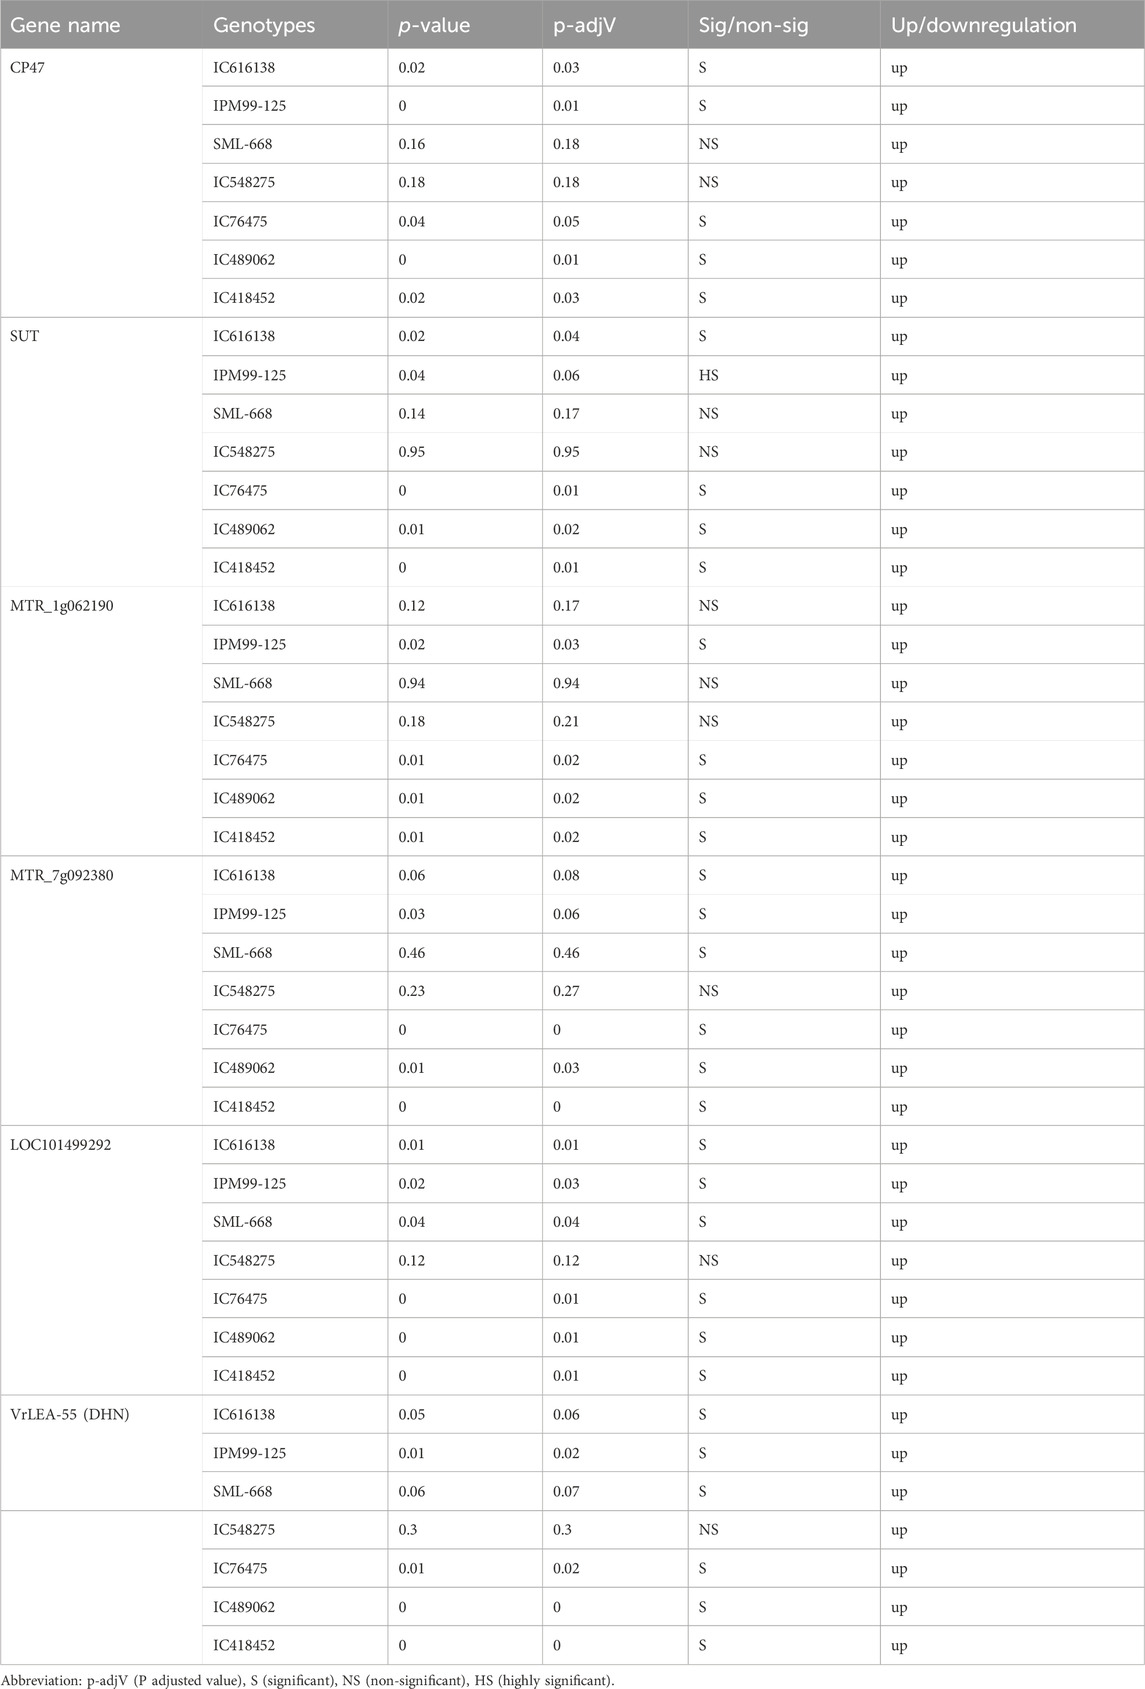
Table 7. The expression statistics of key candidate genes involved in heat stress tolerance.
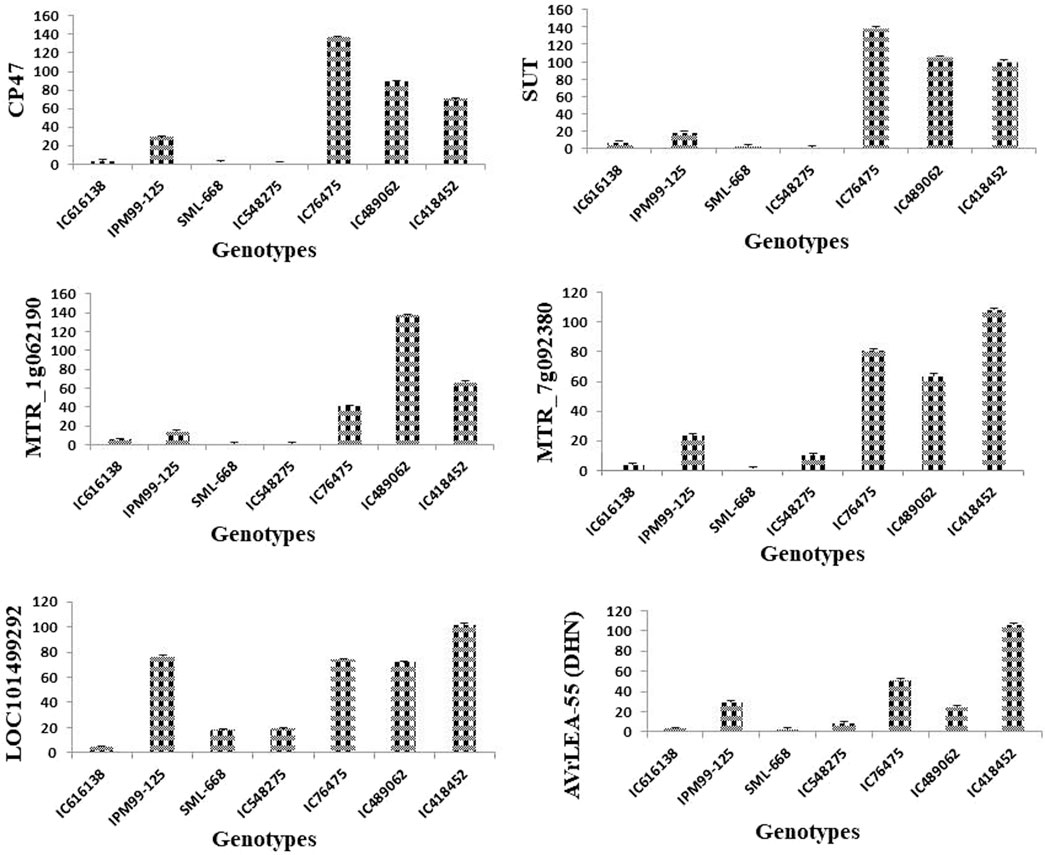
Figure 8. Effect of heat stress on the relative expression candidate genes [CP47, SUT, MTR_1g062190, MTR_7g092380, LOC101499292, VrLEA-55 (DHN)] involved in key physiological of heat stress tolerance. The analysis indicated a significantly higher level of expression for tolerant mungbean genotype (IC76475, IC418452, IC489062) in comparison to checks varieties (SML668, IPM99-125) and susceptible genotypes (IC616138, IC548275) used. The bars represent mean values of the relative normalized expression of genes ± SE.
Expression profiling of key genes under heat stress revealed significant insights into the mungbean genotype’s responses. CP47, crucial for maintaining photosystem II (PSII) integrity, showed pronounced upregulation in all heat-tolerant genotypes (IC76475, IC418452, IC489062), indicating its role in maintaining photosynthesis under elevated atmospheric temperature. Conversely, heat-sensitive genotypes (IC616138, IC548275) exhibited negligible CP47 expression under heat stress. Similarly, SUT, involved in sucrose transport displayed significant upregulation in all genotypes except IC548275 and SML-668, highlighting its role in energy supply and stress adaptation. MTR_1g062190, associated with general stress responses and membrane stabilization, exhibited high expression in all heat-tolerant genotypes, contrasting with minimal expression in heat-sensitive genotypes. MTR_7g092380, likely involved in protein folding under heat stress responses, showed a similar response. LOC101499292, important for glycosylation, displayed varying expression patterns among genotypes, being notably higher in IC489062, IC418452 and IC76475 compared to IC616138 and IC548275. VrLEA-55 (DHN), known for its protective functions during abiotic stresses, also exhibited its role in enhancing stress tolerance.
4 DiscussionRising atmospheric temperatures due to climate change are expected to have significant implications for global agricultural production, including that of mungbean. Mungbean is a warm-season legume, that thrives well between 28°C and 35°C, however, temperatures exceeding this range, particularly above 40°C, can lead to heat stress, causing flower and pod abortion, reduced seed filling and ultimately lower yields (Kaur et al., 2015). Globally over 43,000 mungbean collections are conserved, which can be used to identify superior genotypes for heat tolerance (Gayacharan et al., 2020). Therefore, in this study, we have screened diverse mungbean collections obtained from the Indian National Genebank. The mungbean germplasm included prominent mungbean varieties, local germplasm collections and landraces, collected from different parts of India (Table 1). We observed a good amount of variability available for heat stress tolerance traits in mungbean germplasm (Table 3). Moreover, many of the mungbean germplasm lines performed relatively better than the check varieties used in this study. The check varieties used in this study are recommended for their cultivation as summer crop in specific zones in India, for example, IPM 205-7 (Virat) for South and Central Zone, IPM 99-125 for Northeast Plain Zones, SML 668 for Punjab; and Pusa Vishal for Northwest Plain Zones (Tiwari and Shivhare, 2019). The inclusion of multiple check varieties in this experiment allowed for a robust comparison of trait expression under elevated heat stress conditions, providing a standard for identifying superior mungbean genotypes with relatively better heat stress tolerance.
The morphological variations and adaptive responses in mungbean were also reported earlier but with a very limited number of accessions, which are primarily elite lines of mungbean (Kaur et al., 2015; Sharma et al., 2016; Priya et al., 2023). Sharma and coworkers (2016) used 41 elite mungbean lines which included imported elite mungbean lines from The World Vegetable Centre, Taiwan for the evaluation against heat stress tolerance under pot conditions using morpho-physiological and biochemical traits, and identified five genotypes as heat tolerant genotypes. Kaur et al. (2015) studied reproductive biology using two mungbean cultivars (SML 832 and 668) in response to heat stress. Similarly, Priya and coworkers (2023) used two genotypes viz., EC693369 as heat tolerant and KPS1 (EC592167) as heat sensitive to see the impact of heat stress on grain filling and other phenotypic characteristics. Patriyawaty et al. (2018) studied the genotypic responses to heat stress using five heat tolerant and five susceptible mungbean genotypes in a combination of physiological parameters and acclimation treatment. They observed a drastic reduction in shoot-root biomass and grain yield, but less drastic effects on acclimatization treatment. In a study, 17 mungbean genotypes were selected from a total of 116 genotypes based on the evaluation data for flowering, biomass, and yield attributes for further study on various parameters in response to heat stress (Basu et al., 2019). The study identified EC398889 as a heat tolerant mungbean genotype. The literature indicated that the previous studies have primarily focused on a narrow range of mungbean genotypes, mainly elite lines or released varieties, revealing a limited understanding of the genetic variability for heat stress tolerance, although a good number of mungbean ex-situ collections are conserved worldwide. However, our study used diverse mungbean collections and also revealed a good amount of variability for the traits studied (Tables 1, 3).
This study revealed varying responses of mungbean germplasm to heat stress. Each genotype showed a different magnitude of expression for each trait studied. The impact of heat stress is not limited to the traits studied but to overall phenotype. The heat stress alters each physiological and biochemical process thereby its phenotype (Kuppusamy et al., 2023). For example, Douglas et al. (2020) stated that, in summer season plants, there is a relative reduction within leaf area contrasted to the rainy season, also morphological alterations, namely, chlorosis, scorching and wilting have been noticed. The result of our study also revealed significant morpho-physiological changes in response to heat stress (Figure 2; Table 3). Most of the genotypes that performed better in normal sown conditions (RS) did not perform well during summer-sown (SS) conditions. Although some genotypes showed very good resilience towards elevated temperature their performance was better for multiple traits. Among such genotypes are IC418452, IC489062 and IC76475. There are other mungbean genotypes which were found superior for more than two traits viz., IC39293, IC616215, IC398984, IC252010, IC398984, IC52078, IC76475 and IC623822 (Table 3).
The passport information of the heat-tolerant mungbean genotypes viz., IC418452 (Andaman and Nicobar Islands), IC489062 (Rajasthan), and IC76475 (Delhi) indicates that they originate from geographically diverse regions of India, each representing distinct climatic zones (Table 1). This suggests that these genotypes have evolved independently under different environmental conditions, resulting in their diverse genetic backgrounds. Notably, they have developed heat stress tolerance, as the mungbean growing season in the Andaman and Nicobar Islands coincides with the hot summer months, while in Rajasthan, the kharif season often experiences temperatures reaching up to 40°C. The variation in trait expression, as detailed in Table 3 and confirmed by qRT-PCR analysis (Figure 8), further emphasizes their genetic diversity. Genotype IC418452 demonstrates superior performance across seven traits, including the number of pods per plant, number of pods per cluster, number of seeds per pod, membrane stability index, chlorophyll content, pollen viability, and 100-see
Comments (0)