
Remember me


The target population of the study was adults with newly diagnosed multiple myeloma who were not eligible for stem cell transplantation. The starting age of the simulated cohort was 66 years, which was based on the median age of newly diagnosed patients in Singapore [21]. The main intervention under evaluation was a triplet therapy consisting of daratumumab, lenalidomide, and dexamethasone (referred to as DRd). The comparator was also a bortezomib-based regimen with lenalidomide and dexamethasone (referred to as VRd), which is the subsidized standard of care regimen in Singapore for first-line treatment of multiple myeloma. The dosing and administration schedule of the regimens followed those used in the SWOG S0777 trials and MAIA, with assumptions made regarding the postprogression treatment. (See Table S1 and S2 in the Supplementary Material)
The economic evaluation was conducted from the perspective of the Singapore healthcare system using a lifetime horizon. A time horizon of 30 years was chosen to ensure that it captures the expected lifespan of all newly diagnosed patients, considering the life expectancy in Singapore [22]. To ensure granularity in costs and outcomes and to align with the 21- or 28-day treatment cycles used in the trials, a weekly cycle length was adopted. Discounting was applied to both costs and outcomes at a rate of 3%. This choice of discount rate was based on the pharmacoeconomic guidelines published by the Agency for Care Effectiveness, which is the health technology assessment (HTA) agency under the Ministry of Health in Singapore [23, 24].
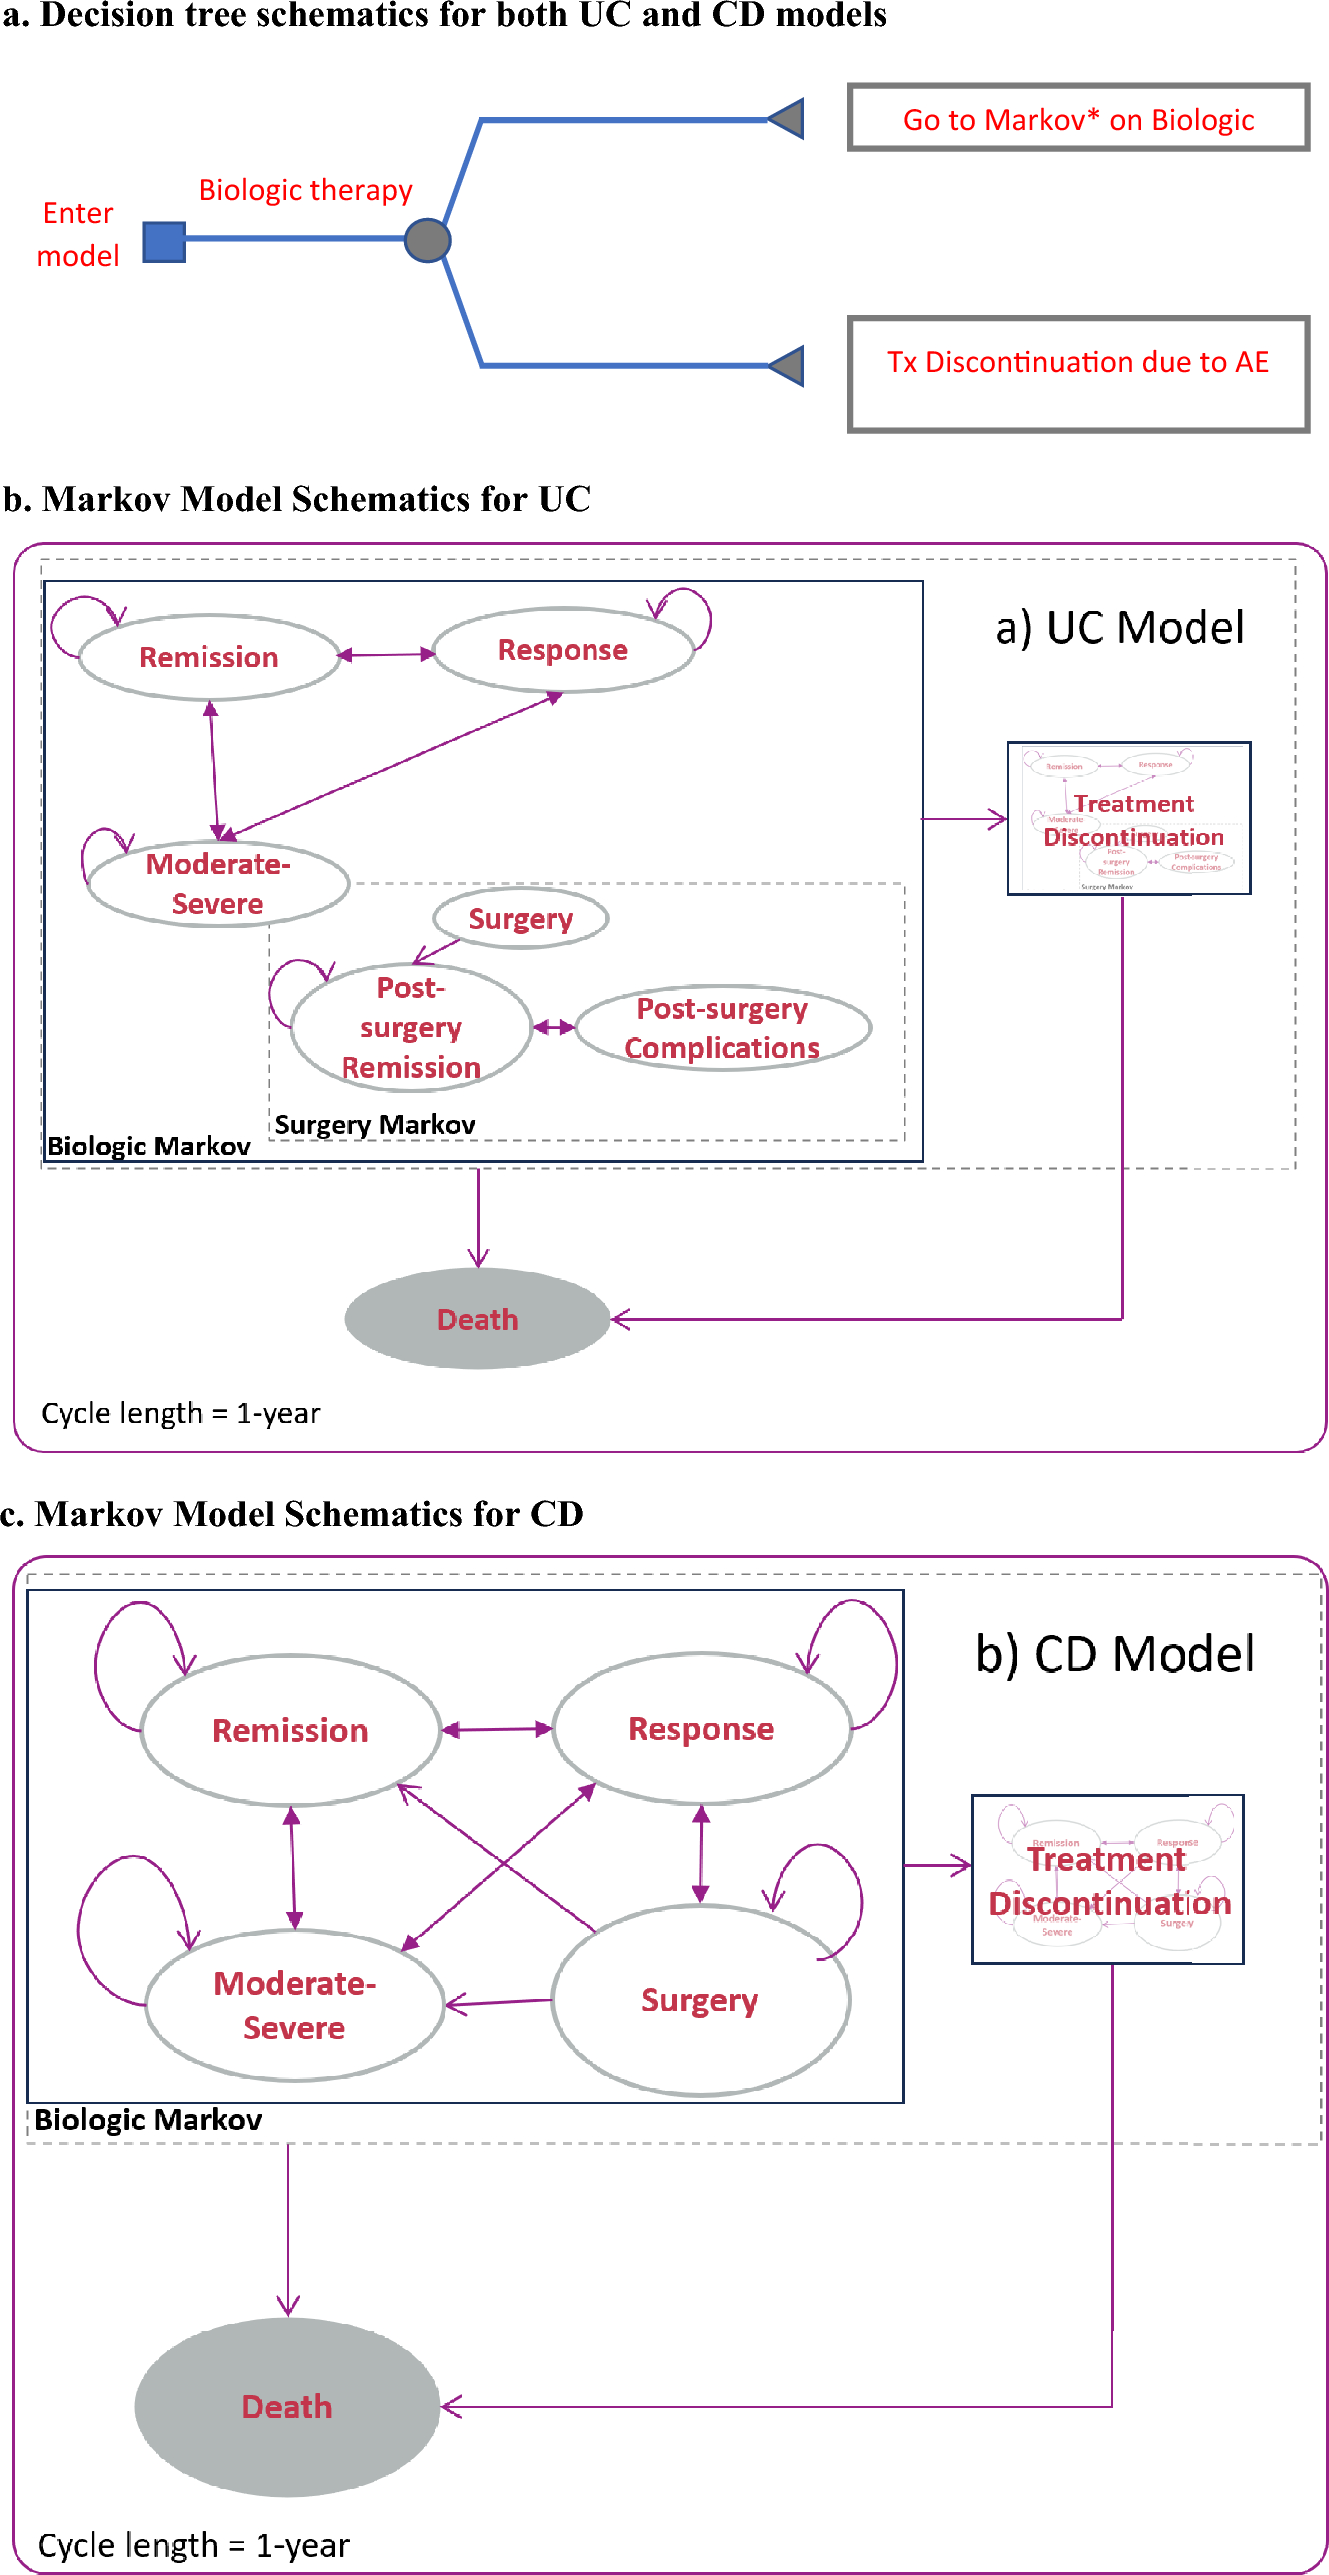
2.2 Model DescriptionWe adopted a partitioned survival model to estimate the costs and outcomes associated with the regimens, which used modeled progression-free survival and overall survival data from the clinical trials [25]. The model considered the time spent on-treatment with VRd or DRd, which is the progression-free state. Subsequently, it considered the transition to the postprogression state or the initiation of a new treatment line, and finally, the absorbing state represented death. To determine the costs of first-line therapy with daratumumab, we used the time spent on treatment based on time-to-discontinuation (TTD) estimates from the MAIA trial (Figure S1 on the Supplementary Material) [8]. For bortezomib, given the absence of TTD data, we assumed that patients would complete the initial therapy, and remain on maintenance Rd treatment until disease progression based on the estimated PFS. For subsequent treatment lines, we replicated the regimens used in Singapore using real-world data rather than relying on trial data. We assumed that patients would receive palliative care 1 month prior to their death, regardless of whether they were in the progression-free or postprogression state [26].
2.3 Input Parameters2.3.1 Clinical EffectivenessProgression in this study was defined according to the International Myeloma Working Group Criteria [27], which was consistently applied across the trials. We fitted individual patient-level data (IPD) from the intervention arm of the MAIA trial to estimate progression-free survival (PFS) and overall survival (OS) of patients receiving DRd. Survival outcomes for the comparator, VRd, were derived from two sources. For PFS, we conducted an indirect comparison using subgroup results from SWOG S0777 [6]. This trial provided subgroup analysis results for patients without intent to undergo a transplant, which was used in an anchored indirect comparison with DRd, given a common comparator of lenalidomide and dexamethasone (Rd) in both trials. Details of the indirect comparison are provided in the Supplementary Material. Briefly, the indirect comparison of PFS yielded a hazard ratio of 0.72 [95% confidence interval (CI) 0.50–1.03]. For OS, subgroup results for patients over 65 years old were reported in the SWOG S0777 trial and used for the VRd arm. We digitized the reported Kaplan‒Meier curves and applied the Guyot algorithm to generate pseudo-IPD [28].
At the time of the analysis, a median follow-up duration of 56.2 months was available from the MAIA trial. For SWOG S0777, the results for up to 84 months of median follow-up were available. We extrapolated survival curves over a model horizon of 30 years using parametric functions. The selection of the best-fitting curves was based on statistical fit measures [Akaike information criterion (AIC) and Bayesian information criterion (BIC); Table S3 in the Supplementary Material], visual inspection, and clinical validation [29]. For DRd, an exponential function provided the best fit for both progression-free survival and overall survival. For VRd, a piecewise exponential model was fitted to overall survival, with cutoff points at months 3, 37, and 88 (Figs. 1, 2).
Fig. 1
Progression-free survival. DRd daratumumab, lenalidomide, and dexamethasone, VRd bortezomib, lenalidomide, and dexamethasone, PFS progression-free survival, ITC indirect treatment comparison, HR hazard ratio
Fig. 2
Overall survival. DRd daratumumab, lenalidomide, and dexamethasone, VRd bortezomib, lenalidomide, and dexamethasone, OS overall survival
2.3.2 Costs and Resource UseGiven the heterogeneity of patients, we used real-world data (RWD) to capture costs and resource use accurately. We obtained costs and resource use data related to the treatment and management of adverse events from a retrospective analysis of electronic medical and billing records at two major cancer centers in Singapore. A separate study reports the details of this analysis [30]. In summary, we conducted a retrospective cohort study analyzing data from the electronic records of 605 MM patients in Singapore. Treatment cost data, cost of managing adverse events, and utilization of subsequent treatment lines were generated from this study. The unit costs of the drugs reflect the cost prices in the hospitals as of November 2023. The cost of the DRd regimen was adjusted to incorporate the Patient Access Programme currently implemented by the manufacturer and uses the subcutaneous version of the drug. Under this program, patients pay a fixed monthly cost irrespective of their treatment cycle. DRd administration costs without the Patient Access Programme are reported in the Supplementary Material (Table S4). Costs associated with palliative care were obtained from the COMPASS cohort study, which collected end-of-life cost data for patients in Singapore with various cancer types [31]. The estimate used in this study was based on their analysis of the mean monthly cost 1 month before death. All costs are reported in US dollars (US $) and were converted using prevailing exchange rates as of May 2023 (US $1 = 1.35 Singapore dollars [32]; Table 1).
Table 1 Cost inputs (in US dollars)2.3.3 Quality of LifeHealth utilities (Table 2) were obtained from published literature and were used to calculate quality-adjusted life-years (QALYs). Progression-free and postprogression utility values were derived from Carlson et al. [35] and the MAIA trial, while disutilities were obtained from a publication by Jakubowiak et al. in 2016 [36]. These studies estimated the health-related quality of life of multiple myeloma patients from the MAIA and ASPIRE trials, using the EuroQol five dimensions questionnaire (EQ-5D). To calculate disutilities, we multiplied the expected disutility for each adverse event by its duration in days from RWD, divided by the total number of days in a year. The risk of each adverse event was sourced from the trials and converted into probabilities on the basis of the median follow-up duration.
Table 2 Health utilities and adverse event risk2.4 Uncertainty Assessment and Model ValidationTo ensure the robustness and validity of our model, we conducted a series of validation meetings involving senior multiple myeloma clinicians from the three public cancer centers in Singapore. The experts were presented with the survival curves, and were asked to comment on the estimated survival at key time points, i.e., 5, 10, and 20 years, and the soundness of the treatment waning assumption. They were also asked to validate the distribution of the subsequent lines of treatment post-VRd and DRd and were presented with the results for all scenarios. We also sought input from an expert from the Singapore government HTA agency who provided feedback on the methods used and potential implications of the results. Finally, we also presented the results to the drug manufacturer to ensure that the latest clinical trial data and unit prices are used in the model.
The model development process involved utilizing both RStudio and Microsoft Excel, allowing us to cross-validate the results between the two platforms. Independent checks were performed on both models to verify the accuracy of the input data, calculations, and results. Additionally, we ran the model under various scenarios, including the use of extreme values to ensure consistency and validity. We also used the most recent published data cut from the MAIA trial to validate the results of our extrapolations, given that the trial is still ongoing [37, 38].
We evaluated alternative scenarios as part of a one-way sensitivity analysis. One scenario involved considering treatment waning, where the hazard of overall survival for DRd was assumed to be equivalent to the hazard of VRd from the SWOG-S0777 trial after 10 years. Another scenario was explored by using VRd progression-free survival data from the PEGASUS study [39], which involved deidentified data sourced from the Flatiron Health database. The data were extracted from electronic health records of patients who had received treatment at community-based oncology practices in the USA. However, it is important to note that this study solely reported PFS, as the OS data were deemed immature at the time of the study. Additionally, we explored shorter time horizons (5, 10, and 20 years) to explore the impact of uncertainty in the lifetime horizon extrapolations.
We also performed a probabilistic sensitivity analysis (PSA) that subjected all inputs to uncertainty (Table S5 in the Supplementary Material). Point estimates were randomly selected on the basis of the distribution of each input, and this process was conducted once per simulation. The incremental cost-effectiveness ratio (ICER) in terms of cost per QALY was recorded for each simulation of the cost-effectiveness analysis (CEA), and a total of 1000 simulations were conducted to determine parametric uncertainty and estimate the probability that the ICER would fall below various willingness-to-pay thresholds. While the Agency for Care Effectiveness (ACE), the government HTA body in Singapore, and the decision-making committee refrain from using an explicit and singular threshold value, they examine a range of values and encourage reporting ICERs in accordance with these benchmarks. In this study, we opted to use US $80,000 as the threshold, which was previously considered the upper limit according to their 2022 guidelines [24, 25]. In September 2023, an updated version of the guidelines was released, raising the upper limit to US $270,000. Nevertheless, we have chosen to adhere to the more conservative estimate of US $80,000 because recent decisions are consistent with an implicit threshold around this value.
2.5 Risk AnalysisIn this part of the study, we applied a risk analysis framework originally developed by Grimm et al. [40] The framework consists of three main steps. First, we used the results obtained from the PSA to assess uncertainty and analyze present risks. This involved calculating the payer uncertainty burden (PUB), which is equivalent to the expected value of perfect information (EVPI), and the payer strategy burden (PSB), which quantifies the risk associated with choosing a nonoptimal intervention. By combining the PUB and PSB (referred to as P-SUB), we gained a comprehensive understanding of the potential benefits of eliminating uncertainty and the specific risk to the payer associated with the chosen option (e.g., DRd or VRd).
Second, we conducted interviews with 17 individuals representing pharmaceutical companies, the government HTA agency in Singapore, healthcare providers, academics, and patient groups to identify the most suitable schemes and payer strategies within the context of Singapore. These interviews helped us gather valuable insights and perspectives to inform our selection process. The detailed methods and results of the stakeholder interviews are reported in a separate publication by Bayani and Wee [41].
Finally, we simulated the shortlisted schemes to evaluate their potential impact on P-SUB resulting from their implementation. This analysis allowed us to assess the potential risks and benefits associated with each scheme in a systematic manner. The risks and benefits are then compared with the P-SUB in the base case scenario where no scheme is applied. To achieve this, we incorporated the payer strategies into the cost-effectiveness model and reran the PSA to derive new estimates of ICER, PUB, and PSB. A summary of the assessed strategies can be found in Table 3. The analyses were likewise carried out in RStudio, with codes adapted from the National Institute for Health and Care Excellence (NICE) Decision Support Unit Report [42] and the Sheffield Accelerated Value of Information (SAVI) platform [43] (codes are available on GitHub; see Code Availability).
Table 3 Description of payer strategies considered
Comments (0)