
Remember me


A pre-post-comparison design was used for this study. The intervention site was the Taito Municipal Hospital convenience store (CVS) in Tokyo. The sales floor is approx. 62.5 m2, and the opening hours are 7:45 AM–7:00 PM during the week and 11:00 AM–6:00 PM during weekends.
According to sales data, the average number of visitors per day was approximately 250, of which 75% were staff, as counted by investigators in September–October 2019. The hospital has no cafeteria and about 30% of its staff use the CVS daily to buy meals at work. Most others bring light meals, such as rice balls or bowl noodles, from home and nearby supermarkets, according to the preliminary survey we conducted in November 2018.
The baseline survey was conducted with all staff (N = 273) from April1 to May31 2018. 222 staff participated (participation rate: 81.3%). 9.5% of the participants had hypertension. The prevalence of hypertension among the staff was lower than that in the national data [22]; however, the survey revealed dietary problems among the staff. Of all participants, 90.1% lacked vegetables (< 350 g/day) and 92.3% lacked fruits (< 200 g/day) in their diet based on the Japanese Food Guide recommendation [30], 97.3% exceeded salt intake limit (males: > 8.0 g, females: > 7.0 g per day) set by the Dietary Reference Intake for Japanese, 2015 [31], and only 15.8% consumed a “balanced meal” consisting of staple food, main dish, and side dish more than twice a day, as recommended by Health Japan 21 (second term) [32].
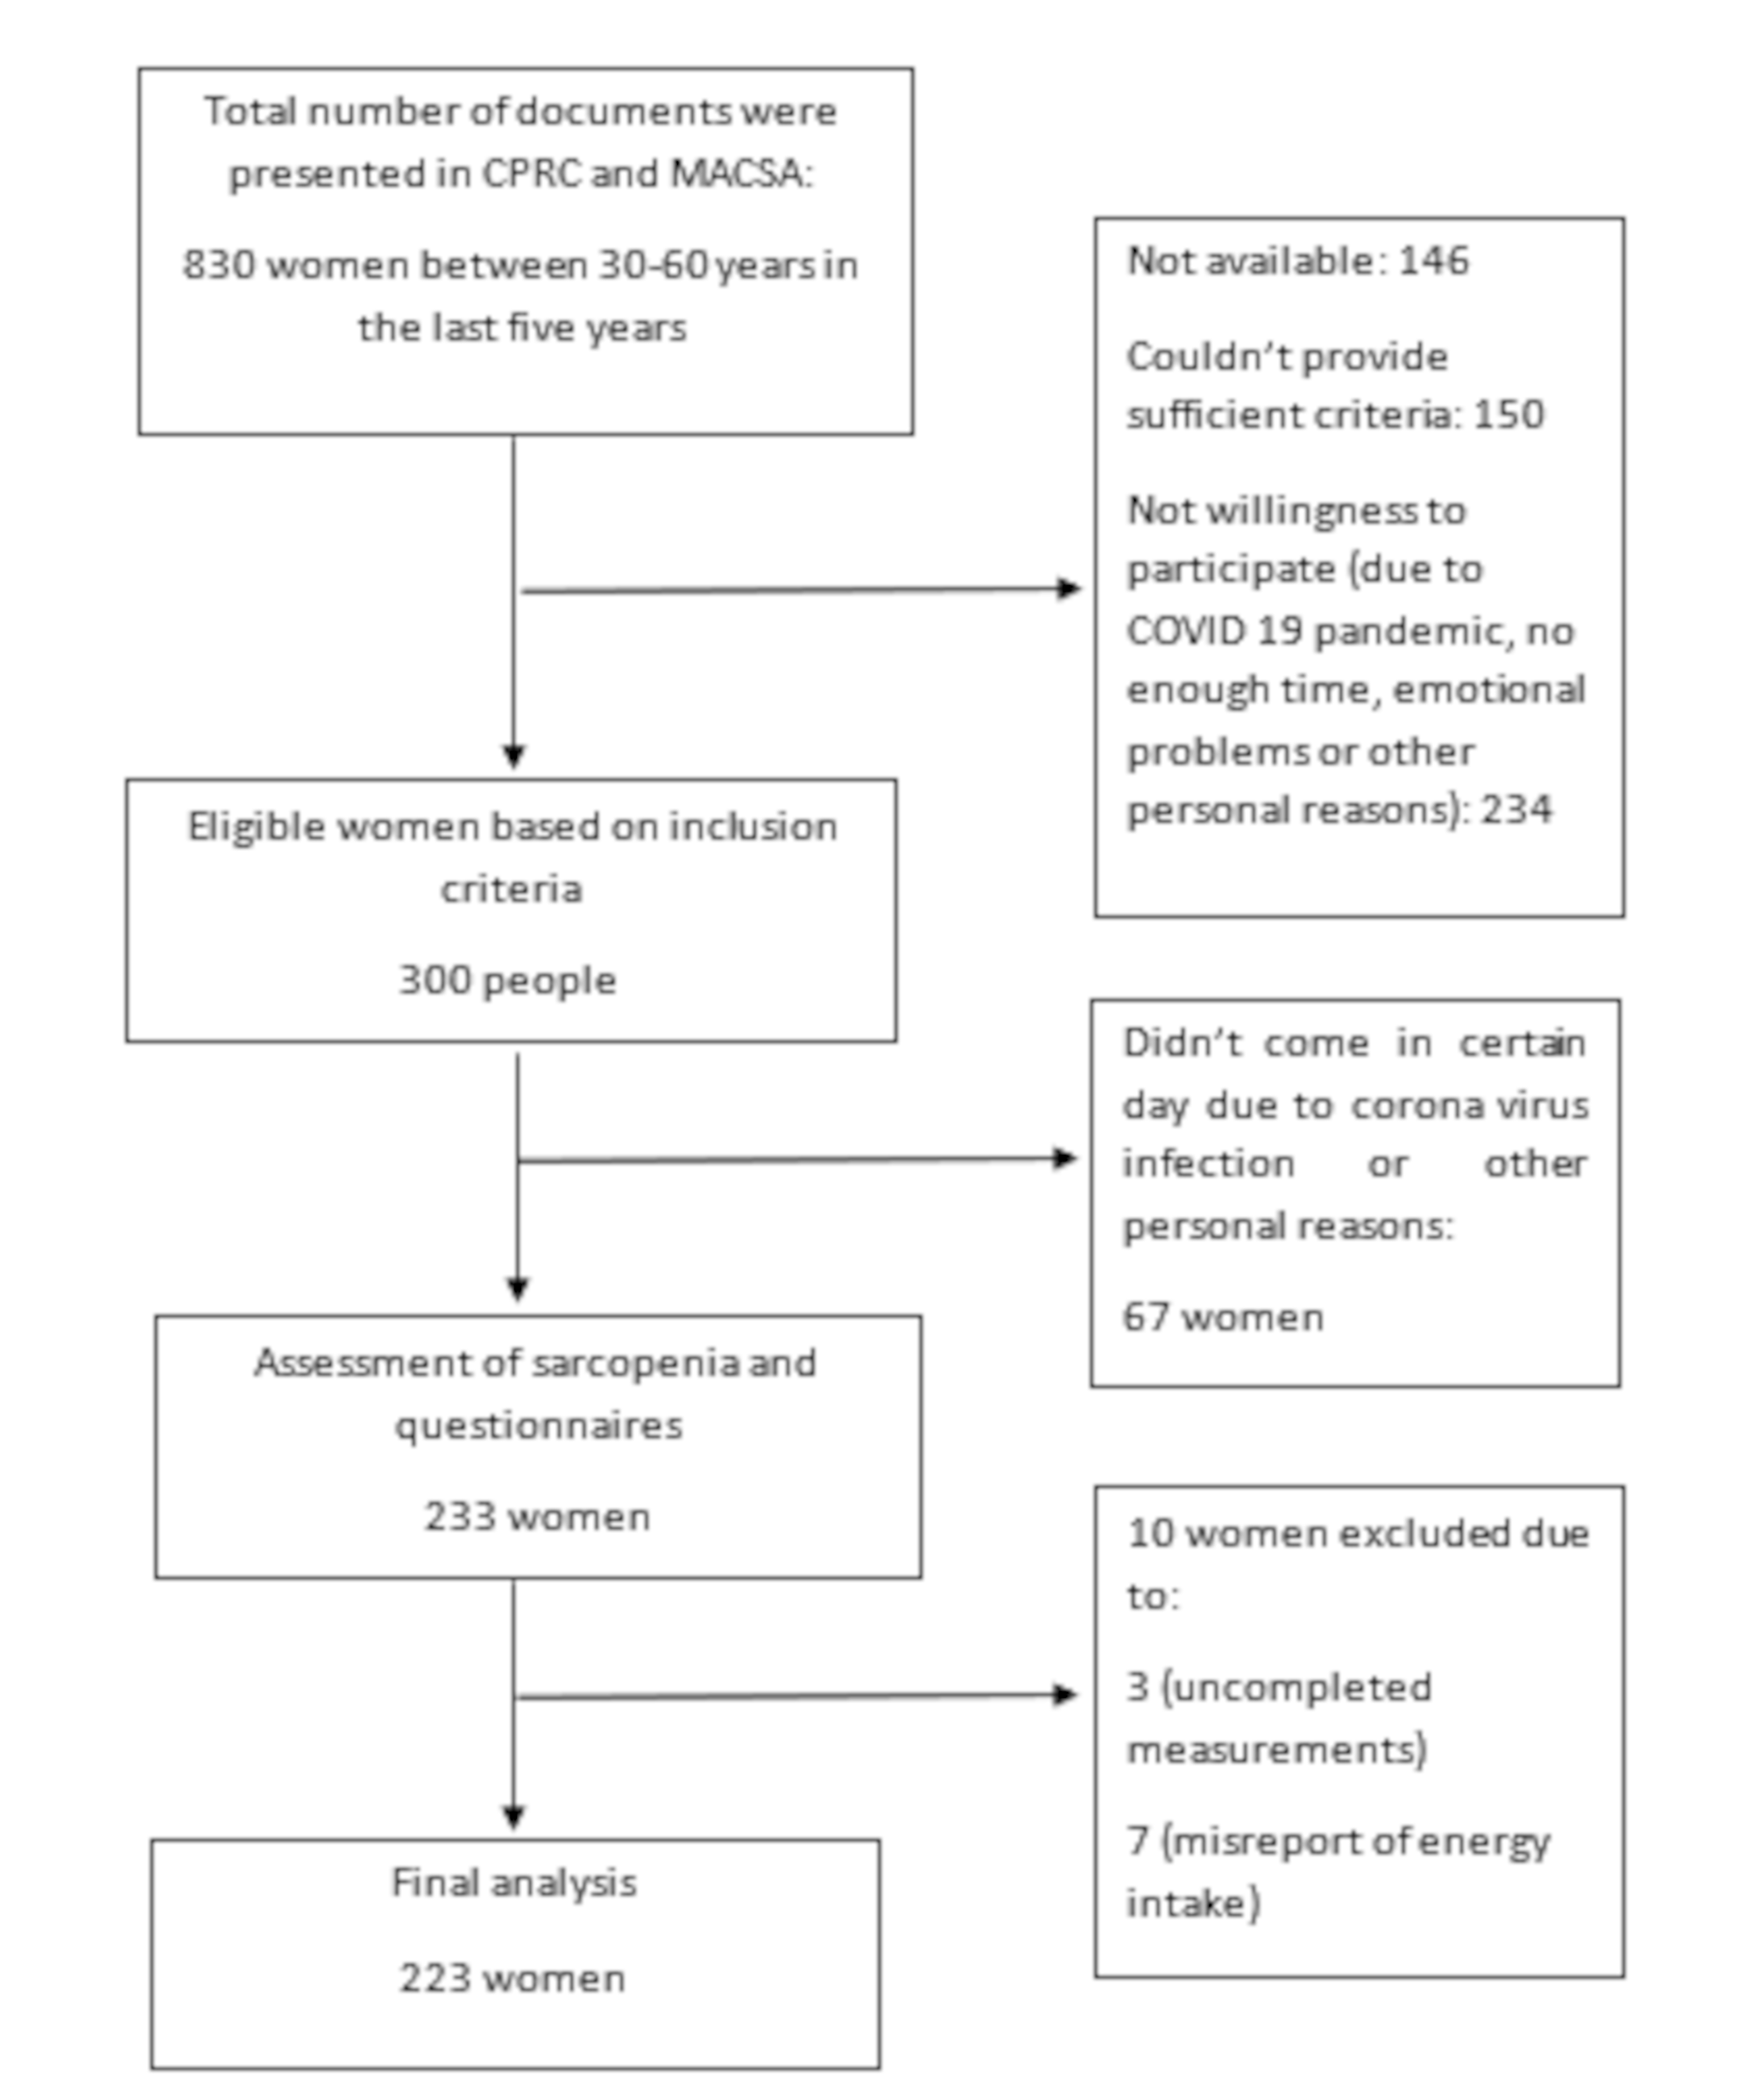
ProcedureThe study procedure and subject selection process are shown in Fig. 1. A baseline survey was conducted in April 2018, and a post-survey was conducted in April 2020 for all employees.
Fig. 1
Procedure of the study and the subject selection
The preparation period was from April 2018 to March 2019, during which consensus building with hospital managers for conducting research, recruiting project members, coordinating with CVS managers and sales staff, creating display pops, and renovating the inside of CVS were conducted.
The intervention was from April 2019 to March 2020. An additional survey was conducted in April 2021 to obtain the variables for the factorial analysis.
Written informed consent was obtained from all the participants. This study was approved by the Ethics Committee of Japan Association for Development of Community Medicine.
Intervention contentsThe contents of the interventions are shown in Table 1. The intervention was based on the Hospital Nutrition Environmental Scan (HNES) by Winston et al. [33] and incorporated one of the nudge frameworks, EAST, advocated by the Behavioural Insight Team (BIT) [34]. The EAST framework focuses on four simple principles to encourage a behavior: making it Easy, Attractive, Social, and Timely [34].
Table 1 Intervention contentsHNES is widely used as a hospital food environment evaluation index in the United States [35,36,37]. It is divided into three venue sections: cafeterias, vending machines, and gift shops, each further divided into subsection questions [33]. We designed the intervention by referring to the subsection questions and, dividing them into four categories: healthy options, placement, information, and pricing, each incorporating nudge tactics.
The main contents were 1) offering a “healthy set” (Supplementary File 1) with a discount at grab-and-go; 2) increasing and improving the placement of healthy options (e.g., salads, yogurt, sugar-free drinks, low-salt bowl noodles); 3) providing nutrition information in the CVS and monthly newsletters.
Data collection and outcome measuresData were collected during the annual staff health checkups in 2018 and 2020. Two types of questionnaire were used in this study. One was Brief-type self-administered diet history questionnaire (BDHQ) developed by Sasaki et al. [38, 39] to evaluate food intake and the other was an original self-administered questionnaire developed for this study to evaluate diet-related attitudes and behaviors (Supplementary Files 2 and 3). They were distributed to staff, with information about their health checkups. During the check-up, the researchers collected and examined the questionnaires and resurveyed or corrected missing or illogical responses. Residual urine after the health checkups (spot urine at fasting) was used in this survey.
MeasurementsUrinary Na/K ratio and sodium (Na) and potassium(K) excretionThe primary outcomes were changes in urinary Na/K molar ratio and Na and K excretion. The collected specimens were sent to a laboratory company (BML, Inc.) immediately after the checkup was performed in the morning and analyzed for Na (mEq/L), K (mEq/L), and creatinine (mg/dL). Generally, 24-h urine collection is considered the most reliable method for evaluating Na and K intake [40]. As with other alternatives, it has been reported that six random daytime urine samples collected on different days are sufficient compared to 7-day and 24-h urine collections [41]. However, we decided to use spot urine samples during the health checkups to minimize the burden on the participants.
The estimated 24-h Na and K excretion (E24HNaV and E24HKV, respectively; mmol/day) was calculated using the formula of Tanaka et al. [42], and the Na/K was calculated using the results. The required information and values for calculation, including sex, age, height, and weight (measured in a medical check-up-gown) were collected during the health checkup.
Food group intake and BMI as an energy-intake evaluation indexThe secondary outcomes were changes in the intake of five potassium-excretion-related foods: vegetables, fruits, fish, meat, and dairy products [23, 43]. The BDHQ was used for the evaluation [38, 39]. The nutrient and food group intakes obtained from the BDHQ were validated using energy-adjusted values [38, 39].
Additionally, changes in energy intake were evaluated using the body mass index (BMI: kg/m2) calculated using height and weight measured during health checkup.
Diet-related attitudes and behaviorWe also evaluated attitudes and behavior toward having a “balanced meal” by asking about its frequency, beliefs, and participants’ self-efficacy to do it. As for awareness, we asked the participants to answer yes or no to each of the following: taking sufficient vegetables, adequate energy intake, reducing salt intake, taking a “balanced meal”, taking sufficient dairy products, and taking fruits every day, using an original self-administered questionnaire (Supplementary File 2).
Factors contributing to outcomesAfter evaluating the primary outcomes, we conducted an additional survey to investigate the factors contributing to the results using an original self-administered questionnaire (Supplementary File 3) in April 2021. The variables collected were the frequency of using the CVS, the information provided by the CVS, and purchasing a “healthy set” salad and yogurt at the CVS.
As confounders, occupation, work shift, living alone, and frequency of referring to nutrition labells were also collected using the same self-administered questionnaire.
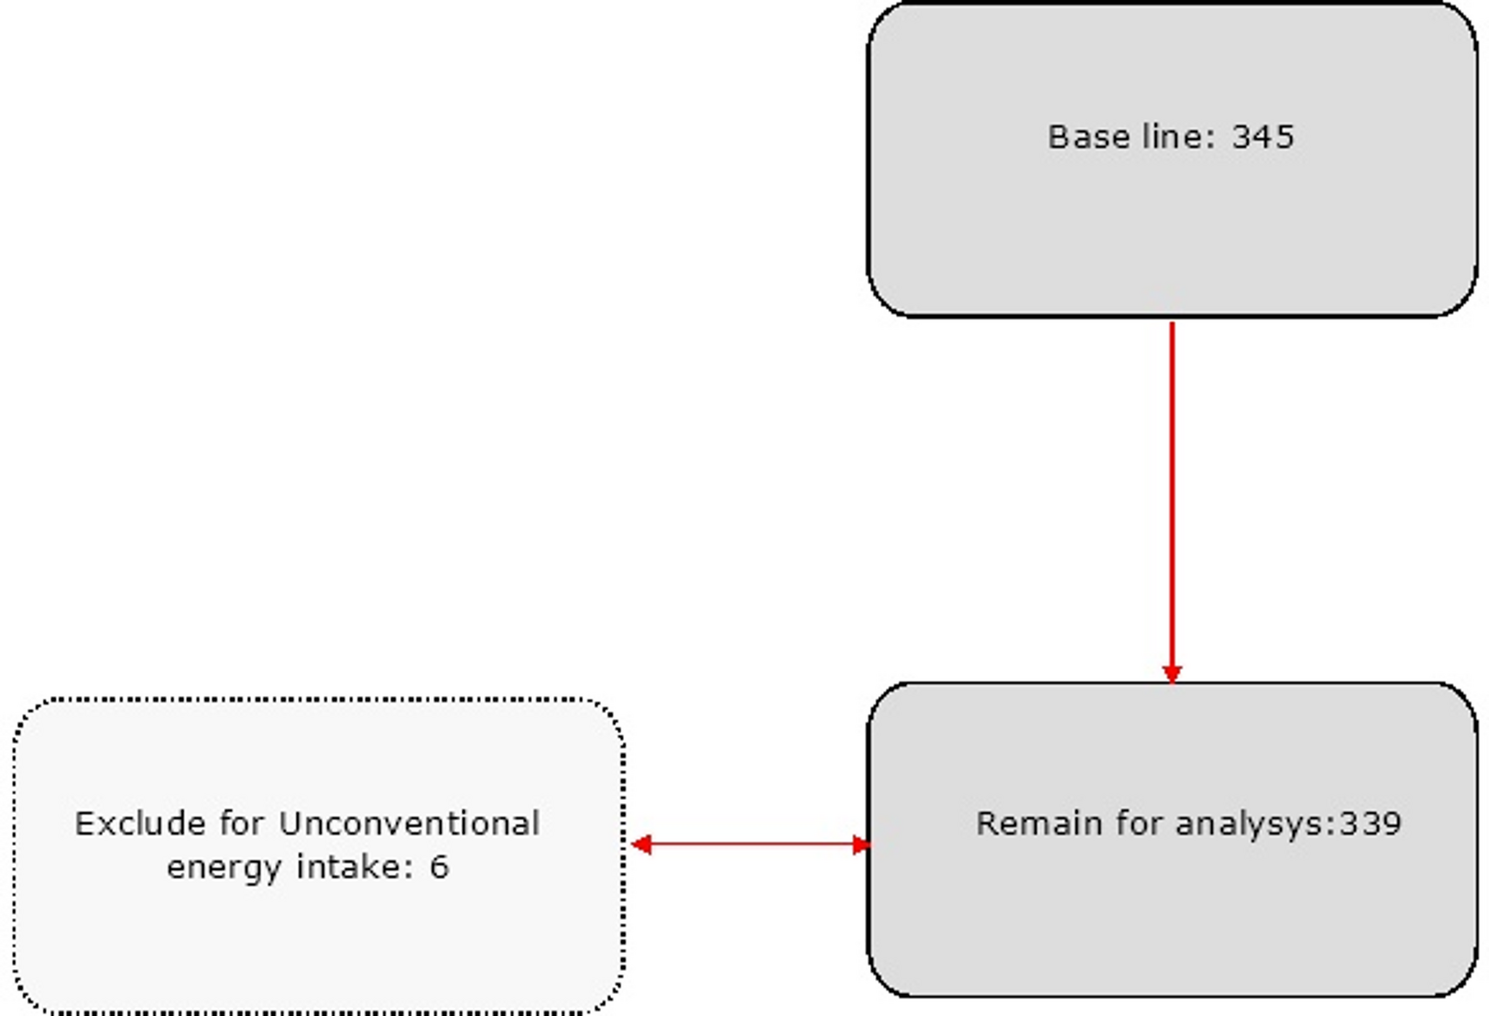
AnalysesSubjectsThe subject selection procedure is shown in Fig. 1. As reported by Sasaki, energy intake values that were likely severely under- or over-reported were excluded from statistical analyses [44]. This included nine participants with an estimated energy intake calculated using the BDHQ less than half the energy requirements for the lowest physical activity level (PAL: I). There were no over-reporters with more than or equal to 1.5 times the energy requirement of the highest physical activity (PAL: III).
We also excluded one subject with missing urine data, resulting in 140 staff members meeting the inclusion criteria.
Statistical analyses (1)Pre-post comparison
Preliminary analyses showed no significant difference in the indicators by sex, age group, work shift, or living alone; therefore, we decided to compare them as a whole. Wilcoxon’s signed rank-sum test was used for changes in the Na/K, and paired t-tests were used for changes in E24HNaV, E24HKV, nutrient and food group intake, and BMI.
Changes in dietary consciousness were analyzed using the McNemar test, and dietary attitudes, behaviors, and BMI categories were analyzed using the McNemar-Bowker test.
All statistical analyses were performed using the Statistical Package for the Social Sciences Statistics (SPSS) 25 made by International Business Machines Corporation (IBM), and the significance level was set at 5%.
(2)Path analysis
First, we hypothesized that there were two ways to change staff’s food intake following the model of Glanz, et al. [21]. One is that the exposure to the intervention (using CVS, using information from the CVS, frequency of purchasing “healthy set”, salad, and yogurt) directly influenced their food intake, the other is the intervention change their attitude and behavior (awareness of taking "balanced meal", taking sufficient vegetable, taking fruits every day, reducing salt, self-efficacy to take "balanced meal", frequency of taking "balanced meal") which influenced their food intake. Under this hypothesis we performed a multiple regression analysis (stepwise method) to predict the change in Na/K and E24HKV based on the intervention factors, dietary attitudes and behavior as the outputs of the intervention. Age, sex, occupation, and dietary attitude/behavior at baseline were adjusted for confounding factors.
Subsequently, we created a causal model based on the results and performed path analysis. The path diagram was laid out, confirming the standardized partial regression coefficient (β) of the multiple regression analysis. The model fit indices the goodness-of-fit index (GFI), adjusted GFI (AGFI), comparative fit index (CFI), root mean square error of approximation (RMSEA), and chi-squared/degree of freedom (CMIN/DF). GFI, AGFI, and CFI values are recommended to be above 0.9 [45, 46] and RMSEA is considered to be perfect fit if it’s less than 0.05 and acceptable if it’s less than 0.08. CMIN/DF is suggested to be 5 or less and desirable not to be significant [46]. Thus, we set these as the cut-off values.
SPSS Amos 25 Graphics (IBM) was used for the statistical analyses. The significance level was set at 5%, and variance inflation factor (VIF) values for the level of collinearity were set at 3 [47].
Comments (0)