Ethics statement
The present study was carried out with the approval of the UK Research Ethics Service (approval received on 18 September 2018 from Wales Research Ethics Committee (REC 3) reference 18/WA/0092) and UK Medicines and Healthcare products Regulatory Agency (MHRA) for Clinical Trial Authorisation (approval received on 26 June 2018). Written informed consent or assent was obtained from all participants. The trial was conducted in compliance with the principles of the Declaration of Helsinki (2013) and the principles of good clinical practice and in accordance with all applicable regulatory requirements including, but not limited to, the UK Policy Framework for Health and Social Care Research 2017 and the Medicines for Human Use (Clinical Trial) Regulations 2004, and subsequent amendments.
Participants were given up to £100 as an expression of gratitude for their commitment to the study.
Study design
The study was a phase 2, multicenter, double-blind, randomized, placebo-controlled trial of safety and efficacy of ustekinumab in preserving endogenous insulin production measured by mixed-meal-stimulated, 2-h plasma C-peptide AUC at week 52 in children and adolescents aged 12–18 years within 100 d of diagnosis of T1D61.
The trial was conducted in 16 pediatric and adult diabetes research centers in the United Kingdom: Royal London Hospital, London; Royal Alexandra Children’s Hospital, Brighton; Countess of Chester Hospital, Chester; East Lancashire Hospitals NHS Trust, Burnley; Evelina London Children’s Hospital, London; Royal Devon and Exeter Hospital, Exeter; St James’ Hospital, Leeds; Leicester Royal Infirmary, Leicester; Norfolk and Norwich University Hospitals, Norwich; St George’s University NHS Trust, London; University College London, London; University Hospital of Wales, Cardiff; Noah’s Ark Children’s Hospital, Cardiff; Swansea Bay University Health Board, Swansea; Ninewells Hospital, Dundee; and Royal Aberdeen Children’s Hospital, Aberdeen.
The investigational medicinal product (IMP) was ustekinumab, a fully human immunoglobulin (Ig)G1κ monoclonal antibody supplied by the marketing authorization holder Janssen-Cilag (EU/1/08/494/002). It was supplied as sterile, single-use, 2-ml glass vials containing 0.5 ml of solution with 45 mg of ustekinumab for injection. Saline in the form of sodium chloride 0.9% w:v solution for injection was used as placebo. Participants were given ustekinumab/placebo (2:1) subcutaneously at weeks 0, 4, 12, 20, 28, 36 and 44, with the dose depending on their body weight (2 mg per kg body weight if the participant was ≤40 kg and 90 mg if >40 kg), and were followed for 12 months after the first dose.
The main inclusion criteria were as follows: 12–18 years of age; clinical diagnosis of immune-mediated T1D as defined by the American Diabetes Association (ADA); started on insulin within 1 month of diagnosis; an interval of ≤100 days between the confirmed diagnosis (defined as date of first insulin dose) and the first planned dose of the IMP; written and witnessed informed consent/assent to participate; evidence of residual functioning β-cells (peak serum C-peptide level >0.2 nmol l−1 in MMTT); positive of at least one islet autoantibody (glutamic acid decarboxylase (GADA), insulinoma-associated antigen 2A (IA-2A) and zinc transporter protein 8 (ZnT8)); and body weight <100 kg.
The main exclusion criteria were: use of immunosuppressive or immunomodulatory therapies including systemic steroids; use of any hypoglycemic agents other than insulin for >6 weeks at any time before trial entry; prior exposure to ustekinumab within 3 months of the first dose of the IMP; prior allergic reaction, incuding anaphylaxis to any component of the IMP; notably abnormal laboratory results during the screening period other than those due to T1D; use of inhaled insulin; known alcohol or drug abuse; evidence of active hepatitis B, hepatitis C, human immunodeficiency virus (HIV) or considered by the investigator to be at high risk for HIV infection; immunization with live vaccines 1 month before trial entry; history of current or past active TB infection; latent TB; substantial systemic infection during the 6 weeks before the first dose of the IMP; and breastfeeding, pregnancy or unwillingness to comply with contraceptive advice and regular pregnancy testing throughout the trial.
Safety laboratory measures of hematological indices, liver function, thyroid-stimulating hormone, urea, creatinine, calcium, lipid levels and Ig levels and urine assessments (pH, blood, protein by dipstick analysis, laboratory analysis for albumin:creatinine ratio) were performed throughout the study. HIV and hepatitis B and C and TB testing were performed at screening. Adverse events were reported by participants and reviewed by the site principal investigator (PI) at all visits.
The trial oversight was performed by a trial steering committee and an independent data safety monitoring board.
International Standard Randomised Controlled Trial Number Registry: registration no. ISRCTN 14274380.
Assaysβ-Cell function
MMTT
Ensure Plus (Abbott Nutrition; 6 ml kg−1 (max. 360 ml)) was used as a mixed-meal stimulant of β-cell production, in the standard MMTT as previously described62. The MMTTs were carried out after an overnight fast at −2, 28 and 52 weeks. Plasma samples for C-peptide and glucose were collected in EDTA and fluoride oxalate bottles, respectively, at 0, 15, 30, 60, 90 and 120 min. Plasma samples were stored at −20 °C and transported on dry ice in batches. Serum C-peptide was measured using an immunochemiluminometric assay (Invitron, cat. no. IV2-004). The detection limit and intra- and interassay coefficients of variation were 0.005 nmol l−1, <5% and <8%, respectively.
Glycemic control
Blood glucose monitoring
All participants were provided with an Abbott FreeStyle Libre blood glucose monitoring system (CGM). Participants were expected to wear a sensor for at least 2 weeks before each study visit and were advised to read their measurements at least 4–7× a day. Anonymized data were sent electronically to the trial office.
HbA1c
HbA1c was tested in the local NHS laboratories of the study sites to guide clinical care. The HbA1c target value was set according to 2015 National Institute for Health and Care Excellence (NICE) guidelines (available at www.nice.org.uk/guidance/ng182015) in agreement with the participant and their clinical care team. An additional blood sample was taken at weeks 0, 12, 28 and 52 for measurement of HbA1c using a high-performance liquid chromatography method in a central laboratory.
Daily insulin dose
Mean daily insulin use was calculated over 7 consecutive days during the 2 weeks preceding all visits and participants were asked to record all insulin usage in their daily diary during those 2 weeks. This value was calculated in international units of IU kg−1 d−1. Where data from consecutive days were not available, the 3 d closest together were used.
Hypoglycemia
Participants were advised by the research staff to record in a trial diary any symptoms possibly related to hypoglycemia and their timing to allow later comparison with glucose monitoring data. A finger-prick blood glucose was recorded in the diary any time hypoglycemic symptoms occurred, even if the glucose monitor sensor was also being worn.
The PI or delegate categorized all hypoglycemic events recorded in the diary according to the ADA guidelines63.
The number of severe hypoglycemic events was recorded at weeks 78 and 104 to cover the period since the previous data collection time point. Severe was defined as:
(1)
Admission to hospital;
(2)
An ambulance being called but no transfer to hospital was needed;
(3)
Being given glucagon but no ambulance was called and no admission to hospital was needed;
(4)
Convulsions (fits) or loss of consciousness.
Body weight and BMI
Body weight and height were recorded at site visits, and the most recent weight recorded was used to calculate drug dosages for forthcoming treatment visits. The BMI was calculated as standard: weight (kg)/(height (m))2.
Patient and parent-reported outcome measures
Quality of life for participants and their parent/carer was assessed at screening and weeks 28 and 52 by validated questionnaires: HYPOFEAR64,65; DTSQ for inpatients66; and PedsQL (generic core scale67,68 and diabetes-specific69,70 modules).
The questionnaires were completed during the latter stages of the MMTT while the participant and parent were waiting for the end of the test. Participant and parent were encouraged not to discuss their responses with each other.
Immunological assays
β-Cell autoantibody measurements
Anti-GADA, anti-IA-2A and anti-ZnT8A were measured by ELISA (GDE/96, IAE/96/2, ZnT8/96; RSR Ltd) according to the manufacturer’s instructions. Positive cut-off values were ≥5, ≥7.5 and ≥15 U ml−1 for GADA, IA-2A and ZnT8A, respectively. Detection limit for GADA was 0.57 U ml−1, for IA-2A 0.95 U ml−1 and for ZnT8A 1.2 U ml−1.
Flow cytometry
Intracellular cytokine staining: 100 μl of fresh sodium heparin blood were stimulated with phorbol 12-myristate 13-acetate–ionomycin for 3 h using the DURActive1 DuraClone tubes (Beckman Coulter), according to the manufacturer’s instructions. After the end of incubation, the blood was stained with Live Dead Yellow dye (Invitrogen) at room temperature for 20 min. The blood was then lysed, fixed and permeabilized using the PerFix-nc kit (Beckman Coulter), according to the manufacturer’s instructions. The cells were then transferred and stained in the dark at room temperature for 45 min using the DuraClone IF TH cell tube (Beckman Coulter), with the addition of drop-in antibodies targeting GM-CSF, IL-2 and CD8-PC5 (all diluted 1:50) as shown in Supplementary Table 7. The cells were then washed and acquired in the Beckman Coulter Navios flow cytometer. Flow data were analyzed using Kaluza software (Beckman Coulter).
Cell surface phenotyping: 100 μl of fresh EDTA blood was stained with three panels of antibodies including: (1) a modified Beckton Dickinson TBNK reagent Trucount tube to identify and determine the percentages and absolute counts of T, B and NK cells as well as Treg cells; (2) a Beckman Coulter DURAClone IM T cell subset tube to assess maturation stages of T cells, covering naive, effector, memory and terminal differentiation stages; and (3) a modified Beckman Coulter DURAClone Treg cell tube to assess FOXP3 Treg cells and NK cell subsets. Details of the panels and indicative gating strategies are shown in Supplementary Table 7 and Supplementary Fig. 1. Tubes were processed according to the manufacturer’s instructions, acquired on a Navios flow cytometer and analyzed using Kaluza software.
Cytokine FluoroSpot: a million cryopreserved PBMCs were incubated in three wells of a freshly coated FluoroSpot plate (Mabtech) with 30 µg ml−1 of proinsulin (in-kind contribution from L. Vilela, Biomm, Brazil) or phosphate-buffered saline (as a negative control) for 48 h. IFNγ-, IL-17A- and IL-17F-secreting cells were detected according to the manufacturer’s instructions (Mabtech). Enumeration of spots was carried out using the IRIS FluoroSpot reader (Mabtech) and results presented as an SI (spot number in the presence of stimulus/spot number in the presence of appropriate negative control). All immune analyses were performed blinded to treatment group and then analyzed when a final locked dataset was sent to the PIs.
Statistical analysisSample size considerations
The power calculation closely followed ref. 71 based on data for children and young adolescents aged 13–17 years as well as the T1DAL study in 12–35 year olds72. A sample size of 66 apportioned in a 2:1 ratio has a >85% power to detect a 0.2 nmol l−1 difference between the 2-h MMTT mean AUC values. C-peptide values of the intervention and placebo arms were assumed to be 0.5 and 0.3 (nmol l−1), respectively, at 12 months. It was planned for 72 participants (48 ustekinumab:24 placebo) to be recruited, allowing for approximately 10% lost to follow-up.
Randomization
Each randomization was via minimization incorporating a random element and incorporated two important prognostic factors: age (12–15 years versus 16–18 years) and screened peak C-peptide levels (0.2–0.7 nmol l−1 versus >0.7 nmol l−1) to ensure balance between treatment groups. Sealed Envelope Ltd (https://sealedenvelope.com/randomisation) supplied the minimization algorithm and randomization service and hosted the web-enabled allocation service.
Blinding
Participants, research staff and the trial office remained blinded, with only limited independent researchers at Swansea Trials Unit (STU) managing the code break list and any IMP-related queries from pharmacies.
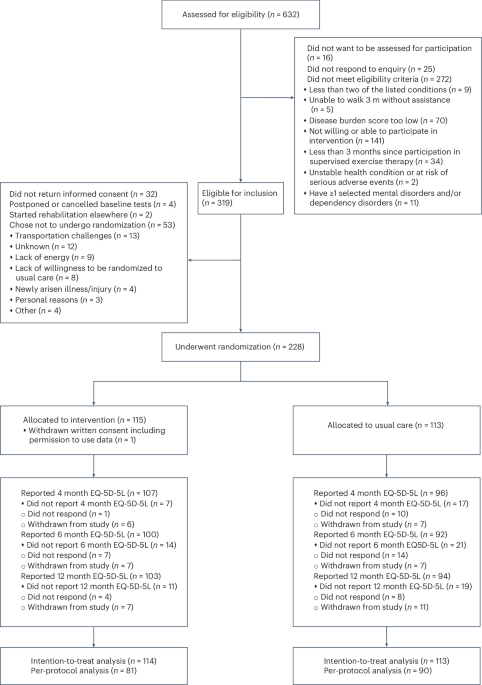
Analysis population
All randomized participants who had not withdrawn from the study before the first day of treatment were included in trial analyses and analyzed according to the treatment allocated.
Analysis of primary outcome
The AUC was calculated using the trapezoidal method, not adjusted for baseline C-peptide but normalized for the 120-min period of the standard MMTT using the serum C-peptide value at each time point. Most C-peptide values fell between 0 and 1 and the distribution was positively skewed; they were transformed by log(1 + x) before treatment group comparisons. These comparisons were performed with an independent Student’s t-test at baseline. At weeks 28 and 52, treatment group differences were assessed with ANCOVA adjusting for the baseline C-peptide value, gender, age, HbA1c and exogenous insulin use. Results were back-transformed and summarized as the ratio of geometric means and percentage differences between groups48,61.
Analysis of secondary outcomes
Treatment group difference in secondary metabolic endpoints included HbA1c, daily insulin dose and IDAA1c. Treatment group differences at baseline were assessed with independent Student’s t-test. Week 12, 28 and 52 treatment group differences were analyzed with ANCOVA, adjusting for appropriate covariates. HbA1c and insulin use analyses post-baseline were adjusted by sex, age, HbA1c and insulin use at baseline. IDAA1c was calculated according to the formula: HbA1c (%) + (4 × insulin dose (units per kg per 24 h))73. Post-baseline IDAA1c analyses were adjusted by sex, age and IDAA1c at baseline. Results were summarized as differences in arithmetic means between groups.
Analysis of safety outcome
Safety assessments (that is, safety blood and urine tests and IMP-related adverse events during the course of the study) were counted in terms of both number of events and number of participants. For participants experiencing more than one adverse event, each participant was counted once at the highest level of severity for the event. No formal statistical testing was undertaken.
Data collection and analysis
Data were collected using electronic case report forms via MACRO 4.7. Data were analyzed using SPSS v.25 and STATA v.18.
Data visualization
Dot plots were constructed in R 4.3.0 using packages ggplot2, cowplot, scales and patchwork. All other plots were constructed in Stata.
Reporting summary
Further information on research design is available in the Nature Portfolio Reporting Summary linked to this article.


Comments (0)