Blood Specimen Collection
Venous blood was collected from 40 TBI patients upon admission, with an additional 20 healthy volunteers serving as controls. Both groups of patients were randomly selected based on age, gender, and BMI. (P > 0.05). Patient selection criteria were: a Glasgow Coma Scale score of 8–13; age between 18 and 55 years; TBI within the day before admission. Exclusion criteria were severe complications such as significant infections upon admission; a history of intracranial lesions, psychiatric disorders, or similar injuries; pregnancy or lactation. Detailed patient information is provided in Supplementary Table 1.
Depression-Like Behavior Tests in Patients
We utilized the Chinese version of the SDS to assess depressive symptoms (Zung, 1965). Developed by Zung in 1965, the SDS consists of 20 items covering emotional, psychological, and cognitive aspects. Elevated scores signify more pronounced depressive symptoms. For this study, we established a threshold of 53, deeming total scores exceeding this value indicative of the presence of depressive symptoms (Xing et al., 2021).
Animals Experiments
The sample size for animal specimens was calculated using an online tool (http://www.lasec.cuhk.edu.hk/sample-size-calculation.html). A cohort of 105 male C57BL/6 mice, aged 6–8 weeks, were procured from the Animal Experimental Center of Chongqing Medical University and received appropriate care in accordance with the guidelines set by the Institutional Animal Care and Use Committee of Chongqing Medical University. The mice were allocated to different groups, including TBI, TBI + FMOD, TBI + sh-FMOD, TBI + sh-NC, and Sham, using a simple randomization approach. Fifteen mice from each group were involved in the behavioral experiments and subsequently used for sample collection and analysis at the conclusion of the study. Additionally, an extra 30 mice (five per group) were utilized to determine the time course expression levels of FMOD. Throughout the entire experimental and data analysis processes, the researchers remained unaware of the animals’ grouping.
TBI Mouse Model Establishment
To mimic TBI in mice, controlled cortical impact (CCI) was selected, based on previous studies (Osier & Dixon, 2016; Wu et al., 2022). In summary, mice were initially anesthetized with 3% isoflurane. Anesthesia was then maintained at a level of 1.5% isoflurane, and the mice were subsequently secured in a stereotactic frame. A bone flap above the left frontal lobe was removed, with surgical coordinates centered on the posterior fontanelle (2 mm posterior, 2 mm lateral). CCI was performed using an electronically controlled pneumatic impact device (PSI, USA). A 3 mm-diameter flat impactor, penetrating to a depth of 1.5 mm at a velocity of 5 m/s, was applied to the surgical site on the stereotaxic frame, with a dwell time of 100 ms. In the sham group, mice were anaesthetised solely for the scalp incision and craniotomy, and were subsequently transferred back to the recovery cage after resuscitation. In the remaining group, mice had their scalps sutured immediately after impact and were placed on a heating pad maintained at a constant temperature of 37 °C. Following resuscitation, these mice were also transferred back to the recovery cage.
Adeno-Associated Virus (AAV) Intracerebroventricular Injection
On day 7 after TBI, mice were anesthetized in the same manner as the CCI procedure and were mounted on a stereotactic device (Stoelting, USA). Injections were made to the left lateral ventricle (coordinates from the bregma: anteroposterior (AP) − 0.5 mm, lateral (L) − 1 mm, dorsoventral (DV) − 3 mm). The AAV-containing solution was loaded into a sterilized 5 µl Hamilton syringe (Hamilton, USA). Animals received 2 µl of either FMOD short hairpin (sh) RNA (sh-FMOD) or empty vector (sh-NC) (Qingke Biotech, Beijing, China) at a rate of 0.4 µl/min (exact sequence can be found in Supplementary Table 2); the needle was left in place for another 5 min before being slowly retracted after injection.
Intranasal Delivery of FMOD
The acclimation training started on day 9 post-TBI and lasted for seven days, during which all groups were administrated with 0.9% saline (20 µl/mice/day). On day16 after TBI, the TBI + FMOD group received a 5 µg of FMOD (Sino Biological, 11514-H02H, China) formulated in 20 µl phosphate buffered saline once a day, while the remaining groups received the same amount of saline; the solutions were given intranasally for five days.
Modified Neurological Severity Score (mNSS) Test
On day 28 after TBI, we evaluated the neurological recovery of rats using the mNSS test, which assesses various aspects, including motor coordination, sensory function, balance, and reaction time, providing a comprehensive evaluation of rodent neurological function. Scores on the mNSS range from 0 to 18, and a higher total score reflects more severe neurological deficits.
Forced Swimming Test (FST)
The FST is a widely used and validated assessment for depression in rodents, reflecting their behavioural responses to depressive or antidepressant compounds (Cryan et al., 2002). During the test, mice respond to unavoidable acute stressors by oscillating between struggling and remaining immobile. The test involves individually housing mice in transparent cylinders (25 cm high and 20 cm in diameter) filled with water (24 °C) at a depth of 19 cm. The total stress exposure duration is 6 min, and the quiescence duration represents the period in which a lack of avoidance behavior is observed during the last 4 min of the experiment (Ghasemi et al., 2009).
The Tail Suspension Test (TST)
The TST is a widely employed experimental approach to evaluate antidepressant effects in mice or rats (Zhang et al., 2019). Following acclimation to a tranquil and dim environment, mice are individually suspended by their tails on a horizontal bar for 6 min. Different behaviors, including struggling, curling, and immobility, are observed throughout this period, with a specific focus on immobility during the last 4 min.
The Sucrose Preference Test (SPT)
The SPT is utilized for the evaluation of hedonic-lack behavior, a fundamental manifestation of depression. The SPT methodology, with minor adjustments derived from prior investigations (Ghasemi et al., 2009), included acclimating animals to 1% sucrose solution (w/v) and water for 24 h, succeeded by a 12-h period of water and food deprivation. Following this, mice were exposed to two bottles, each containing 150 ml of 1% sucrose solution (w/v) or water. The weights of the bottles were measured both before and after the testing. The sucrose preference results were calculated as the ratio of consumed sucrose solution to the overall liquid intake.
Electroencephalogram (EEG)
On day 28 following TBI, we conducted EEG to assess sleep patterns and cerebral electrical activity in mice. Sleep was induced by administering 3% chloral hydrate (5 ml/kg, Macklin, Cat#C804539, China). Active electrodes were placed under the scalp on both sides of the parietal cortex, and reference electrodes were situated above the mastoid. Cerebral electrical activity was monitored using an EEG device (Natus Neurology Inc., Middleton, Wisconsin, USA), allowing the visualization of sleep electroencephalogram and facilitating the analysis of diverse sleep stages.
Transmission Electron Microscopy
1 mm3 ipsilesional hippocampus tissues collected on day 28 were prepared as previously described (Wu et al., 2022). The samples were cut in ultrathin Sects. (70 nm) and stained with uranyl acetate and lead citrate. We observed the synapse ultrastructural changes using a transmission electron microscope (JEOL JEM-1400PLUS, Japan) and analyzed the vesicle number and postsynaptic density (PSD) length.
Golgi-Cox Staining and Dendritic Spine Analysis
To study the morphological changes of the mouse hippocampus, the FD Rapid Golgi Stain Kit (FD NeuroTechnologies, PK401, USA) was applied to stain the neurons. Hippocampal samples collected on day 28 were prepared as per the manufacturer’s protocol. Brain slices were immersed in the impregnation solution and were stored in the dark for 2 weeks. The dendritic images were obtained using a laser-scanning confocal microscope (Zeiss LSM800, Germany), and analyzed using the Sholl Analysis plugin on the ImageJ software.
Cell Culture, Transient Transfection, and Scratch Assay
Cultured from C57BL/6 mice brains on postnatal day 1 (P1), primary hippocampal neurons were dissociated and seeded at a density of 1,000,000 cells per well in a 6-well plate, following established procedures (Henderson et al., 2020). The culture medium consisted of Neurobasal medium (Gibco, 2,444,904, USA), supplemented with B27 (Gibco, 17,504,044, USA), 2 mM GlutaMax (Gibco, 35,050,061, USA), and 100 U/mL penicillin/streptomycin (Meilunbio, MA0110, China). Cells were incubated at 37 ℃ in a 5% CO2/95% air environment, with medium replacement every 3 days. Transient transfections were conducted using the Lipofectamine 3000 transfection kit (Thermofisher, USA) between days 5 and 12 in vitro. For scratch assays on day 13 in vitro, a sterile 10 μL pipette tip was used to create scratches along a 9 × 9 grid (4 mm intervals) on the 6-well plate surface, followed by medium replacement.
Real-Time Quantitative PCR
The TRIzol reagent, following the manufacturer’s guidelines (Invitrogen, USA), was employed to extract total RNA from the samples. The cDNA Reverse Transcription Kit (Thermo Fisher, USA) was then used for cDNA synthesis. Subsequently, quantitative PCR was conducted using SYBR green (SYBR Green qPCR Master Mix, MedChemExpres, USA). The primers for FMOD were designed as 5′-CAACACCTTCAATTCCAGCA-3′ and 5′-ACCTGCAGCTGGGAGAAGT-3′, while those for GAPDH were chosen as 5′-GCACCACCAACTGCTTAGCACC-3′ and 5′-GTCTGAGTGTGGCAGGGACTC-3′.
Western Blot
Proteins were extracted from both contralesional and ipsilesional hippocampus samples collected on day 28, as well as cells. The samples were loaded onto SDS-PAGE, followed by protein transfer to PVDF membranes (Millipore, USA). Incubation with primary antibodies (1:1000) was conducted overnight at 4 °C. Subsequently, bands were visualized using enhanced chemiluminescent substrates (Sigma-Aldrich, WBKLS0100, USA) after incubation with HRP-conjugated secondary antibodies at room temperature for 1 h. Internal control was maintained with β-actin (Zenbio, 200,068-8F10, China). Quantification and analysis of the gray value were performed using ImageJ software. Each experiment was replicated three times. The primary antibodies and reagents utilized included GFAP (ZEN BIO, 250,027, China), FMOD (GeneTex, GTX102783, USA), PSD95 (GeneTex, GTX22723, USA), SYP (GeneTex, GTX100865, USA), MAP2 (Proteintech, 17,490-1-ap, China), PI3K (Zenbio, 251,221, China), p-PI3K (Zenbio, 310,164, China), AKT (Zenbio, R23412, China), p-AKT (Zenbio, 310,021, China), mTOR (Zenbio, 380,411, China), p-mTOR (Zenbio, 381,557, China), and LY294002 (CAS: 154,447-36-6; Meilunbio).
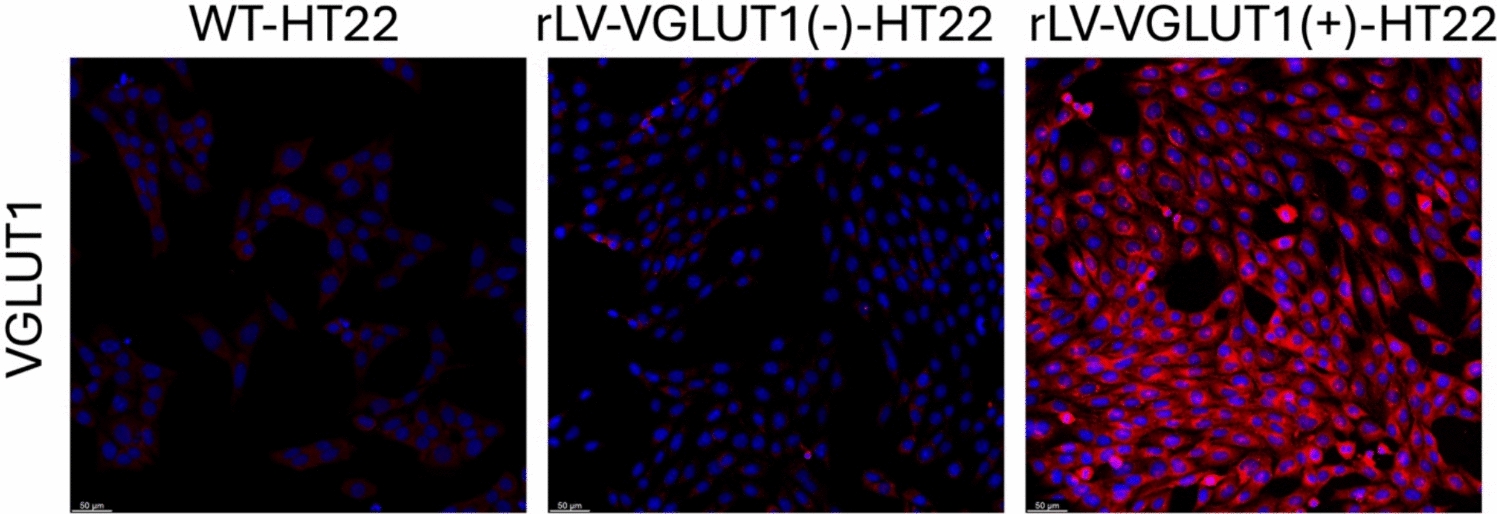
Immunofluorescence
After embedding in O.C.T. compound (Sakura Tissue-Tek, Japan), brain samples underwent rapid freezing in isopentane at − 80 °C for 5 min to ensure complete freezing. Subsequently, the cryostat was employed to prepare frozen brain sections. Cells, which were fixed with formaldehyde, and brain sections were subjected to an overnight incubation at 4 °C with the corresponding primary antibodies (1:100). Following this, they underwent incubation at room temperature with secondary antibodies conjugated with Fluor 488/594 (Invitrogen, 1:400, USA) for 1 h. Cell nuclei were identified using a culture medium containing DAPI (Solarbio, C0065, China). Results captured under a confocal microscope (Zeiss LSM800, Germany) were analyzed using ImageJ software. The primary antibodies used are as described previously.
Statistical Analyses
Statistical analysis of the data from all experiments was conducted using GraphPad Prism version 9. Results are presented as mean ± SD. Homoscedasticity was assessed using Bartlett’s test. Comparisons between two independent groups were performed using a two-tailed t-test. Data sets involving more than two groups were analyzed using one-way or two-way ANOVA, followed by Tukey’s multiple comparisons test. Statistical significance is indicated as follows: *p < 0.05, **p < 0.01, ***p < 0.001, and ****p < 0.0001.


Comments (0)