Study design
The study employed a cross-sectional, web-based survey among a national convenience sample of US adults with SCD. All study procedures were approved by the University of Mississippi Institutional Review Board (Protocol #21x-130) under exempt status.
Participants
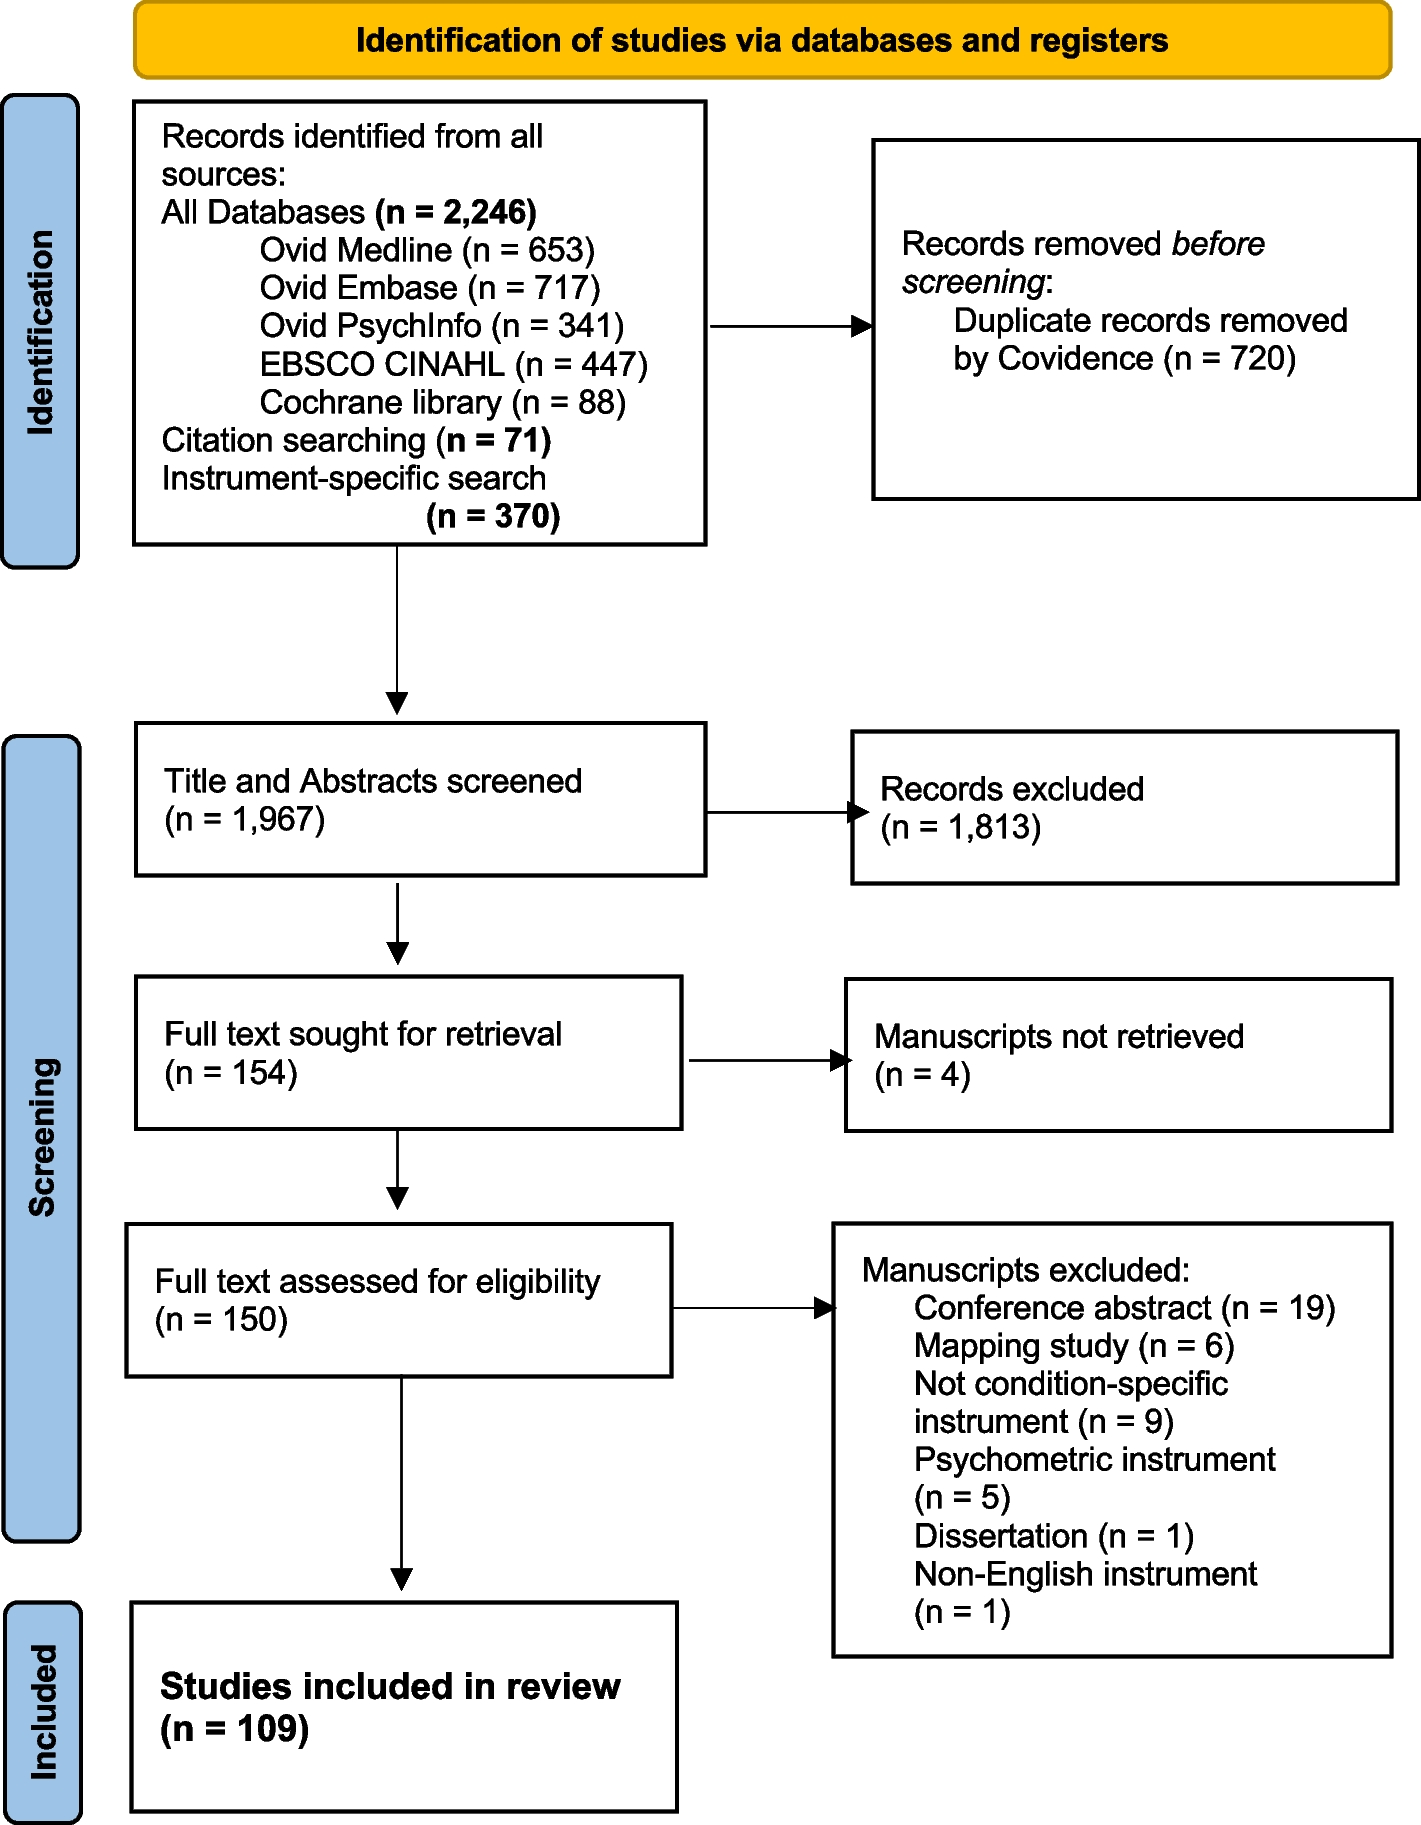
The study sample included adults (≥ 18 years of age) with SCD, recruited with the help of Rare Patient Voice, a market research company that maintains a panel of SCD patients. Most of the patients in the panel have been recruited at SCD-related conferences and patient advocacy group meetings across the US. Given the nature of the statistical analysis plan for this study (i.e., CFA via structural equation modeling (SEM)), an a priori sample size of 200 patients with SCD was considered to be adequate [19]. Potential participants received an email outlining the purpose of the study, assuring confidentiality, and containing a Qualtrics survey link [20]. Respondents were provided a $15 Amazon gift card for participating.
Measures
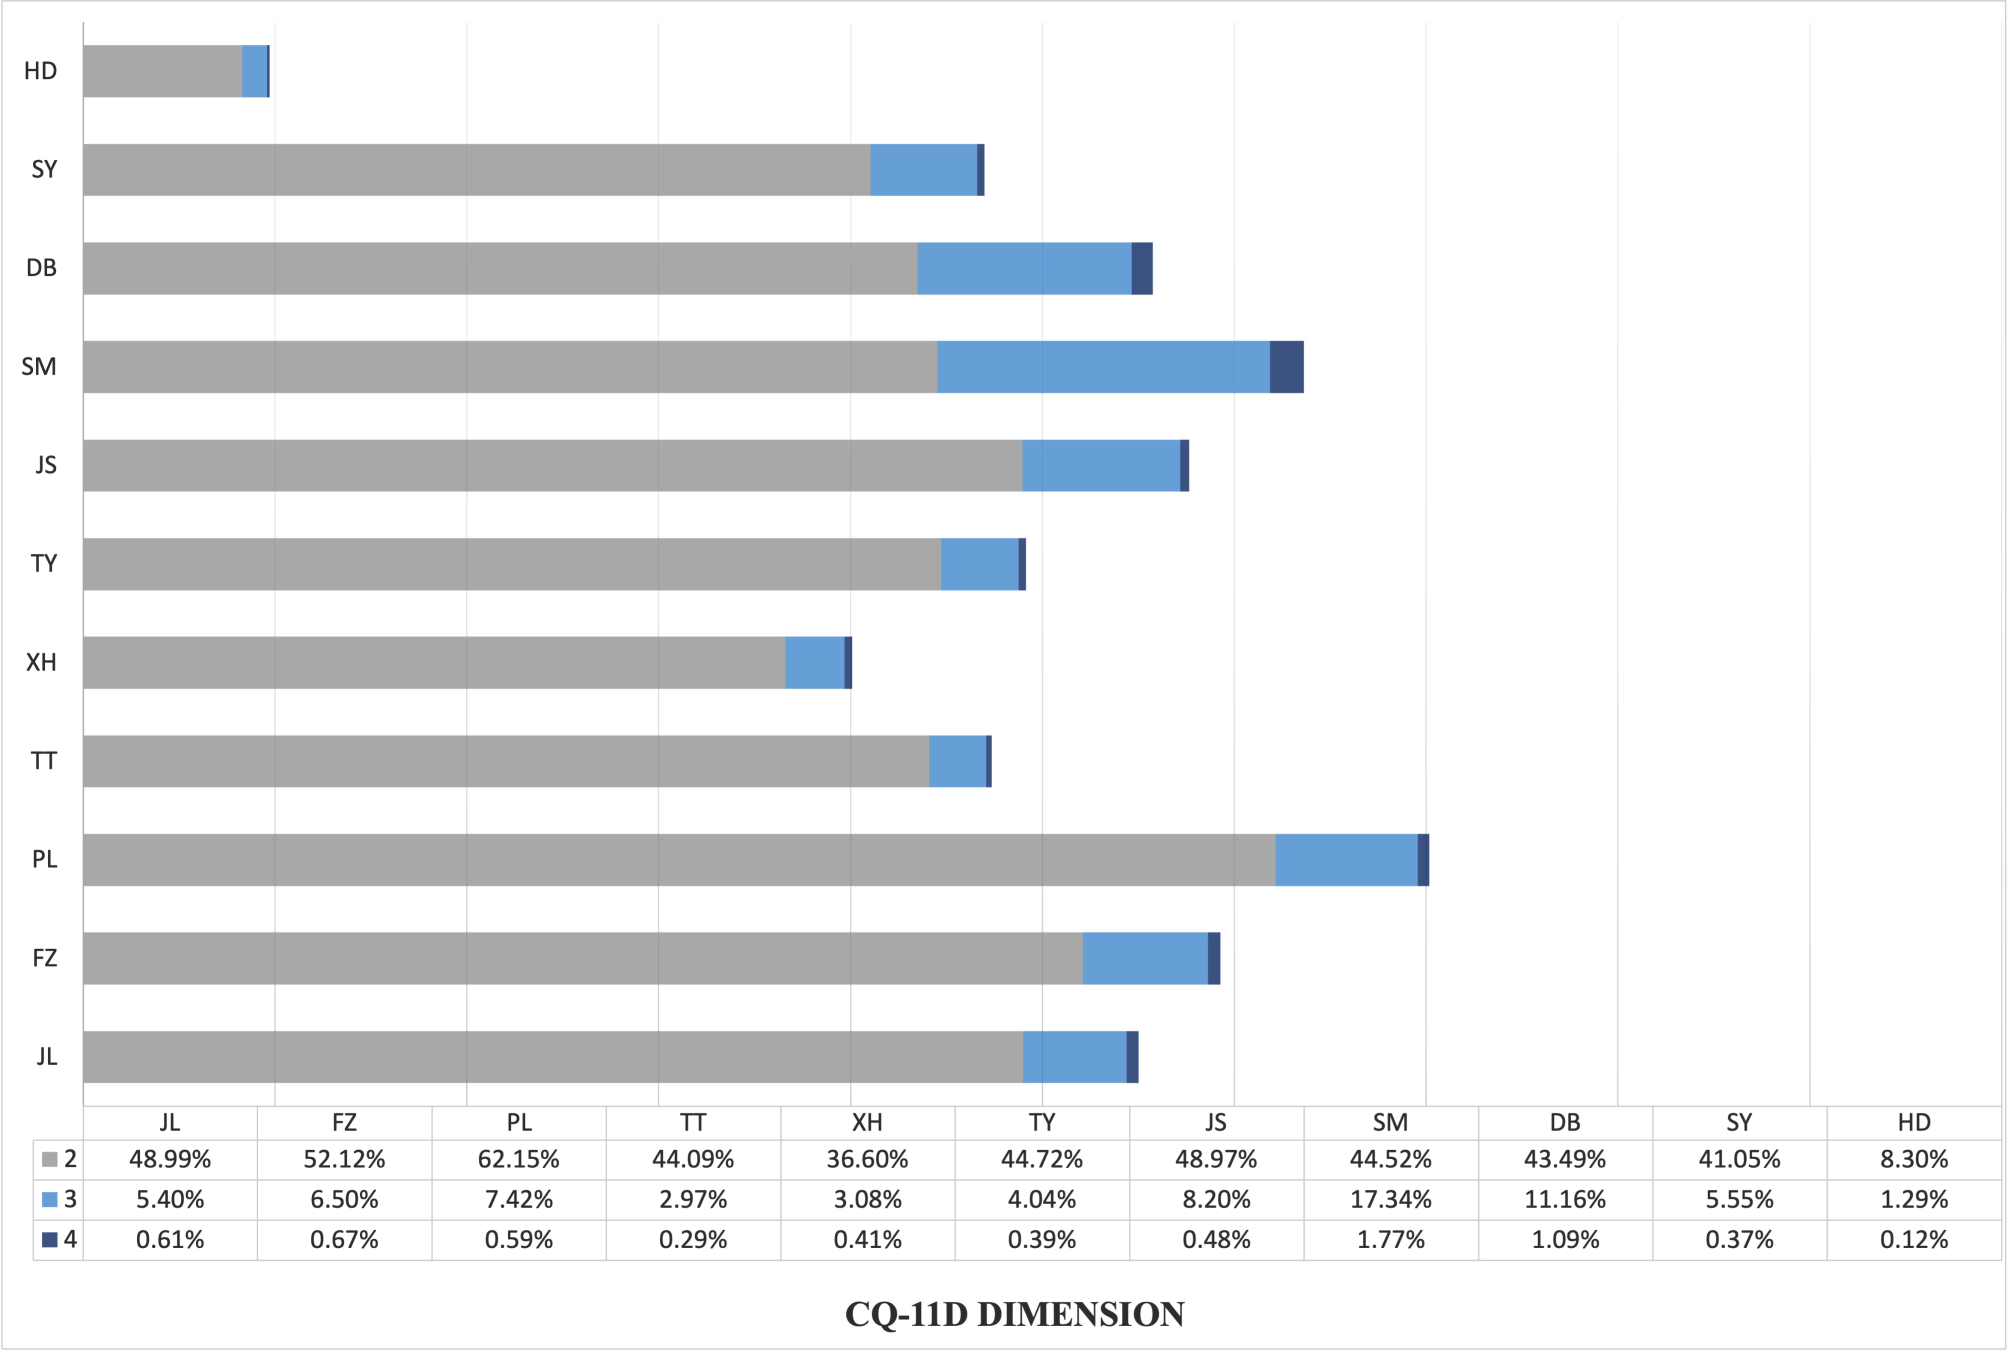
The survey instrument measured individual respondent demographics, clinical history, and coping strategies. The CSQ-SCD instrument was used to measure coping strategies. The CSQ-SCD consists of 13 subscales with 6 items per subscale: calming self-statements (CSS), diverting attention (DA), ignoring pain sensations (IPS), increasing behavioral activity (IBA), reinterpreting pain sensations (RPS), praying and hoping (PH), catastrophizing (CA), anger self-statements (AS), fear self-statements (FS), resting (RS), heat, cold, and massages (HCM), taking fluids (TF), and isolation (IS) [6]. Respondents rate the frequency of their use of each coping strategy when they feel pain from “0 = never do that” to “6 = always do that.” The instrument has been shown to have moderate to excellent internal consistency reliability (coefficient alphas ranging from 0.69 to 0.91 for the 13 subscales [6] and alphas of 0.80 and higher for the factors underlying the subscales [8]).
As has been done commonly in the psychometric studies outlined above, item responses were averaged to produce a mean for each subscale [6, 8, 16]. The exception to this general strategy was that if a subscale for a respondent had only a response to a single item, then the score for that subscale was set to missing. Two additional aspects were assessed by single items in the CSQ-SCD: perceived ability to control pain and perceived ability to decrease pain [6]. These two global items were not used in subsequent factor analyses, which is also consistent with previous studies [6, 8, 16].
The Adult Sickle Cell Quality of Life Measurement Information System (ASCQ-Me) pain episode measure and the ASCQ-Me medical history checklist were used to report the severity/frequency of pain events and the conditions related with SCD, respectively [21].
Statistical analysis
Sample descriptive statistics were calculated in the form of frequencies and percentages of endorsements for categorical variables and means and standard deviations for continuous variables. Item-level analysis of the CSQ-SCD was conducted in terms of response frequencies as well as means and standard deviations (SD). When encountered, missing data were treated as a category with the number of subjects with missing responses represented as percentages. For CFA, the total available sample was used for the analysis rather than listwise deletion (i.e., full information maximum likelihood estimation, or FIML) [22]. Kurtosis and skewness coefficients were also calculated [19].
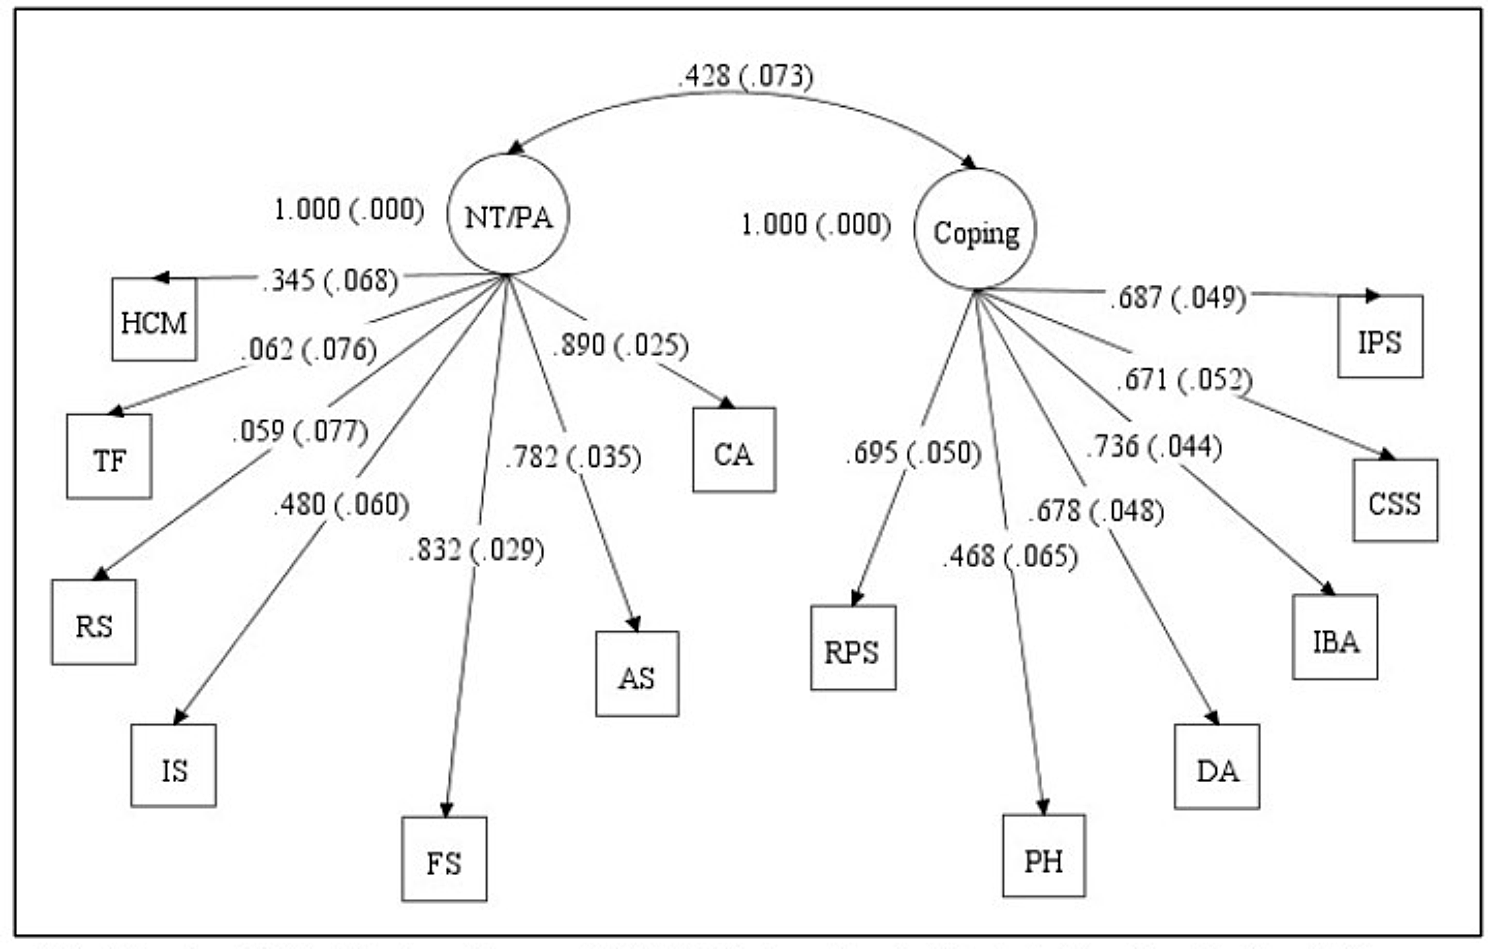
The CSQ-SCD’s factor structure was evaluated using CFA, an SEM technique used to assess the fit of a theoretically-constructed model. Two commonly tested models for CSQ-SCD include a two-factor, second-order model (i.e., using mean subscale scores as factor indicators) [6] and a three-factor, second-order factor model (i.e., using mean subscale scores as factor indicators) [8]. These models were previously explored by Gil et al. [6] and Anie et al. [8], with variations in extraction methods. In the current study, both models were tested using a process akin to higher-order CFA, where mean subscale scores served as factor indicators in a first-order CFA. Higher-order CFA is commonly thought of as consisting of the extraction of factors from first-order factors (this is an example of second-order CFA), which are themselves based on observed indicators (e.g., the items from a scale) [23]. However, Bagozzi and Edwards [24] note that first-order factor analysis of subscale scores – referred to as the partial aggregation model (which is what Gil et al. [6] and Anie et al. [8] actually did) – is conceptually equivalent to a second-order factor model (although not mathematically the same).
For the two-factor model [6], the DA, RPS, CSS, IPS, PH, and IBA subscales were specified to load on the coping attempts factor, while the CA, FS, AS, IS, TF, RS, and HCM subscales loaded on the negative thinking/passive adherence factor. The two factors were allowed to correlate. In the three-factor model [8], the IPS, CSS, IBA, DA, and RPS subscales were specified to load on the active coping factor, the CA, AS, FS, PH, and IS subscales on the affective coping factor, and the RS, TF, and HCM subscales on the passive adherence coping factor. Factors were all allowed to intercorrelate. Due to the continuous nature of CSQ-SCD subscale scores, maximum likelihood estimation (MLE) was used [23]. Higher-order CFA using the individual items was not reported due to estimation problems (i.e., nonconvergence). All CFA models were estimated using Mplus version 8.4 [25]. The following five fit statistics were assessed for each model: χ2 statistic, the root mean square error of approximation (RMSEA), the Tucker Lewis Index (TLI), the comparative fit index (CFI), and the standardized root mean square residual (SRMR). Bagozzi and Yi [26] suggest that for a well-fitting model, the RMSEA, TLI, CFI should be ≤ 0.08, ≥ 0.92, and ≥ 0.93, respectively. For a good fitting model, SRMR should be less than 0.08 [27].
Factor loadings, average variance extracted (AVE), and correlations among the 13 subscales were used to estimate convergent validity of the CSQ-SCD. Standardized factor loadings of 0.5 or higher were considered evidence of adequate validity [28]. Likewise, AVE values of 0.5 or greater were suggestive of adequate convergence [28]. Pearson’s correlations were categorized as small (0.1–0.29), moderate (0.3–0.49), or strong (≥ 0.5) [29]. Subscales comprising each latent trait in the model tested were hypothesized to correlate strongly.
Discriminant validity was assessed using three methods. First, the fit of the best fitting model was compared to that of a similar model where the latent factor correlations (e.g., for the three-factor model, the correlations between active coping, affective coping, and passive adherence coping) were fixed to 1 (latent construct discriminant validity). This test was carried out using the MODEL TEST option in Mplus [23, 25]. A significant difference in the model fit (Wald’s χ2 statistic) was suggestive of discriminant validity [30]. Second, AVEs for each latent variable were calculated and compared to the square of correlation estimates between all possible latent variables. If both AVEs for a given pairwise comparison exceeded the sum of the squared correlation value, this suggested that the latent construct explained a greater proportion of the variance in its indicator items than did another latent construct, indicating discriminant validity [31]. Third, correlations ≤ 0.40 between subscale scores underlying one factor with subscale scores underlying separate factors were indicative of discriminant validity. For example, for the three-factor model, weak correlations of the subscales IPS, CSS, IBA, DA, and RPS with the subscales underlying affective coping (i.e., CA, AS, FS, PH, and IS subscales) and passive adherence coping (i.e., RS, TF and HCM subscales) were hypothesized.
To assess the reliability for the CSQ-SCD, Cronbach’s alpha (α) and McDonald’s omega were calculated for the active coping, affective coping, and the passive adherence coping factors. Values ≥ 0.70 were suggestive of adequate internal consistency reliability, with values ≥ 0.80 considered preferable [32].


留言 (0)