2.1 Cell culture and transfections
Two human pancreatic cancer cell lines PANC-1 and BXPC-3 were purchased from the American Type Culture Collection (ATCC, Manassas, VA, USA). BxPC-3 was maintained in RPMI 1640 medium supplemented with 1 mM sodium pyruvate, 2.5 g/L glucose, and 10% fetal bovine serum (FBS). PANC-1 cells were cultured in Dulbecco’s modified Eagle medium (DMEM) supplemented with 2 mM l-glutamine and 10% FBS. MicroRNA mimic, inhibitor, and corresponding control oligo nucleotides (NC) were obtained from General Biosystem Company (Anhui, China). Small interfering RNA targeting circ_WASF2 (si-circ_WASF2) and circ_WASF2 overexpression vector were designed and synthesized by RiboBio Biotechnology (Guangzhou, China). Transfections of all microRNA oligo nucleotides and vectors were performed using Lipofectamine 3000 (Invitrogen).
2.2 RNase R treatment assay
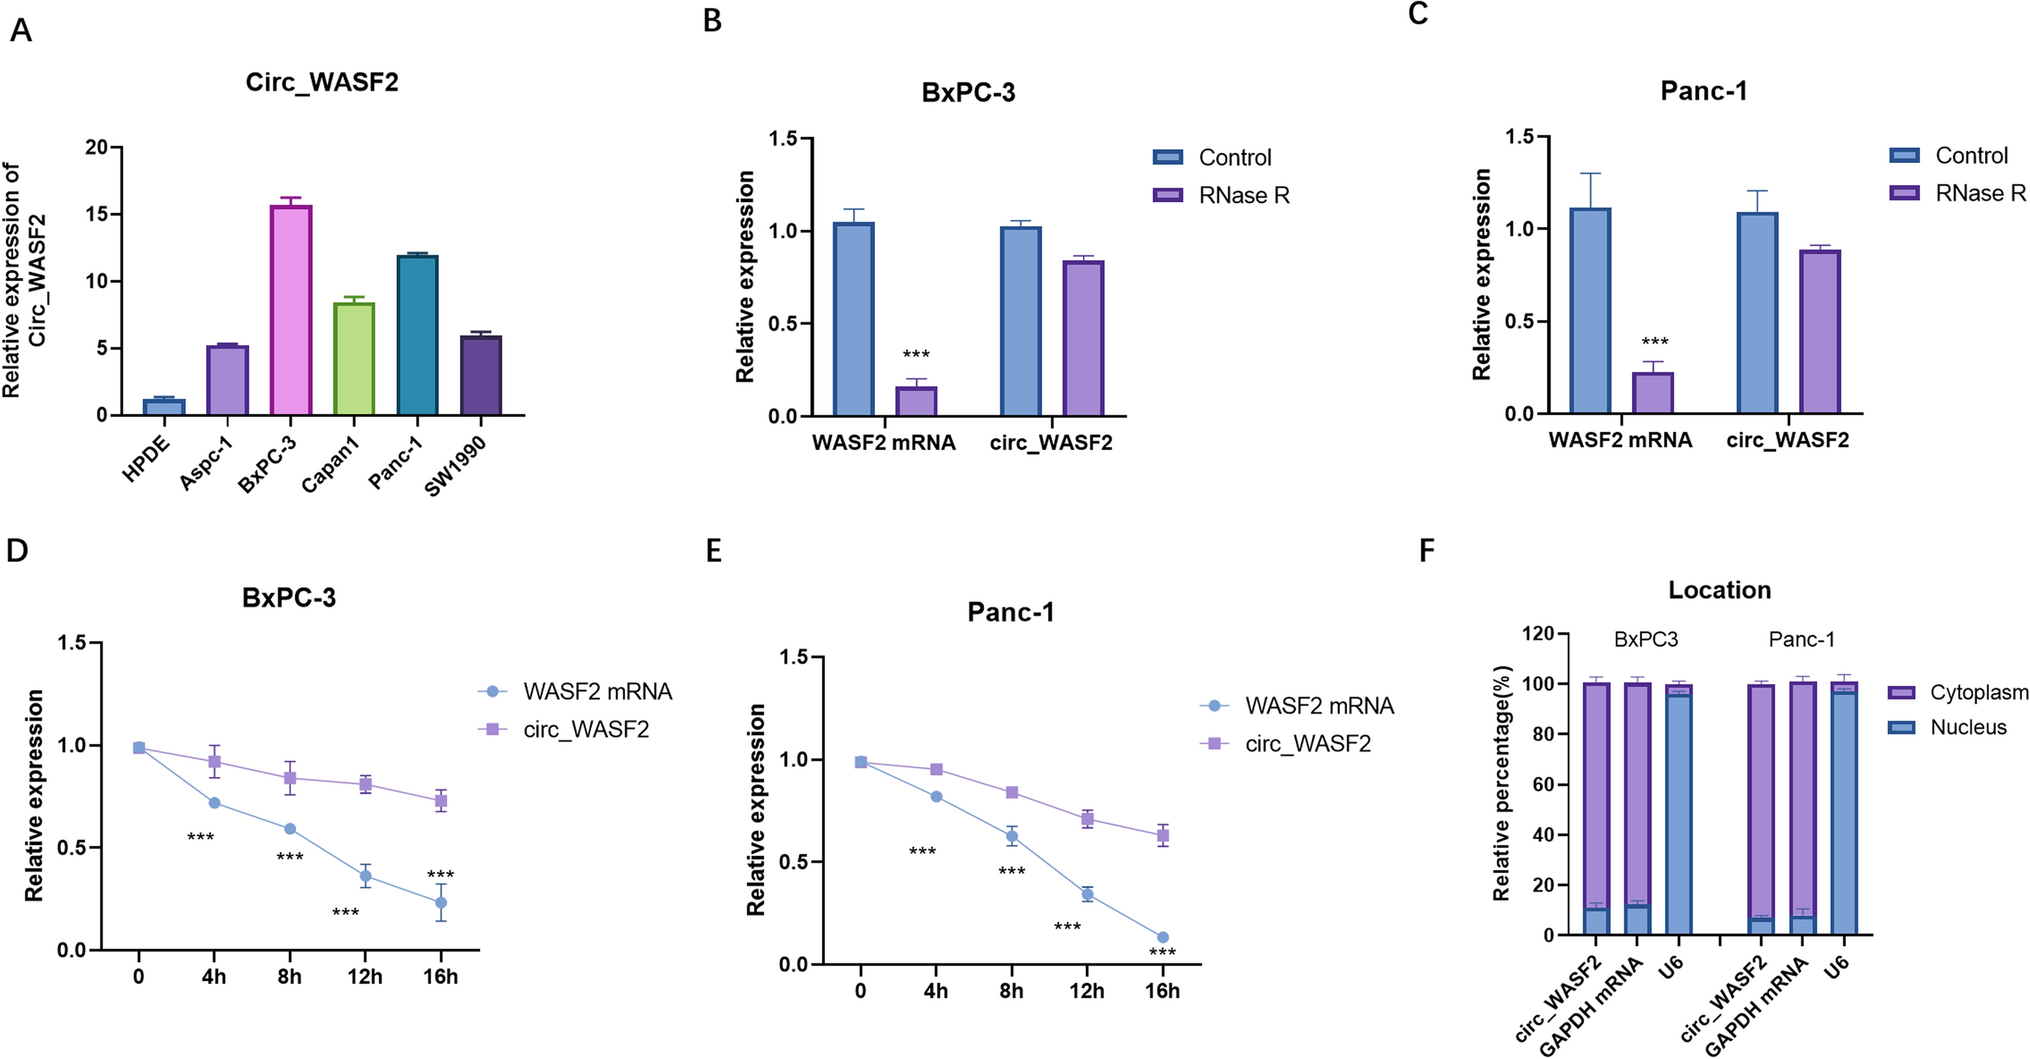
Total RNA was extracted and incubated for 20 min at 37 °C with 3U/μg of RNase R (Geneseed, Guangzhou, China). 2 μg RNA was used for RNase R treatment assay. qRT-PCR was used to detect the expression of circ_WASF2. GAPDH was used as an internal reference.
2.3 Actinomycin D(ActD)treatment
2X10⁵ cells were seeded into a 6-well plate and cultured overnight. Cells were harvested at 0, 4,8,12, and 24 h with 2 mg/L ActD treatment (Sigma, USA). The RNAs were extracted and analyzed by qRT-PCR.
2.4 RNA extraction and quantitative real-time PCR (qRT PCR) analysis
TRIzol Reagent (Thermo Fisher Scientific, Waltham, MA, USA) was used to isolate RNA from PC cells. The PrimeScript RT Reagent Kit (Takara, Dalian, China) was used for reverse transcription. MicroRNA levels were detected using the StepOnePlus TM Real-Time PCR System (Thermo Fisher Scientific, MA, US). Relative expression levels of circRNA, mRNA and miRNA were normalized to GAPDH and U6, respectively. The analysis was performed using the 2−△△CT method.
2.5 Western blot analysis
RIPA buffer (Solarbio, Beijing, China) with proteinase inhibitors was used to isolate proteins from PC cells. The BCA kit (Beyotime) was used to determine the concentration of proteins. 20 μg protein were used for detection. SDS–polyacrylamide gels were applied to separate different proteins. The proteins were then transferred to polyvinylidene difluoride (PVDF) membranes. The PVDF membranes were cultured with 5% fat-free milk for 2 h at 37 °C. The membranes were then cultured with primary antibodies overnight at 4 °C. Anti-GPX4 (ab125066, 1:2000), anti-beta-catenin (ab32572, 1:1000) were obtained from Abcam (Cambridge, UK). The membranes were washed with PBST for 5 min three times and incubated with the indicated secondary antibodies for 45 min. Proteins were detected using an Odyssey infrared imaging instrument (LI-COR, USA).
2.6 RNA pull-down assay
Biotin-labeled probes targeting circ_WASF2 and a control probe (a random oligo probe) were incubated with streptavidin beads (Invitrogen, USA) at 25 °C for 3 h. Incubated PC cell lysis with beads at 4 °C overnight. Subsequently, the beads were washed three times and the beads were eluted. Then, the level was detected by qRT-PCR.
2.7 Dual-luciferase reporter assay
The wild type (WT) or mutant sequence of circ_WASF2 was cloned into pGL3 plasmids (Genechem, Shanghai, China). The wild-type (WT) or mutant sequence of GPX4 3′UTR was cloned into the pGL3 vector. The pGL3 plasmids and miR-634 were co-transfected into PC cells using Lipofectamine 3000. The relative activities of firefly Luciferase and Renilla Luciferase were measured and analyzed using a luciferase reporter assay system (Promega, Madison, WI, USA).
2.8 CCK8 assay
5000 PC cells were seeded in 96-well plates per well and cultured overnight. 10 μl CCK-8 (Dojindo, Japan) was added per well and stored at 37 °C for 2 h. The absorbance of 450 nm was detected by a microplate reader (Tecan Trading AG, Switzerland).
2.9 Cell death assay
Cell death was measured with the Cell Death Detection ELISAplus kit (Roche, Germany) following the manufacturer's protocol.
2.10 Measurement of iron, lipid peroxidation, and reactive oxygen species levels
Fe2+ levels were measured using an iron assay kit (Sigma, USA, MAK025). The levels of reactive oxygen species (ROS) were measured using a Cellular ROS Assay Kit (Abcam, United States). The lipid peroxidation (MDA) levels were measured by a lipid peroxidation (MDA) assay kit (Abcam, United States).
2.11 Statistical analysis
Data are shown as the mean ± SD. Student’s t-test was used to detect statistical differences between the two groups. One-way analysis of variance (ANOVA) was used to detect the statistical difference between multiple groups. P < 0.05 (two-tailed) was considered.

留言 (0)