
記住我
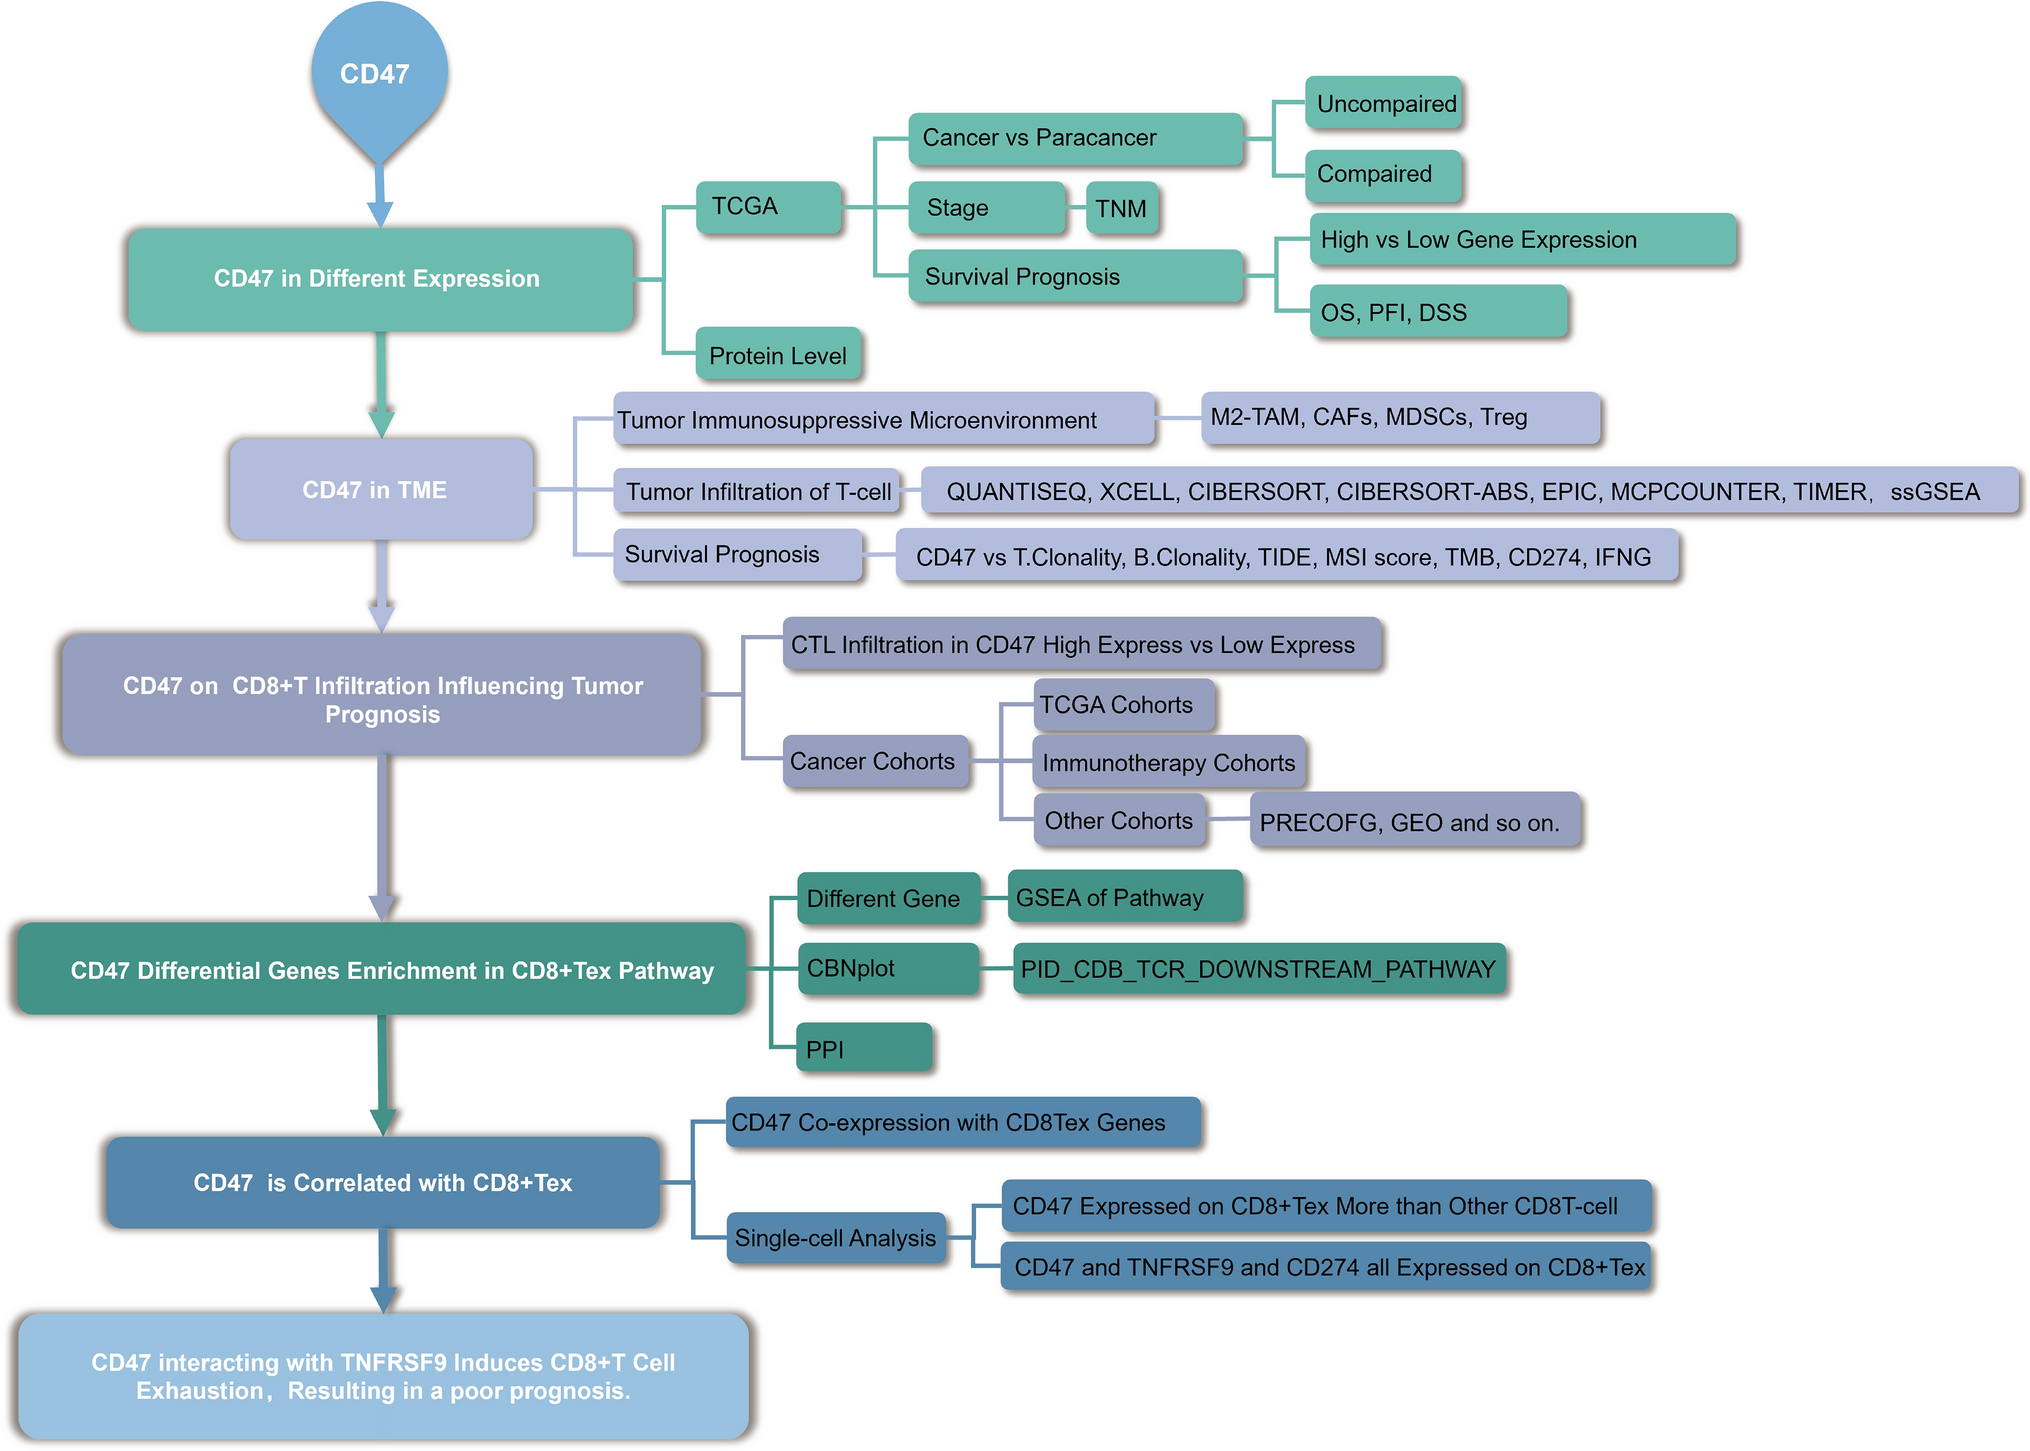
Figure 1 illustrates the schematic diagram of the present study. The study encompasses clinic prognosis and gene data analyses.
Fig. 1
The workflow of the study. TCGA, The Cancer Genome Atlas; TME, Tumor microenvironment; TNM, Tumor Node Metastasis; TAMs, tumor-associated macrophages; CAFs, cancer-associated fibroblasts; aDC (activated DC); B cells; CD8 T cells; CTL(Cytotoxic T cells); DC; Eosinophils; iDC (immature DC); Macrophages; Mast cells; Neutrophils; NK CD56bright cells; NK CD56dim cells; NK cells; pDC (Plasmacytoid DC); T cells; T helper cells; Tcm (T central memory); Tem (T effector memory); Tfh (T follicular helper); Tgd (T gamma delta); Th1 cells; Th17 cells; Th2 cells; Treg, regulatory T cells; CAFs, cancer-associated fibroblasts; MDSCs, myeloid-derived suppressor cells; M2-TAMs; M2 subtype of tumor-associated macrophages. MSI, Microsatellite instability; TMB, Tumor mutational burden; CD274, Cluster of differentiation 274; IFNG, interferon-γ; 4-1BB(TNFRSF9), TNF receptor superfamily member 9; CD8 + Tex, exhausted CD8 T lymphocyte cell
3.2 Abnormal expression of CD47 in pan-cancer patients is associated with tumor stages and poor prognosisWe looked into CD47's carcinogenic potential using the XENA-TCGA GTEx pan-cancer database. When comparing nearly all cancer types to normal tissue, we discovered that CD47 gene expression was higher in the former. (ACC, BRCA, BLCA, CHOL, COAD, DLBC, ESCA, GBM, HNSC, KIRC, KIRP, LAML, LGG, LIHC, LUAD, OV, PAAD, PRAD, READ, SARC, SKCM, STAD, THCA, THYM, UCEC, UCS) (Fig. 2a). Additionally, we delved deeper into the CD47 expression of paired samples within the XENA-TCGA database, yielding identical outcomes to the XENA-TCGA GTEx pan-cancer database across various cancer types including BRCA, CHOL, COAD, ESCA, HNSC, KIRC, LIHC, PAAD, STAD, THCA, and UCEC. (Supplementary Fig. 1a).
Fig. 2
CD47 is aberrantly overexpressed and is associated with poor cancer prognoses. (A) Boxplots showing differential CD47 expression levels (log2FPKM + 1)/ (log2TPM + 1) between tumors in the XENA-TCGA_GTEx database. Box plots showing differential CD47 expression levels (log2FPKM + 1)/ (log2TPM + 1) between tumor and adjacent normal tissues (Paired Patient) across the TCGA database. CD47 is expressed differently in multiple cancers. B Boxplots illustrating the varying levels of CD47 expression (protein) among tumors in the CPTAC database. C Kaplan–Meier curves of cumulative survival differences between TCGA cancer cohorts with high and those with low expression levels of CD47. The presentation showcases TCGA cancers that exhibit statistically significant variations among the cohorts. UCSC XENA (https://xenabrowser.net/datapages/) by the Toil process unified TCGA RNAseq TPM format data processing. (GTEx)The Genotype-Tissue Expression; Significance representation: ns, p ≥ 0.05; *, p < 0.05; **, p < 0.01; ***, p < 0.001
Significantly, we noted an increase in CD47 protein expression in HNSC, PAAD, UCEC, RCC, and OV compared to the normal levels, as indicated by the UALCAN database (Fig. S2b, Supplementary Fig. 1b). Moreover, in cancer, the expression of CD47 was elevated in advanced tumor stages. For example, patients with M1 stage lung squamous cell carcinoma malignancy expressed more CD47 than patients with M0 stage. The same trend's outcomes were observed in THCA, UCEC, PRAD, KIRC, KIRP, and LIHC. (Supplementary Fig. 1c). Subsequently, we discovered a correlation between excessive CD47 expression and reduced overall survival in ACC, BRCA, LIHC, and KICH; decreased PFI in ACC, LUSC, UVM, and decreased DSS in ACC, LUSC, LGG, and KICH. All of these findings point to CD47 could be an early biomarker for cancer detection, staging, and monitoring. (Fig. 2c, Supplementary Fig. 1d). Lastly, the Human Protein Atlas (HPA) database was used to detect the expression of CD47 in human normal tissues. Representative IHC images of CD47 expression in BRCA, HNSC, LUSC, OV, SKCM. (Supplementary Fig. 1e). From the protein expression level, it was again proved that CD47 was highly expressed in tumor tissues, especially on the cell membranes of tumor cells.
3.3 CD47 is related to tumor immune evasion through infiltration by T lymphocyte cellsDue to its association with tumor immunity evasion, we assessed the associations between CD47 expression levels and the infiltration of MDSCs, CAFs, M2-TAMs, and Treg cells through six algorithms (QUANTISEQ, XCELL, CIBERSORT, CIBERSORT-ABS, TIDE, MCPCOUNTER). These types of immune cells could promote T-cell exclusion. Treg and CAF in BRCA-LumA, Treg and CAF in LICH, Treg, MDSC, and CAF in PRAD, and Treg and CAF in THYM were found to positively correlate with CD47 expression. (r > 0.2, p < 0.05, every cell type ≥ 2 algorithms positive, and at least two types of these cells are positive) (Fig. 3a).
Fig. 3
The differential expression of CD47 in tumor microenvironment. A, B The heatmap chart showed correlations of CD47 expression with infiltration by different immune cell types and different immunosuppressive cell types in various TCGA cancer types. C The differential expression of CD47 in Pan-cancer was predominantly associated with CD8 + T cells, CD4 + T cells, DC cells, and macrophages, as demonstrated by the lollipop. Correlation is depicted with a purity-corrected partial (D) Bar plot showing the biomarker relevance of CD47 compared to standardized cancer immune evasion biomarkers in immune checkpoint blockade (ICB) sub-cohorts. The AUC was utilized to assess the predictive efficacy of the test biomarkers in determining the ICB response status. Spearman’s rho values and statistical significance were used. (A. B TIMER database) (C. R3.6.3 ssGSEA). Significance representation: ns, p ≥ 0.05; *, p < 0.05; **, p < 0.01; ***, p < 0.001
Subsequently, we employ the identical cognitive approach to identify the association with T cell infiltration and expression of CD47 through seven different algorithms (QUANTISEQ, XCELL, CIBERSORT, CIBERSORT-ABS, EPIC, MCPCOUNTER, TIMER). The results showed that CD47 expression was positively correlated with infiltration of CD8 + T cell in almost all cancer types. (BLCA, BRCA, BRCA-Basal, COAD, DLBC, ESCA, KIRC, KIRP, LIHC, LUSC, PAAD, PRAD, READ, SKCM, SKCM-Metastasis, STAD, TGCT, THCA, UVM) (r > 0.2, p < 0.05, at least two types of these cells are positive, and at least two types of calculation methods). Interestingly, the infiltration of CD8 + T cell effector memory is comparatively lower in the majority of cancer species compared to other types such as CD8 + T cell central memory and CD8 + T cell naive. As for CD4 + T cell, there were still a lot of CD4 + Tcells closely related to CD47, but it depends on the types of CD4 + T cell. The presence of CD47 in the majority of cancer types was observed to have a positive correlation with the infiltration of CD4 + T cell memory resting and CD4 + T cell Th2, in contrast to CD4 + T cell (non-regulatory) and CD4 + T cell Th1(Fig. 3b).
We further explored which types of T-cell infiltration in tumors were most associated with CD47 using another way. It is worth mentioning that the correlation between CD8 + T cells infiltration and CD47 is the highest in these cancer types (COAD, DLBC, ESCA, HNSC-HPV-, LIHC, LUAD, LUSC, PAAD, STAD) (Fig. 3b). CD47 expression had strong positive correlations with T cell infiltration in various cancer types including BLCA, CHOL, COADREAD, DLBC, GBM, HNSC, KIRC, KIRP, LAML, LUSC, PAAD, PRAD, SKCM, TGCT, READ, STAD, UCS, and UVM. The T cell subtypes that displayed significant associations included T helper cells, CD8 + T cells, CD4 T cells, Cytotoxic cells, Th1, Th2, Th17, as well as Tgd, Tcm, Tem, and TFH. (Fig. 3c, Supplementary Fig. 2a). Furthermore, it suggested a strong association between the infiltration of CD8 + T cells and CD47 in numerous cancer types (DLBC, ESCA, LUSC, OV, SKCM, STAD, TGCT, THCA, UCS, UVM). (r > 0.2, p < 0.05).
Then, we assessed CD47 biomarker relevance by comparing CD47 with standardized biomarkers based on its response outcomes to ICB sub-cohorts and OS predictive ability. Interestingly, we found that in 16 of the 25 ICB sub-cohorts, CD47 alone had an area greater than 0.5% under the AUC. CD47 was predicted to be more valuable than TMB, T. Clonality, B. Clonality, and MSI. Seven, nine, seven, and 13 ICB subgroups had more significant AUC values than 0.5. However, CD47 is lower than CD274, TIDE, IFNG, CD8, and Merck18. Based on these results, it is strongly indicated that CD47 plays a pivotal role in the immune microenvironment of tumors and exhibits a strong association with T-cell infiltration(Fig. 3d). Lastly, We analysed the correlation of CD47 in pan-cancer with other immune checkpoints including immunoinhibitor molecule, MHCmolecule and immunostimula molecule. We found CD47 had strong correlation with CD274, LAG3, IDO1 and TNF receptor superfamily in pan-cancer(r > 0.2, p < 0.05)( Supplementary Fig. 2b).
3.4 CD47 on CD8 + T cells infiltration had an impact on tumor prognosis.Drawing from our prior findings, it can be inferred that the presence of CD8 + T cells exhibited a strong correlation with CD47. Interestingly, we found that in the CD47 High group, the level of Cytotoxic CD8 + T cell was more frequently observed in BLCA, BRCA, CESC, COAD, COADREAD, ESAD, ESCA, GBM, HNSC, KIRC, LUSC, OV, SKCM, STAD, TGCT, THCA, UCS types compared to the CD47 low group based on TCGA database. (Fig. 4a, Supplemental Fig. 3a) Then we further identified the same conclusion in Multiple immunotherapy cohorts (Nathanson2017_CTLA4-OS, Gide2019_PD1-OS, Gide2019_PD1 + CTLA4-OS, Miao2018_ICB-OS, Mariathasan2018_PDL1-OS, Riaz2017_PD1-OS, Liu2019_PD1-OS Zhao2019_PD1-OS, VanAllen2015_CTLA4-OS) (Supplemental Fig. 3b).
Fig. 4
CD47 on CD8 + T cells Infiltration Influenced Tumor Prognosis. A The violin diagram illustrates the disparity in CD47 expression within the infiltration of Cytotoxic CD8 + T-cell. Kaplan–Meier curves (the first picture on the left) of survival ratios as a measure of the BTCGA cohorts C immunotherapeutic response (immune checkpoint blockade) between cancer cohorts D GEO and other cohorts with high and those with low expression levels of CD47. The remainder (the second and third picture on the left) of the graph illustrates the prognosis for the two different sets of CTL expressions with CD47-high group and CD47-low group in above cohorts. Only cancers with statistically significant differences between the cohorts are presented. Significance representation: ns, p ≥ 0.05; *, p < 0.05; **, p < 0.01; ***, p < 0.001
Furthermore, it was observed that the Cytotoxic CD8 + T cell Top group had a poorer prognosis in CD47-high group than the CD47-low group (Fig. 4b). Especially in these cohorts, high Cytotoxic CD8 + T cell infiltration did not suggest a better prognosis. In the same, this phenomenon was also shown in GSE13507@PRECOG Bladder, GSE10886@PRECOG Breast, Roepman Lung Cancer @PRECOG cohorts, GSE17536 Colorectal OS, E-MTAB-3267-Kidney, GSE31684-Bladder, OV GSE31245@PRECOG, GSE49997 OV, METABRIC BreastLumA, Prostate GSE16560@PRECOG, Gide2019-PD1 + CTLA4 Melanomas (Fig. 4c, Supplemental Fig. 3c). The same results happened in KIRC, SARC, LIHC in TCGA database (Fig. 4d). It is well known that T cell dysfunction can negatively impact the prognosis even in the presence of cytotoxic CD8 + T cell, while T cell rejection might negatively impact the prognosis because of the absence of cytotoxic CD8 + T cell infiltration. Consequently, we strongly suggest that CD47 might impair CD8 + T cell function and so negatively impact tumor patients' prognosis.
3.5 CD47 differential genes enrichment in CD8 + Tex pathway.We categorized the TCGA cohort data into high-expression group and low-expression group, and performed pathway enrichment analysis for both groups of differently expressed genes (p < 0.05). We found that some of the same pathways are present in cancers(Fig. 5a), which includes PID CD8 TCR Downstream Pathway in BLCA, BRCA, ESAD, ESCA, GBM, KIRP, LIHC, LUSC, OV, PRAD, SKCM, STAD, UCS, UVM; PID CD8 TCR Pathway in BLCA, BRCA, ESCA, GBM, LIHC, LUSC, OV, PRAD, SKCM, STAD, TGCT, UCS, UVM; WP T cell Antigen Receptor TCR Signal Pathway in BLCA, BRCA, ESCA, GBM, KIRP, LIHC, LUSC, OV, PRAD, SKCM, STAD, TGCT, UCS, UVM; BIOCARTA CTLA4 Pathway and WP Cancer Immunotherapy By PD1 Blockade in BLCA, BRCA, ESCA, LIHC, LUSC, OV, PRAD, SKCM, STAD, TGCT, UCS, UVM. Furthermore, CD8 + Tcell exhaustion correlated pathways comprise IL2, IL10, IL12, IL17, INF-gamma, T cell, TCR, and JAK-STAT.
Fig. 5
CD47 Differential Genes Enriched in CD8 + Tex Pathway. (A) GSEA enrichment analysis results based on CD47 differentially expressed genes in Pan-cancer. (B) The mountain map showcased the path enrichment outcomes, encompassing PID CD8 TCR Downstream Pathway, PID CD8 TCR Pathway, WP Tcell Receptor Signal Pathway, BIOCARTA CTLA4 Pathway, and WP Cancer Immunotherapy by PD1 Blockade, along with the gene regulatory network for the PID CD8 TCR Downstream Pathway. (D) The PPI network demonstrated the correlation between the CD47 protein and the central protein of PID CD8 TCR Downstream Pathway. The representation of significance is as follows: ns, p ≥ 0.05; *, p < 0.05; **, p < 0.01; ***, p < 0.001
Furthermore, mountain maps presented a visualization of the above first 5 pathways enrichment results (Fig. 5b), in BRCA, ESCA, LUSC, OV, and SKCM to further demonstrate the distribution of corresponding numbers of differential genes enriched. The figure illustrates that NES (normalized enrichment score) exhibited positivity, with the majority of the differential genes exhibiting enrichment in the high-expression group. We explore further the gene regulatory network of PID CD8 TCR Downstream Pathway (Fig. 5c, Supplemental Fig. 4a), we discovered that TNFRSF9 and CD8A were expressed at a high level in above all cancers. Taking into account the regulatory networks deduced from the enriched outcomes, we can direct our attention towards a regulatory pathway extending from TNFRSF9 to IL2RA/B/G, via CD8A. Subsequently, we employ PPI(Fig. 5d) to determine the association between the CD47 protein and the proteins linked to the core-enriched molecules. The findings indicated a direct interaction between CD47 protein and CD8A, TNFRSF9, IFNG, B2M, and GZMB. In light of our observations, we deduced that the activation of the CD47 within the signaling pathway could potentially exert a crucial influence on the regulation of CD8 + T cell functionality—a phenomenon that may potentially collaborate with TNFRSF9.
3.6 CD47 expression is related to the CD8 + Tex in pan-cancer.We delved deeper into the connection between CD47 and the exhaustion of T-cells. The co-expression heat map showed a relationship between CD47 expression in pan-cancer and T-cell exhausted genes. [45] CD274, IDO1, CTLA4, ICOS, TIGIT, IL10, TNFRSF9, HAVCR2 exhibited significant co -expression with CD47 in BLCA, BRCA, CESC, COAD, READ, CRC, ESCA, ESCC, GBM, HNSC, LUSC, OSCC, OV, SKCM, STAD, TGCT, THCA, UCS; NFKB1, GRB2, NFATC3, YY1, NFATC2IP, PRDM1, and FOXO1 in other cancers. Additionally, it was demonstrated that TNFRSF9 ranked among the top three genes in the tumors listed below: BRCA, COAD, ESCA, ESAD, ESCC, GBM, LUSC, OV, and DLBC(r > 0.5 but not the top); whereas CD274 held the top three positions in BLCA, BRCA, CESC, COAD, READ, CRC, LAML, LGG, LUAD, OSCC, PCPG, PRAD, READ, SARC, SKCM, STAD, THCA, UCS (Supplemental Table 1). (Fig. 6a, b, Supplemental 4c).
Fig. 6
CD47 expression is related to the CD8 + Tex in many cancer types. A, B Co-expression heat map shows the relationship between the expression of CD47 in pan-cancer and the exhausted genes of T cells, especially TNFRSF9, CD274, IDO1, and ICOS. C The bar chart displayed a wide range of CD47 expression in CD8 + Tex and CD8 + T cell from a single-cell database in a pan-cancerous environment. (D) The histogram illustrates the manifestation of CD47 and TNFRSF on CD8 + Tex.Significance representation: ns, p ≥ 0.05; *, p < 0.05; **, p < 0.01; ***, p < 0.001
After that, we used the single-cell analysis to evaluate the expression of CD47 in CD8 + Tex and CD8 + T cells from the TISCH database and used the embedded bar chart to show the Data distribution. We found CD47 mainly expressed on CD8 + Tex(> 50%) in AML, BRCA, CHOL, CLL, CRC, ESCA, Glioma, HNSC, KICH, LIHC, MCC, MM, NHL, NSCLC, OS, OV, PRAD, SCC, SCLC, SKCM, THCA, UVM (Fig. 6c). And we further detect the expression of TNFRSF9 and CD47. It was observed that both of them exhibited expression on CD8 + Tex in BRCA, BCC, CHOL, CLL, CRC, Glioma, KIRC, LIHC, MCC, NHL, NSCLC, PAAD, SKCM, UCEC, and UVM (Fig. 6d). The findings indicate that the association of CD47 and TNFRSF9 with CD8 + Tex in pan-cancer suggests their involvement in the dysregulation of CD8 + Tex in this type of cancer.
留言 (0)