
記住我
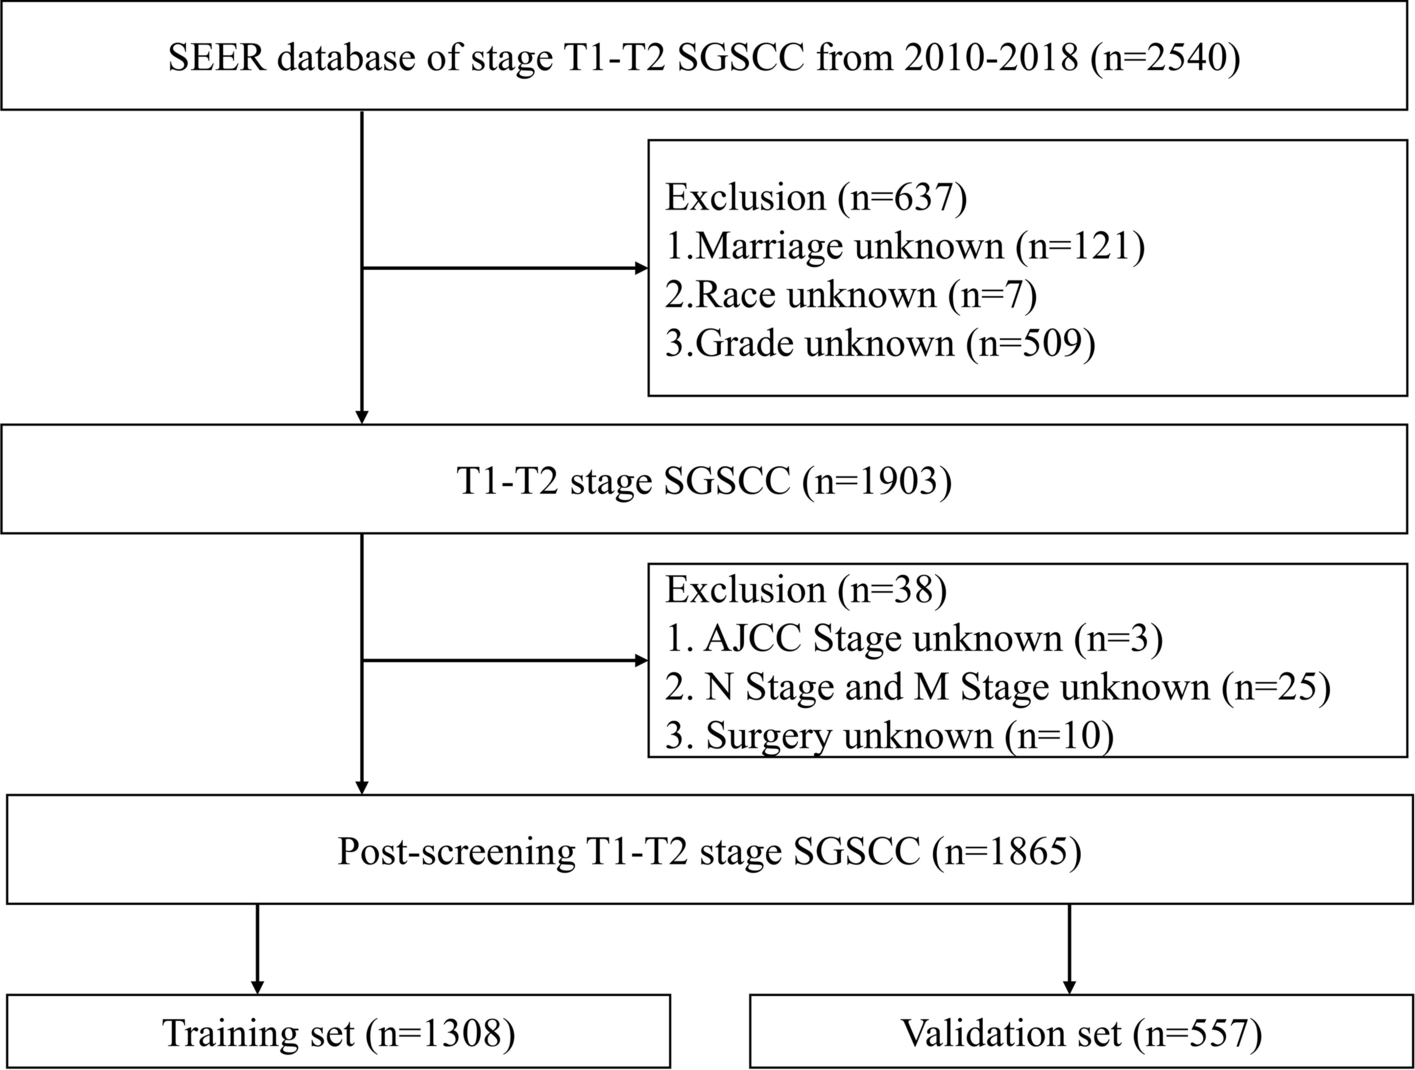
Patients (n = 1865) were chosen from the SEER database based on inclusion and exclusion criteria. The “caret” R software package was used to randomly assign the patients into two clusters. The first cluster consisted of a training set (n = 1308, 70.13%). The second cluster was a validation set 1 (n = 557, 29.87%). To further confirm the results, we selected patients who met the inclusion criteria from the available data at the First Affiliated Hospital of Xinjiang Medical University (validation set 2, n = 109). Tables 1 and 2 provide details on the general characteristics and the characteristics of the three patient categories, respectively.
Table 1 Demographic, clinical characteristics of patients with stage T1–T2 SGSCC in the training and validation set 1 in SEERTable 2 Demographic and clinical characteristics of patients with T1–T2 stage SGSCC in validation set 2 from the data of the First Affiliated Hospital of Xinjiang Medical UniversityFrom the SEER database, 1865 patients were included in the analysis. Of these patients, 1111 (59.6%) were below the age of 65, while 754 (40.4%) were 65 years and older. The study sample comprised 1865 patients, with 1217 (65.3%) men and 648 (34.7%) women. Regarding marital status, 841 were married (45.1%), while 1024 were unmarried (54.9%). The study population included 1865 patients, with 1541 (82.6%) identifying as white, 267 (14.3%) as black and 57 (3.1%) belonging to other racial groups. According to tumor grade classification, 161 cases (8.6%) were grade I, 1118 cases (59.9%) were grade II, 576 cases (30.9%) were grade III, and 10 cases (0.5%) were grade IV. In terms of summary stage, 804 cases (43.1%) were confined to a specific area, 883 cases (47.3%) were regional, and 178 cases (9.5%) were distant. Regarding the AJCC stage, 392 cases (21.0%) were stage I, 559 cases (30.0%) were stage II, 286 cases (15.3%) were stage III, and 628 cases (33.7%) were stage IV. In terms of N stages, 964 cases (51.7%) were N0, 302 cases (16.2%) were N1, 550 cases (29.5%) were N2, and 49 cases (2.6%) were N3. Regarding M stages, 1784 cases (95.7%) were M0, and 81 cases (4.3%) were M1. A total of 1441 patients did not undergo surgery (77.3%), 186 patients received local intervention (10.0%), 148 patients underwent partial laryngectomy (7.9%), 69 patients underwent total laryngectomy (3.7%), and 21 patients underwent other surgical methods (1.1%). In total, 1512 patients underwent radiotherapy treatment (81.1%), while 353 patients did not receive radiotherapy (18.9%). Additionally, 928 patients were treated with chemotherapy (49.8%), while 937 were not (50.2%).
In the cohort of patients collected from the First Affiliated Hospital of Xinjiang Medical University, the majority (n = 62, 56.9%) were under 65 years old, while 47 patients (43.1%) were over 65 years old. The sample size consisted of 109 patients, with a predominance of men at 101 patients (92.7%) and a minority of women at 8 patients (7.3%). Furthermore, all 1009 patients in the entire sample were found to be married. According to tumor grade, grade I comprised the largest portion of patients at 68.8% (n = 75), followed by grade II at 22.0% (n = 24), and then grade III at 9.17% (n = 10). The study did not find any instances of grade IV. Regarding the AJCC stage, stage I comprised 27.5% (n = 30) of cases, stage II comprised 46.8% (n = 51) of cases, stage III comprised 11.9% (n = 13) of cases, and stage IV comprised 13.8% (n = 15) of cases. In terms of different stages, N0 had the highest percentage at 74.3% (n = 81), while N1 and N2 accounted for 12.8% each, with 14 cases for each stage. No instances of N3 were detected. M0 was the most common in terms of M stages, accounting for 97.2% of the sample with 106 patients. On the other hand, M1 constituted a negligible fraction, making up only 2.8% of the total instances. The sample consisted of 109 patients, 24 of whom had not undergone surgery, making up 22.0% of the population. There were 19 patients who underwent local interventions, accounting for 17.4% of the total. The majority of patients (55.1%) underwent partial laryngectomy (n = 60), while a lower proportion underwent partial laryngectomy. Only 5.5% required a total laryngectomy (n = 6). No other procedures were used in the cohort. Out of the total number of patients, 71 received radiotherapy, constituting 65.1% of the patients. On the other hand, 38 patients did not receive radiotherapy, accounting for 34.9% of the population. Chemotherapy was offered to 26 patients, representing 23.9% of the patients. The remaining 83 patients (74.1%) did not receive chemotherapy.
To ensure the stability of the experimental data, the Chi-square test was used to analyze the basic data characteristics of the validation sets and training set. The above variables were found to be independent and have no relationship with each other, as shown in Tables 1 and 2.
3.2 Univariate analysisUnivariate Cox regression analysis was utilized to identify the general variables of patients in the training set, separating them into OS group and CSS group. The aim was to identify prognostic factors affecting patients with T1–T2 SGSCC.
In the OS group several factors were significantly associated with T1–T2 SGSCC prognosis, including age (age ≥ 65), sex (female), marital status (unmarried), AJCC stage III and IV, grade IV, and other variables such as AJCC stage III combined with grade IV, T1, M1, N1, N2, N3, radiotherapy, partial laryngectomy, and distal and regional summary stages (P < 0.05). However, variables such as AJCC stage II, chemotherapy, grade II, race, local intervention, other types of laryngectomy, and total laryngectomy did not have an impact on patient outcomes (P > 0.05) (Table 3).
Table 3 Univariate analysis of the OS and CSS groups in the training setThe primary factors for predicting the CSS group were sex, age, and marital status. Other factors considered included tumor grade (AJCC stage II–IV) and tumor stage (II–IV), M1 stage, N1–N3 stage, distal and regional summary stages, as well as chemotherapy, radiotherapy, and partial laryngectomy. These variables showed a statistically significant correlation with CSS (P < 0.05). Race, local intervention, other types of laryngectomy, and total laryngectomy had no effect on patient outcomes (P > 0.05) (Table 3).
3.3 Prognostic survival analysis3.3.1 Survival analysis of prognostic factors in the OS groupThe survival curve (KM curve) of patients in the OS group was drawn using R Studio and the KM method. The results are shown in Fig. 3. The results indicated that age, sex, marital status, summary stage, tumor stage, tumor grade, N stage, M stage, radiotherapy, and different surgical methods were significant factors (P < 0.05).
Fig. 3
KM curve analyses for patients in the OS group, examining the influence of various factors on prognosis: A age (P < 0.001). B Sex (P = 0.034). C Marital status (P < 0.001). D Summary stage (P < 0.001). E Tumor stage (P < 0.001). F Grade (P < 0.001). G N stage (P < 0.001). H M stage (P < 0.001). I Radiotherapy (P < 0.001). J Chemotherapy prescriptions (P = 0.55). K Surgical procedures (P < 0.001)
3.3.2 Survival analysis of prognostic factors in patients with CSSThis research evaluated the significance of different factors in the CSS group with respect to the survival times of patients. The KM technique was used to generate and display the KM curves of patients from the validation set 1 (Fig. 4).
Fig. 4
KM curve analyses for patients in the CSS group, examining the influence of various factors on prognosis: A age (P < 0.001). B Sex (P = 0.02). C Marital status (P = 0.001). D Summary stage (P < 0.001). E Tumor stage (P < 0.001). F Grade (P = 0.00016). G N stage (P < 0.001). H M stage (P < 0.001). I Radiotherapy (P = 0.0034). J Chemotherapy (P = 0.019). K Surgical techniques (P < 0.001)
3.3.3 Survival analysis of prognostic factors of patients in validation set 2 from the First Affiliated Hospital of Xinjiang Medical UniversityThe same procedure was used to evaluate the significance of each factor in validation set 2 in terms of patients' survival time. The KM method was employed to generate and extend the KM curve for the patients in the validation set 2 (Fig. 5).
Fig. 5
KM curve analyses for patients in validation set 2, examining the influence of various factors on prognosis: A age (P < 0.001). B Sex (P = 0.097). C M stage (P = 0.83). D Radiotherapy (P = 0.064). E Surgical procedures (P = 0.0043)
3.4 Multivariate analysisMultivariate Cox regression analysis was performed to validate the results. In the OS group, the study found that age (age ≥ 65), sex, marital status (unmarried), M1 stage, radiotherapy, local intervention, partial laryngectomy, and total laryngectomy were significant prognostic factors (P < 0.05). These factors could be used as independent prognostic risk factors for T1–T2 supraglottic squamous cell carcinoma (Table 4 and Fig. 6).
Table 4 Multivariate analysis of the OS and CSS groups in the training setFig. 6
Multivariate Cox regression forest plot for the OS group
In the CSS group, age (age ≥ 65), sex (female), marital status (unmarried), AJCC stage (stage II–IV), grade III, M1, chemotherapy, radiotherapy, and partial laryngectomy were considered independent predictors (Table 4 and Fig. 7). Multivariate Cox regression analysis can improve the stability of the predictive model.
Fig. 7
Multivariate Cox regression forest plot for the CSS group
3.5 Prognostic model for predictionA multivariate Cox prognostic model was developed by selecting reliable variables and then analyzed to determine its efficacy as a diagnostic tool in predicting the prognosis of patients using an ROC curve. As shown in Fig. 8, the 1-, 3-, and 5-year AUC values in the training set’s OS group were 0.738, 0.702, and 0.695, respectively. In the training set’s CSS group, 1-, 3-, and 5-year AUC values were 0.774, 0.747, and 0.754, respectively. The AUC values for the three time points in the OS group of the validation set 1 were 0.789, 0.674, and 0.677, respectively, while those of the CSS group were 0.802, 0.706, and 0.711, respectively. Finally, the AUC values for 1, 3, and 5 years in validation set 2 were 0.797, 0.669, and 0.68, respectively. These results indicate that the prediction model has high accuracy in predicting the outcome of patients with T1–T2 SGSCC.
Fig. 8
Analysis of patient survival using the multivariate Cox proportional hazards model. The AUC values for the OS and CSS groups at various time points were analyzed utilizing both the training and validation sets and validation set 2. A At 1, 3, and 5 years, the OS group in the training set had remarkable AUC values of 0.738, 0.702, and 0.695, respectively. B At 1, 3, and 5 years, the AUC values in the CSS group were 0.774, 0.747, and 0.754, respectively. C The validation set 1 analysis revealed significantly enhanced performance in the OS group, with remarkable AUC values of 0.789, 0.6743, and 0.66. D At 1, 3, and 5 years, the AUC values in the CSS group were 0.802, 0.706, and 0.711, respectively. E Validation set 2 further demonstrated the model’s extraordinary accuracy, with AUC values at 1, 3, and 5 years of 0.797, 0.669, and 0.66, indicating outstanding performance
3.6 Preparation of the model for predicting nomograms: External and internal validation3.6.1 Analysis of the nomogram and drawing of the calibration curve in the OS groupNomogram analysis was used to assign scores to various risk factors, including surgical procedure, age, sex, marital status, stage, and radiation, to provide a more visual representation of the results of this multivariate analysis. The sum of the factor scores was used to determine the total score of the 1-, 3-, and 5-year survival rates for each patient following function transformations, as depicted in Fig. 9A. The C-index scores derived from both external and internal validation for the OS group were obtained from the training set. The internal validation produced an index score of 0.683 (95% CI 0.671–0.695), while the external validation produced an index score of 0.686 (95% CI 0.668–0.705). The calibration curve, shown in Fig. 9B, C, and the DCA curve, depicted in Fig. 9D, E, both exhibit the highest degree of concordance across the validation and training sets. These results demonstrate the model's capacity to accurately predict future events.
Fig. 9
Nomogram plot, calibration curve, and DCA curve of the OS group. A Based on the cumulative scores of numerous prognostic risk factors, the 1-year (1Y), 3-year (3Y), and 5-year (5Y) OS rates were determined for patients in both the training and validation sets who belonged to the OS group. B, C The predictive accuracy of the prognostic model applied to the OS group was evaluated for 1-, 3-, and 5-year OS using calibration curve analysis on the training and validation sets of patients. D, E DCA curves were plotted for patients in the training and validation sets who belonged to the OS group
3.6.2 Nomogram and calibration curve analysis: CSS groupNomogram analysis was utilized to enhance the clarity of the results obtained from the multivariate analysis. The evaluation considered various risk factors such as surgical method, age, marital status, sex, AJCC grade, degree of chemotherapy treatment, radiation level, and M stage. Each factor was assigned a score, and the survival rates of patients who underwent functional transformation over a period of 3 and 5 years were represented by combining and calculating these scores. Figure 10A displays the outcomes.
Fig. 10
Nomogram plot, calibration curve, and DCA curves for the CSS group. A Nomogram analysis was performed to assess the 1-year (1Y), 3-year (3Y), and 5-year (5Y) OS rates among patients belonging to the CSS group in both the training and validation sets, taking into account the cumulative scores of each prognostic risk factor. B, C In order to evaluate the predictive accuracy of the prognostic model for the 1-year (1Y), 3-year (3Y), and 5-year (5Y) survival rates, calibration curve analysis was performed on the training and validation sets of CSS patients. D, E DCA curves were plotted for patients in the training and validation sets who belonged to the CSS group
For internal validation in the CSS group, the C-index was found to be 0.723 (95% CI 0.709–0.737). External validation with the validation set 1 resulted in a C-index of 0.711 (95% CI 0.689–0.734). Additionally, the calibration curve, represented in Fig. 10B, C, and the DCA curve, illustrated in Fig. 10D, E, both demonstrated an excellent fit in both the validation and training sets. These results suggest that the model has reliable predictive capability.
3.6.3 Analysis of the nomogram and drawing of the calibration curve for validation set 2 from the First Affiliated Hospital of Xinjiang Medical UniversityNomogram analysis was used to assign scores to various risk factors, including surgery method, sex, radiation, and M stage. This was done to enhance the visual presentation of the multivariate analysis results. The total score of the variables was determined and correlated with the 1, 3 and 5-year survival rates for each patient, as shown in Fig. 11A. The calibration and DCA plots of validation set 2 (Fig. 11B, C) showed a good fit to the model, indicating a strong ability to predict the performance of our model.
Fig. 11
Nomogram plot, calibration curve, and DCA curve for validation set 2. A To evaluate the 1-year (1Y), 3-year (3Y), and 5-year (5Y) survival rates among patients in validation set 2, nomogram analysis was performed, taking into account the cumulative scores of each prognostic risk factor. B Calibration curve analysis was performed on validation set 2 to assess the predictive accuracy of the prognostic model for the 1-year (1Y), 3-year (3Y), and 5-year (5Y) survival rates. C DCA curves were generated for patients in validation set 2
留言 (0)