2.1 Cell culture and materials
The SKOV3 (human EOC) cells and MDA-MB-231 (human breast cancer) cells were procured from Procell Life Science & Technology Co., Ltd. (Wuhan, China). The IOSE-80 (normal human ovarian surface epithelial) cells and ID8 (murine EOC) cells were obtained from iCell Bioscience Inc. (Shanghai, China). All cells utilized in this study underwent periodic Mycoplasma testing, and their passage number was maintained below 20. Cultivation of MDA-MB-231, IOSE-80, SKOV3, and ID8 cells was performed in Dulbecco’s modified Eagle medium (DMEM; Gibco, USA) supplemented with 10% fetal bovine serum (FBS) (Gibco, USA). All cells were cultured at 37 °C with 5% CO2. A selective PHGDH inhibitor (CBR-5884, Cat. No. HY-100012) and carboplatin (CBP, Cat. No. HY-17393) were procured from MedChemExpress (Shanghai, China). Minimum Essential Medium (MEM) (Gibco, USA) was employed to determine serine concentration.
2.2 Transcriptome sequencing and bioinformatics analysis
Total RNA was extracted from dimethyl sulfoxide—(DMSO; control) and CBR-5884 (50 μM)—treated SKOV3 cells, and RNA extraction was carried performed using TriZol reagent (TaKaRa, Japan). Annoroad (Beijing, China) conducted RNA sequencing. Three biological replicates were used for each group. Gene set enrichment analysis (GSEA) [24] was performed for enrichment analysis, with statistical significance defined as P values of < 0.05 and false discovery rate < 0.25. PHGDH mRNA expression data of patients with OC identified from The Cancer Genome Atlas database were obtained from UCSC Xena [25], while data from GSE14407 were acquired using the NCBI tool GEO2R (https://www.ncbi.nlm.nih.gov/geo/geo2r/). Kaplan–Meier Plotter provided the overall survival analysis of PHGDH in GSE26193 for patients with OC [26].
2.3 Serine concentration detection
Briefly, SKOV3 and ID8 cells were seeded into 6-well plates at a density of 5 × 10⁵ cells per well in serum-free MEM and allowed to adhere overnight. The next day, cells were treated with either DMSO control or CBR-5884 (30 μM and 50 μM). After 24 h of treatment, cells were collected, and the cellular serine levels were quantified using a DL-serine assay kit (Cat. No. ab241027; Abcam, MA, USA) following the manufacturer’s instructions.
2.4 Cell viability and 50% inhibiting concentration (IC50)
In each well of a 96-well plate, 4 × 10³ SKOV3, ID8, and MDA-MB-231 cells were seeded using 100 µL of DMEM supplemented with 10% FBS and allowed to adhere overnight. Subsequently, cells were exposed to test compounds for the specified duration, and cell viability was assessed using the Cell Counting Kit-8 (CCK-8) kit (Selleck Chemicals, USA). After 2-h incubation at 37 °C, absorbance was measured at 450 nm using a microplate reader (iMark™; Bio-Rad Laboratories, Inc.). The results were presented as background-subtracted relative light units normalized to a DMSO-treated control. IC50 curves for CBR-5884 were determined by analyzing the cell viability results normalized against untreated controls, and the IC50 values was analyzed using GraphPad PRISM 6.0 software. All experiments were conducted in triplicate.
2.5 Colony formation assay
For the assessment of the CBR-5884 effect on SKOV3 and ID8 cells, 5000 cells per well were cultured in a 6-well plate with varying concentrations of CBR-5884 (0, 30, and 60 μM) for 7 days. Following this, the cells were fixed in 4% paraformaldehyde for 10 min and stained with 1% Giemsa for 10 min. Subsequent counting of cell colonies was performed using ImageJ software. This experiment was repeated independently three times.
2.6 Flow cytometry
Flow cytometry experiments were employed to evaluate cell cycle arrest and apoptosis induced by CBR-5884. SKOV3 and ID8 cells were treated with either DMSO or CBR-5884 (50 μM) for 24 or 48 h. For cell cycle analysis, the collected cells were washed twice with phosphate-buffered saline (PBS) subsequently processed using the Cell Cycle Staining Kit (Multi Science, China) according to the manufacturer’s protocol. For apoptosis analysis, cells were washed twice with PBS subsequently stained using the Annexin V-FITC Apoptosis Detection Kit and the Annexin V-APC Apoptosis Detection Kit (MultiScience, China) according to the manufacturer’s instructions. Cells were sorted using a fluorescence-activated cell sorter (Guava easyCyte 8, USA). Cell cycle distributions (S, G1, and G2/M phases) were determined using ModFit LT 3.1 software (Verity Software House, USA), while FlowJo vX 0.7 software (Tree Star Inc., USA) was used to assess apoptosis ratios. To detect CD44-positive cells, a FITC anti-mouse CD44 (IM7; 1:200 dilution, Cat. No. FITC-65117; Proteintech, USA) antibody was used. In brief, SKOV3 and ID8 cells were inoculated in a 6-well plate (2 × 10⁴ cells per well) with or without CBR-5884 (30 μM) for 48 h. Then the collected cells were washed with PBS and were subsequently stained with FITC antimouse CD44 for 5 min. CD44-positive cells were analyzed using FlowJo vX 0.7 software. Each flow cytometry experiment was performed in at least three replicates.
2.7 Wound healing assay
In 6-well plates, SKOV3 and ID8 cells were seeded at confluent densities and incubated in a serum-free medium for 24 h. Using a 10-μL pipette, scratched wounds were created, and cells were washed by PBS and incubated in fresh serum-free medium with DMSO control or CBR-5884 (30 μM) for 48 h. Wound closure was observed at 0 and 48 h, and images were captured to evaluate cell migration rates. The wound-healing rate was quantified by calculating the proportion of the blank region between wound edges at 0 and 48 h. The wound-healing rate represented the proportion of the lost wound area within 48 h relative to the initial area at 0 h.
2.8 Transwell assay
For the Transwell assay, each insert (8 μm pore size, Falcon) was initially pre-coated with Matrigel (Cat. No. CB-40230; Corning, USA) overnight. The upper insert contained 2 × 10⁴ cells, pre-treated with either DMSO control or 50 μM CBR-5884 for 24 h in 100 μL of serum-free medium. The lower chamber was filled with 200 μL of complete medium as the chemoattractant. Cells were allowed to migrate for 48 h, followed by fixation with a 4% formaldehyde solution and staining with hematoxylin. Unmigrated cells on the apical side of the membrane were removed using wet cotton swabs. Subsequently, the migrated cells were captured and counted under a microscope. For each Transwell insert, we counted the total number of invasive cells in 5 random fields under a 100× microscope. The ratios of invasive cells in CBR-5884 treatment group to those cells in the control group were calculated.
2.9 Tumorsphere assay
Briefly, 5 × 10³ SKOV3 and ID8 cells were plated as a single-cell suspension on the 6-well ultra-low attachment plates (Corning, USA) in DMEM/F-12 medium supplemented with 20 ng/mL EGF, 10 μg/mL insulin, 0.5 μg/mL hydrocortisone, and B27 (1:50 dilution, Cat. No. 17504044; Gibco, USA). After 24 h, DMSO control or CBR-5884 (50 μM) was added to the plates. Tumorspheres with a diameter > 100 μm were counted, and images were captured after 5 days of treatment. These experiments were conducted three times.
2.10 Quantitative real-time polymerase chain reaction
RNA was isolated from cells using Trizol reagent (TaKaRa, Japan), and cDNA was generated by reverse transcription using a Takara PrimeScript RT Reagent Kit (TaKaRa, Japan), following the manufacturer’s protocol. The resulting cDNA was then amplified using the SYBR Premix Ex-Taq II Kit (TaKaRa, Japan) using a Biosystems 7500 quantitative real-time polymerase chain reaction (PCR) system. All expression data were normalized to GAPDH-encoding transcript levels. Quantitative real-time PCR assay was performed with specific gene primers. Real-time PCR was performed with the following primers: ALDHA1A-fw 5′-GCACGCCAGACTTACCTGTC-3′, ALDH1A1-rev 5′-CCTCCTCAGTTGCAGGATTAAAG-3′; NANOG-fw 5′-CAATGGTGTGACGCAGAAGG-3′, NANOG-rev 5′-GAAGGTTCCCAGTCGGGTTC-3′; GAPDH-fw 5′-TCTGACTTCAACAGCGACAC-3′, GAPDH-rev 5′-CGTTGTCATACCAGGAAATGAG-3′; SOX2-fw 5′-ATGGGTTCGGTGGTCAAGT-3′, SOX2-rev 5′-ATGTGTGAGAGGGGCAG-3′; EPCAM-fw 5′-CTGGCCGTAAACTGCTTTGT-3′, EPCAM-rev 5′-AGCCCATCATTGTTCTGGAG-3′; POU5F1-fw 5′-TCAGCCAAACGACCATCTGC-3′, POU5F1-rev 5′-GGTTTCTGCTTTGCATATCTCCT-3′.
2.11 Western blotting
The cell lysates were extracted using radioimmunoprecipitation assay lysis buffer (KeyGEN BioTECH, China) containing 1% 100 mM phenylmethanesulfonyl fluoride (KeyGEN BioTECH, China). Total protein was determined utilizing a BCA Protein Assay Kit (KeyGEN BioTECH, China). The isolated proteins from cell lysates were separated on 8–15% sodium dodecyl sulfate–polyacrylamide gel electrophoresis, depending on the specific experiment, and then transferred onto a polyvinylidene difluoride membrane (Millipore, USA) using an electro-transferred machine. Following this, the membranes were blocked with 5% skimmed milk for 1.5 h According to the molecular weight of the target protein, the membranes were cut into several strips at appropriate positions and incubated with primary antibodies against various targets: PHGDH (1:2000 dilution, Cat. No. 14719-1-AP; Proteintech, USA), GAPDH (1:2000 dilution, Cat. No. 5174; Cell Signaling Technology, USA), caspase-3 (1:1000 dilution, Cat. No. 9662; Cell Signaling Technology, USA), cleaved caspase-3 (1:1000 dilution, Cat. No. 9664; Cell Signaling Technology, USA), ITGB4 (1:1000 dilution, Cat. No. 14803; Cell Signaling Technology, USA), phospho-p44/42 MAPK (Erk1/2) (1:2000 dilution, Cat. No. 9102; Cell Signaling Technology, USA), total-p44/42 MAPK (Erk1/2) (1:1000 dilution, Cat. No. 4370; Cell Signaling Technology, USA), ZEB1 (1:1000 dilution, Cat. No. 3396; Cell Signaling Technology, USA), N-cadherin (1:1000 dilution, Cat. No. 13116; Cell Signaling Technology, USA), β-Catenin (1:1000 dilution, Cat. No. 8480; Cell Signaling Technology, USA), and Vimentin (1:1000 dilution, Cat. No. 5741; Cell Signaling Technology, USA). The membranes were incubated with these primary antibodies at 4 °C overnight. Subsequently, the membranes underwent incubation with horseradish peroxidase (HRP)—conjugated secondary antibodies for 1 h at room temperature (anti-rabbit IgG, 1:10,000 dilution, Cat. No. 7074; Cell Signaling Technology). Visualization of protein bands was achieved using chemiluminescence HRP substrate (Millipore, USA). Each western blot image is representative of three repeated results. The normalized densitometry data were determined using ImageJ software. The full scans of original blots were shown in the supplemental material.
2.12 Animal experiments
The study utilized 12 female BALB/c nude mice aged 4–6 weeks, procured from the Experimental Animal Center of Southern Medical University. These mice were housed in autoclaved, ventilated cages and provided with autoclaved water. All mice used were bred in the specific pathogen free laboratory. The mice received a subcutaneous injection of 1 × 10⁶ ID8 cells in the right armpit. When the tumors reached an average volume of 65 mm3, the mice were randomly divided into two groups using the random number method: (1) an experimental group, wherein the mice received intragastric administration of CBR-5884 (70 mg/kg, qd; n = 6); and (2) a control group, wherein the mice received intragastric administration of an equal volume of vehicle (corn oil) (n = 6). CBR-5884 treatment lasted for 12 consecutive days, with continuous drug administration. Tumors were resected when the average tumor volume in the control group reached 400 mm3. Tumor growth was tracked using caliper measurements, and tumor volume was calculated using the formula: length × width2/2. Subsequently, images of mice and tumors were captured, and tumors were weighed. Liver, spleen, kidney, and tumors were subjected to histological analysis after hematoxylin–eosin (H&E) staining. The maximal tumor size/burden permitted by our institutional review board is 10% of body weight and mean tumor diameter = or > 15 mm in adult mice (~ 25 g). The maximal tumor size/burden permitted by our institutional review board was not exceeded.
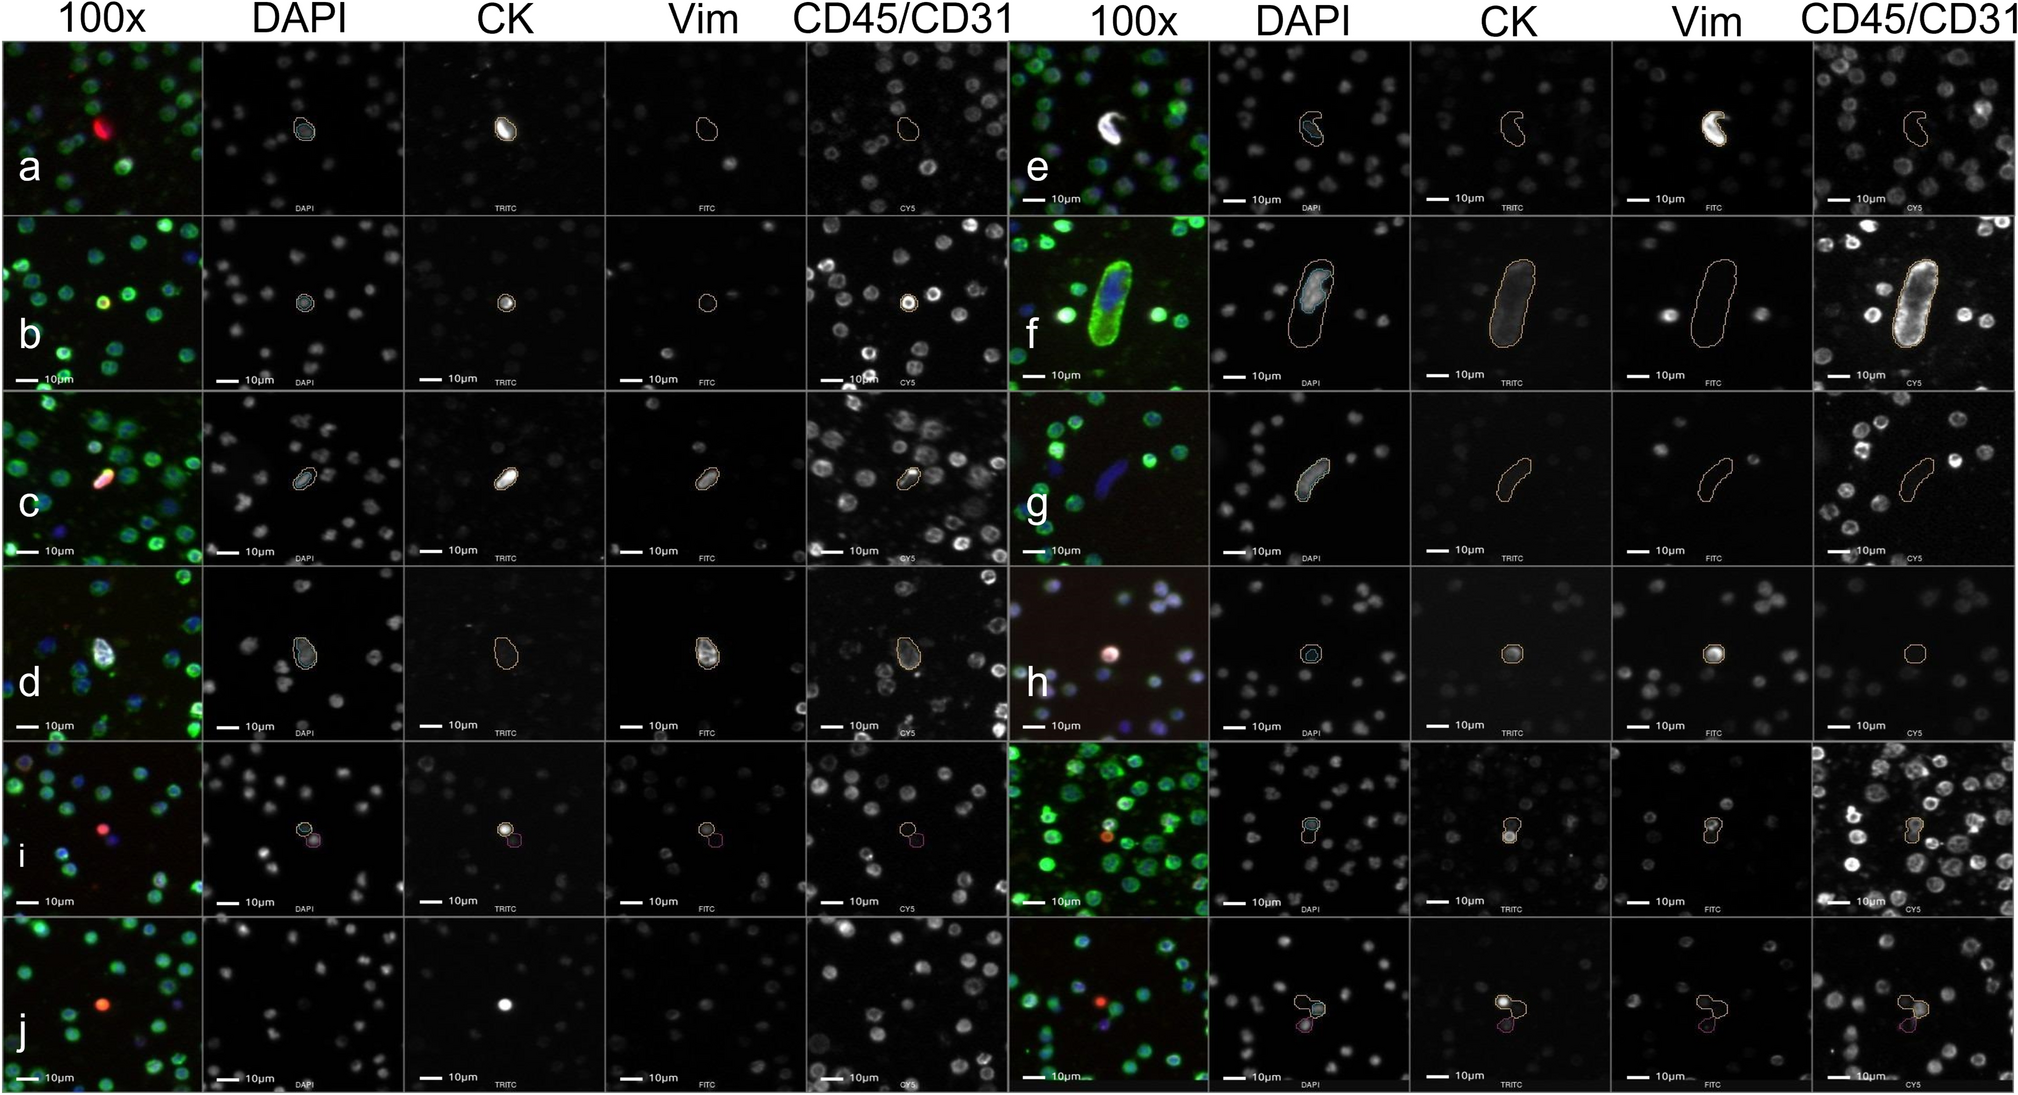
2.13 Immunohistochemistry, immunofluorescence analysis, and hematoxylin–eosin staining
For immunohistochemistry (IHC) analysis, an IHC kit (Cat. No. IHC001; Bioss, Beijing, China) was employed. Slices were subjected to heating, dewaxing, and rehydration and were then placed in sodium citrate buffer (pH buffer = 6.0) for antigen repair. To inhibit endogenous peroxidase activity, the slides were treated with 3% hydrogen peroxide and sealed with 10% normal sheep serum. After rinsing three times, the slices were incubated overnight with the primary antibody (rabbit anti-Ki-67, 1:500 dilution, Cat. No. 9027; Cell Signaling Technology, USA; rabbit anti-PHGDH, 1:500 dilution, Cat. No. 14719-1-AP; Proteintech, USA; rabbit anti-ITGB4, 1:300 dilution, Cat. No. 14803; Cell Signaling Technology, USA) at 4 °C. Following PBS washes, the slices were treated with a secondary antibody (anti-rabbit IgG 1:2000 dilution, Cat. No. 7074; Cell Signaling Technology, USA) for 30 min at 37 °C. Subsequently, staining with 3BI-3-diaminobenzidine (DAB) was performed, followed by hematoxylin staining, dehydration, sealing, and observation. Three independent pathologists evaluated Ki-67 scores based on the percentage of positive tumor cells. For immunofluorescence assay, the slices were blocked, followed by incubation with the primary antibody (rabbit anti-ITGB4, 1:200 dilution, Cat. No. 14803; Cell Signaling Technology, USA) overnight at 4 °C. Slices were then washed, incubated with secondary antibody (Cy3-conjugated anti-rabbit IgG 1:100 diluted, Cat. No. SA00009-2; ProteinTech, USA), and stained with DAPI (Cat. D-9106, Bioss). H&E staining involved staining sections in hematoxylin for 5 min and eosin for 5 min.
2.14 Patient-derived organoid model construction and culture
Fresh tumor tissues from patients with EOC were immersed in advanced DMEM/F12 (Cat. No. 12634028; Thermo Fisher Scientific) with 1% penicillin–streptomycin (PS). Necrotic tissues were removed, and the remaining tissue was cut into pieces of approximately 1–2 mm3 volume. After washing twice with PBS containing 1% PS, the tissue fragments were digested at 37 °C for 1 h using Advanced DMEM/F12 solution with type IV Collagenase (Cat. No. 17104019; Thermo Fisher Scientific). The resulting solution was filtered using a 100-μm filter (Cat. No. 352360; Corning, New York, USA). The fragments were then centrifuged at 300 × g for 5 min, erythrocytes lysed, and the precipitated cells resuspended in Advanced DMEM/F12 mixed with growth factor-reduced Matrigel (Cat. No. CB-40230; Corning, USA). The cell suspension was adjusted to a final concentration of 10,000–20,000 cells/50 μL. Patient-derived organoids (PDOs) were transferred to 24-well plates upon Matrigel solidification, and 500 μL of general culture medium was added. PDOs were cultured in a 37 °C cell incubator with 5% CO2, and the culture medium was refreshed every 2–3 days. Cell viability of PDOs was assessed using the Cell Counting-Lite 3D Luminescent Cell Viability Assay (Cat. No. DD1102-01; Vazyme, Nanjing, China).
2.15 Statistical analysis
Data were presented as mean ± standard deviation. Statistical analyses were conducted using GraphPad PRISM 6.0 software. Significant differences between two groups were determined using Student’s t-test (two-tailed). The two-way analysis of variance was performed to evaluate the therapeutic effect of CBR-5884 combined with CBP, and to assess differences in time curves and tumor volume growth curves. P values < 0.05 (*P < 0.05, **P < 0.01, ***P < 0.001) were considered significant; otherwise, they were deemed non-significant (ns).

留言 (0)