
記住我
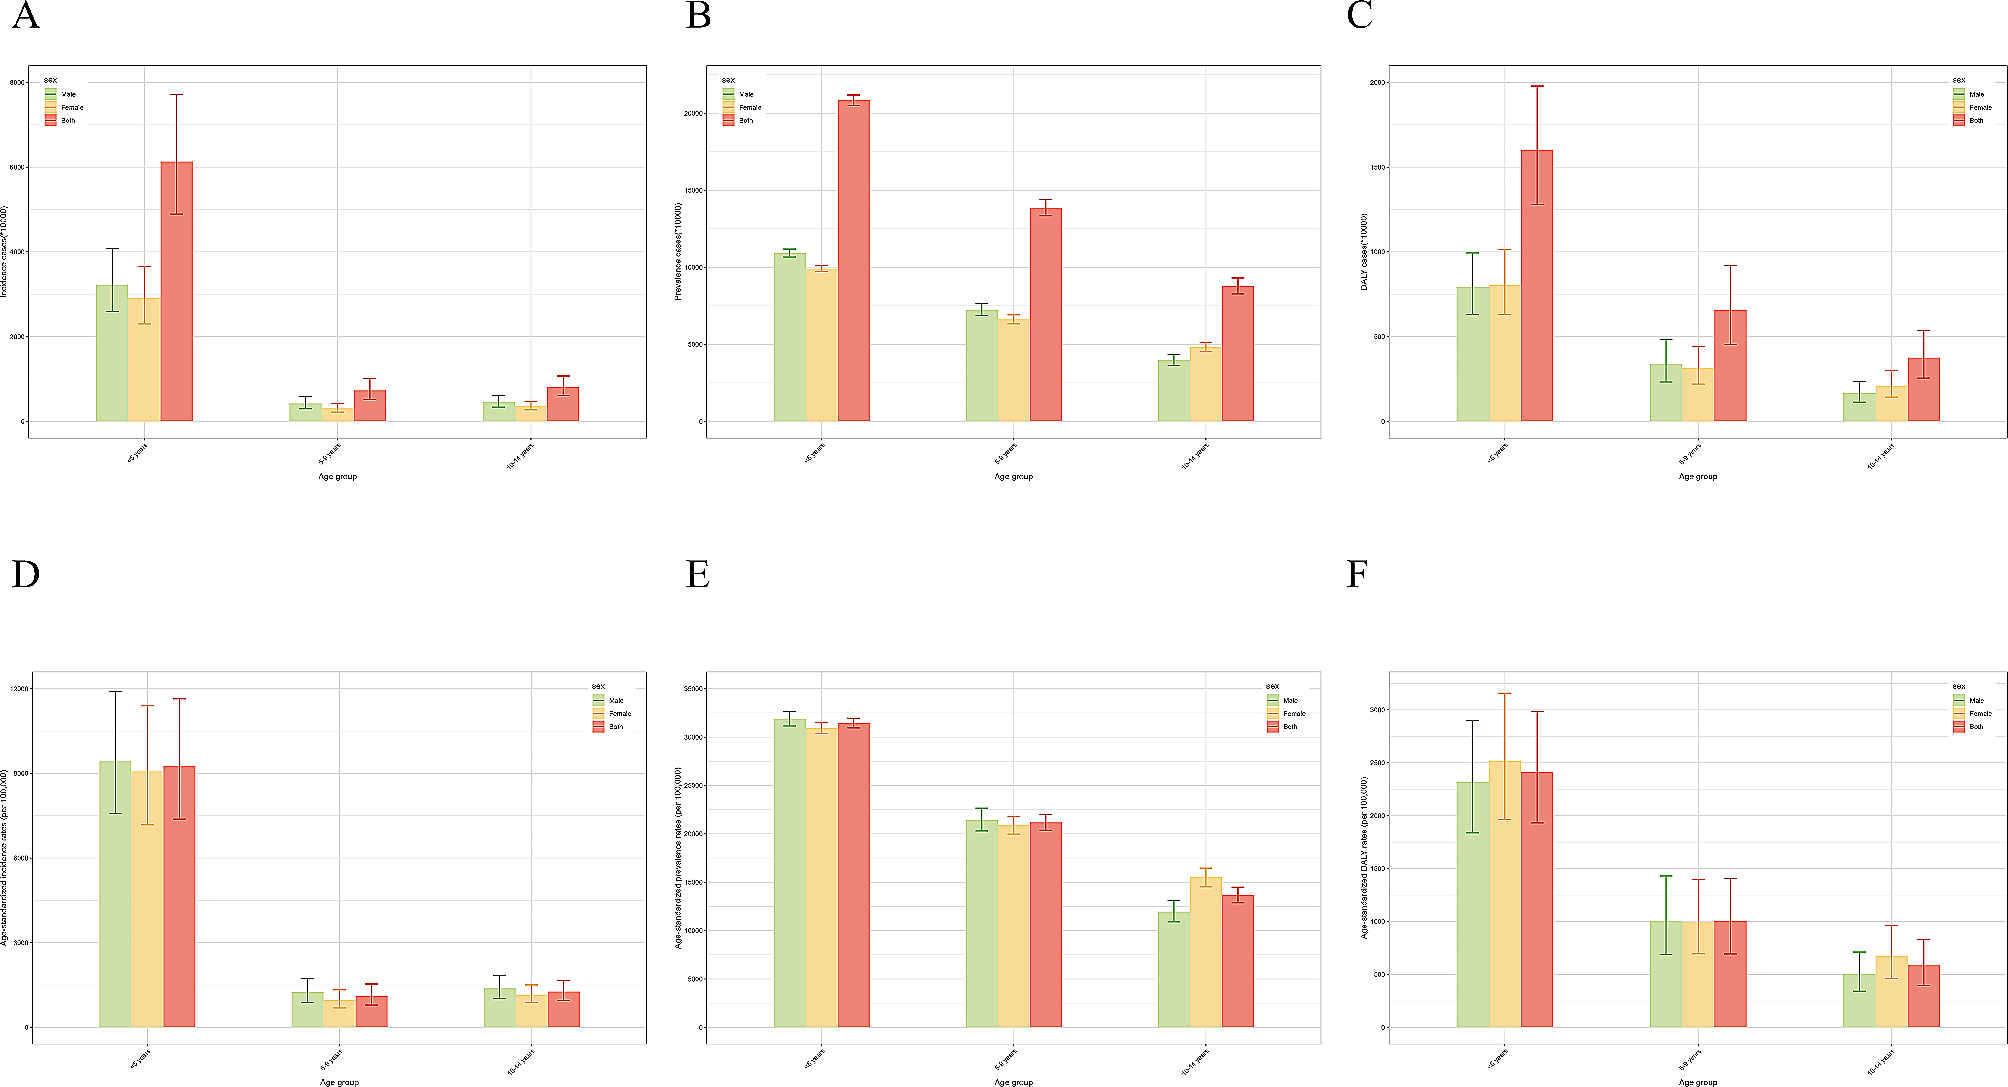


In 2019, 52,330,896 (95% UI: 48,025,169 to 57,716,774) new cases and 26,339,578 (20,235,568 to 33,595,123) DALYs of childhood malnutrition were reported, with 435,071,628 (425,910,405 to 444,749,386) prevalent cases (Tables 1, 2 and 3). In the context of gender, the prevalence and DALYs of childhood malnutrition were more considerable among girls than boys, while the opposite was true for incidence. Furthermore, among all age groups, children under 5 years had the highest cases and ASRs of incidence, prevalence, and DALYs (Fig. 1 and Supplementary Table 1). Over the past three decades, the global age-standardized incidence, prevalence, and DALY rates of childhood malnutrition have declined (Fig. 2 and Supplementary Table 2). More specifically, as shown in Fig. 2, the global age-standardized DALY rate has significantly decreased since 1990, and the most notable declines were observed between 1997 and 2005 (APC = -5.08% (95% CI: -5.37% to -4.78%), P < 0.05). However, ASIR declined most significantly between 2010 and 2017 (APC = -2.77% (95% CI: -2.93% to -2.62%), P < 0.05) and then has been consistently increasing in the past 2 years. Similarly, the ASPR of childhood malnutrition decreased consistently with different APCs, with the most significant decline occurring between 1990 and 1993 (APC = -0.48% (95% CI: -0.59% to -0.37%), P < 0.05).
Table 1 Incidence number and ASR of nutritional deficiencies among children in 1990 and 2019, and AAPC of ASR from 1990 to 2019Table 2 Prevalence number and ASR of nutritional deficiencies among children in 1990 and 2019, and AAPC of ASR from 1990 to 2019Table 3 DALY number and ASR of nutritional deficiencies among children in 1990 and 2019, and AAPC of ASR from 1990 to 2019Fig. 1
Incidence, prevalence and DALY of children with nutritional deficiency in different age groups in 2019. (A) incident cases; (B) prevalent cases; (C) DALYs; (D) incidence; (E) prevalence; (F) DALY rate
Fig. 2
Joinpoint regression analysis of ASRs for nutritional deficiency in children from 1990 to 2019. (A) incidence; (B) prevalence; (C) DALY rate
Regional and national burdenRegionally, in 2019, the highest ASIR was observed in South Asia (7861 (95% CI: 6123.81 to 10040.09) per 100,000 children), followed by Southeast Asia (4106.73 (3260.07 to 5250.54) per 100,000 children) and Oceania (3843.95 (2892.36 to 5110.39) per 100,000 children). The highest ASPR and age-standardized DALY rate of childhood malnutrition were observed in Western Sub-Saharan Africa (ASPR: (37218.83 (95% CI: 34341.32 to 39968.12) per 100,000 children); DALY rate: (2961.72 (2177.06 to 3944.28) per 100,000 children)), with High-income North America being the lowest estimates. Since 1990, the ASPR of childhood malnutrition has declined in most regions, with the greatest decline observed in East Asia, followed by Southeast Asia and high-income Asia Pacific. The largest decrease in ASIR was recorded in Central Sub-Saharan Africa, followed by Eastern Sub-Saharan Africa and Andean Latin America. However, the greatest increases were seen in Eastern Europe for ASIR. Regarding the age-standardized DALY rate, all regions have shown a downward trend from 1990 to 2019, with the greatest decrease being observed in East Asia.
Nationally, India (133,648,266) had the highest number of affected children in 2019, which accounted for 30.72% of the total number of children affected globally. The vast majority of countries have shown decreasing trends in ASRs over the study period. Equatorial Guinea showed the highest decline in ASIR, whereas Ecuador had the greatest decrease in ASPR. Meanwhile, the Democratic People’s Republic of Korea experienced the greatest decrease in the age-standardized DALY rate. In contrast, Zimbabwe was the only country where the age-standardized DALY rate increased. Taiwan (Province of China) had the greatest increase in ASIR among all nations and territories, whereas Yemen had the greatest increase in ASPR. In 2019, the highest ASIR of childhood malnutrition was shown in India (8930.63 (95% CI: 6824.33 to 11518.57)/100,000), whereas Peru (428.94 (344.44 to 534.57)/100,000) had the lowest reported ASIR (Fig. 3 and Supplementary Table 3). Notably, the ASPR of Bhutan was up to 50398.46 (95% CI: 43741.28 to 57065.8) per 100,000 children, with Chile (2112.67 (1096.34 to 4085.94)/100,000) being the lowest (Supplementary Table 4). As for age-standardized DALY rate, Mali (12124.41 (8258.07 to 17515.91)/100,000) carried the heaviest burden, with Chile (47.08 (25.28 to 89.36)/100,000) having the lowest estimate (Supplementary Table 5). As can be seen, all ASRs varied by over 20 times from country to country, indicating that the burden of child malnutrition disparately varied across countries.
Fig. 3
Incidence, prevalence, and DALY rates of children with nutritional deficiency in different countries and territories in 2019. (A) age-standardized incidence rate; (B) age-standardized prevalence rate; (C) age-standardized DALY rate; (D) estimated annual percent change of DALY rate
Childhood malnutrition burden and SDIChildhood malnutrition burden differed substantially based on SDI. Of the children with nutritional deficiency in 2019, 166.07 million (38.17%) lived in low-income countries and 8.79 million (2.02%) in high-income ones. As shown in Figs. 4 and 5, ASIR, ASPR, and age-standardized DALY rates of childhood malnutrition were more notable in lower SDI quintiles. In other word, ASIR (R = -0.67, P < 0.05), ASPR (R = -0.88, P < 0.05), and age-standardized DALY rate (R = -0.83, P < 0.05) were all negatively correlated with SDI. Since 1990, the ASPR and age-standardized DALY rates have decreased in all five SDI regions. Low-middle SDI countries showed the largest decrease in age-standardized DALY rate, but high SDI countries showed the lowest declines. Among the five SDI regions, the high-middle SDI region showed the most significant growth in ASIR.
Fig. 4
Incidence, prevalence, and DALY rates of children with nutritional deficiency in five SDI groups from1990 to 2019. (A) incidence; (B) prevalence; (C) DALY rate
Fig. 5
Incidence, prevalence, and DALY rates of children with nutritional deficiency across 21 GBD regions by SDI. (A) incidence; (B) prevalence; (C) DALY rate
Different malnutrition burdens among childrenThe global burden of different malnutrition subtypes in 2019 is listed in Supplementary Tables 6, 7, 8, 9 and 10. Iron deficiency was the most prevalent ND among children with malnutrition of both sexes worldwide, accounting for about 90% of all ND. 391.49 million (95% UI: 382.83 to 400.50) children suffered from iron deficiency in 2019, corresponding to a prevalence of 20,146.35 (95% CI: 19,407.85 to 20,888.54) per 100,000 children. Vitamin A deficiency was the second most prevalent malnutrition, affecting 209.67 million (196.24 to 225.11) children. Notably, the prevalence of vitamin A deficiency in children was as high as 10779.02 (95%CI: 9727.6 to 12133.06) per 100,000 children. Iodine deficiency was the least prevalent malnutrition during the period. Iron deficiency was associated with the highest DALYs, followed by protein-energy malnutrition, Vitamin A deficiency, and iodine deficiency.
Except for protein-energy malnutrition, the low SDI areas recorded the highest number of cases and prevalence of the remaining three types of malnutrition among five SDI areas. The number of prevalent cases of iron deficiency, vitamin A deficiency, and iodine deficiency among children in low SDI areas in 2019 were 154,901,335 (150,630,641 to 159,216,170), 106,741,856 (100,467,847 to 113,414,826), and 5,889,501 ( 3,971,517 to 8,153,952), respectively. Prevalence rates of these three types of malnutrition in low SDI areas were 32,516.96 (30,993.53 to 34,036.61), 22,389.56 (20,252.91 to 24,796.64) and 1275.4 (861.44 to 1762.91) per 100,000 children, respectively. The prevalent cases of protein-energy malnutrition among children in low-middle SDI areas was as high as 25,102,290 (23,894,967 to 26,615,434) with a prevalence of 5009.55 (4734.76 to 5340.25) per 100,000 children.
Among 21 GBD regions, South Asia (34,174,598 (32,267,712 to 36,551,526)) recorded the highest prevalent cases of protein-energy malnutrition in children in 2019, followed by Western Sub-Saharan Africa (8,704,211 (8,472,115 to 8,980,617)) and Southeast Asia (6,724,680 (6,372,986 to 7,149,002)). Meanwhile, South Asia (7069.86 (6645.26 to 7577.03) per 100,000 children) showed the highest prevalence of protein-energy malnutrition among children. Notably, South Asia also experienced the highest prevalent cases of vitamin A deficiency (47,190,262 (36,397,675 to 60,576,338)) and iodine deficiency (4,881,808 (3,116,618 to 7,125,750)). The top 3 prevalence rates of vitamin A deficiency in children were Central Sub-Saharan Africa (31,206.7 (23,673.5 to 39,486.02) per 100,000 children), Eastern Sub-Saharan Africa (25,052.34 (21,931.14 to 28,528.86) per 100,000 children) and Western Sub-Saharan Africa (18,803.86 (16,846.05 to 21,093.73) per 100,000 children). The prevalence of iodine deficiency was also highest in Central Sub-Saharan Africa (5478.62 (3785.45 to 7239.22) per 100,000 children), followed by South Asia (887.18 (565.43 to 1299.87) per 100,000 children) and Eastern Sub-Saharan Africa (788.37 (505.73 to 1172.02) per 100,000 children).
留言 (0)