Study population and data
This study used the data acquired from the 18th Korea Youth Risk Behavior Survey (KYRBS), 2022. A question on Mukbang and Cookbang was first added in 2022. The KYRBS is a nationwide, representative, and population-based database of Korean adolescents. Based on regional characteristics, proportional stratified random sampling was carried out annually. For example, we conducted sampling based on residential circumstances and school density. An anonymous online survey was conducted with 56,213 students in approximately 400 high schools and 400 middle schools in 2022, and 51,850 students (92.2%) who participated in the survey were analyzed.
MeasuresBMI
We used height and weight to calculate BMI, and the percentile cutoff for BMI was used to evaluate obesity. We classified people as underweight, normal, overweight, or obese if their BMI percentile was < 5th percentile, > 5th percentile and < 85th percentile, > 85th percentile and < 95th percentile, and > 95th percentile cutoff, respectively. The percentile is based on the latest version of “Korea Growth Charts,” which was conducted in 2017 [22]. The percentile curves in the Korean National Growth Charts depict the distribution of Korean children and adolescents’ height and weight. In addition, BMI status was subdivided into severely underweight (< 3rd percentile) and severely obese (> 97th percentile).
Mukbang and cookbang
To evaluate the frequency of Mukbang and Cookbang consumption, participants answered the question: how often they watched Mukbang and Cookbang during the previous 12 months. The answer had to be chosen from one of the following seven choices: 1-none, 2-less than once a month, 3-more than once a month and less than three times a month, 4-once or twice a week, 5-three or four times a week, 6-five or six times a week, 7-every day. We divided the participants into two groups; “Never” group consisting of individuals who answered as none (1) and “Ever” group consisting of individuals who chose other options (2–7), to observe dose-responses. In order to see if there’s any linear relationship between the odds of being obese and the frequency of watching Mukbang and Cookbang, “Ever” group was additionally divided into “Rarely” (less than once a week, options 2–3), “Occasionally” (less than 4 times a week, options 4–5), and “Always” (almost every day, options 6–7)” groups. Additionally, an analysis was conducted according to whether they were subjectively affected by watching Mukbang or Cookbang (including eating quickly, eating a lot, copying food on the show, eating snacks or late-night snacks other than mealtimes, and eating stimulatingly).
Covariates
All covariates were appeared to significantly effect on adolescent’s BMIs according to past case-study research. Three main types of covariates were used: sociodemographic, health-related, and habitual. Age and family structure were included as socio-demographic covariates [23]. Based on which school students attended, age was divided into two groups: middle school for ages 12,13,14,15 and high school for ages 16,17,18. Based on family structure, we divided participants as having either both parents, one parent, or none. Also, the analysis was adjusted for health-related covariates including sleep duration, smoking status, alcohol use, self-reported stress levels, and physical activity [24,25,26]. Sleep time was divided into three groups using 6 and 8 h cutoff [27, 28]. Self-reported stress levels were classified into three groups according to the answers to “How much stress do you feel?” For physical activity, we used two variables: overall exercise and muscle strengthening exercises. Overall exercise level was divided into two groups according to the answer to the question “How many days a week do you workout over 60 min?” Overall exercise was classified as “sufficient” if it was performed for ≥ 5 days a week and “insufficient” otherwise. Muscle strengthening exercises were divided into two groups according to the answer to the question, “How many days a week do you workout to strengthen your muscles?” Muscle strengthening exercise was classified as “sufficient” if it was performed for ≥ 3 days a week and “insufficient” otherwise. Both overall and muscle-strengthening physical activities were classified according to the KYRBS guidelines. We also used academic achievement and frequency of eating fast food and sweetened beverages as habitual covariates [29]. The frequency of eating fast food was divided into two groups using the cutoff of two times a week. Frequency of eating sweetened beverage was classified as “none,” “one or two times a week,” “three or four times a week,” and “over five times a week.” Academic achievement was divided into three groups based on self-reporting questions.
Statistical analysis
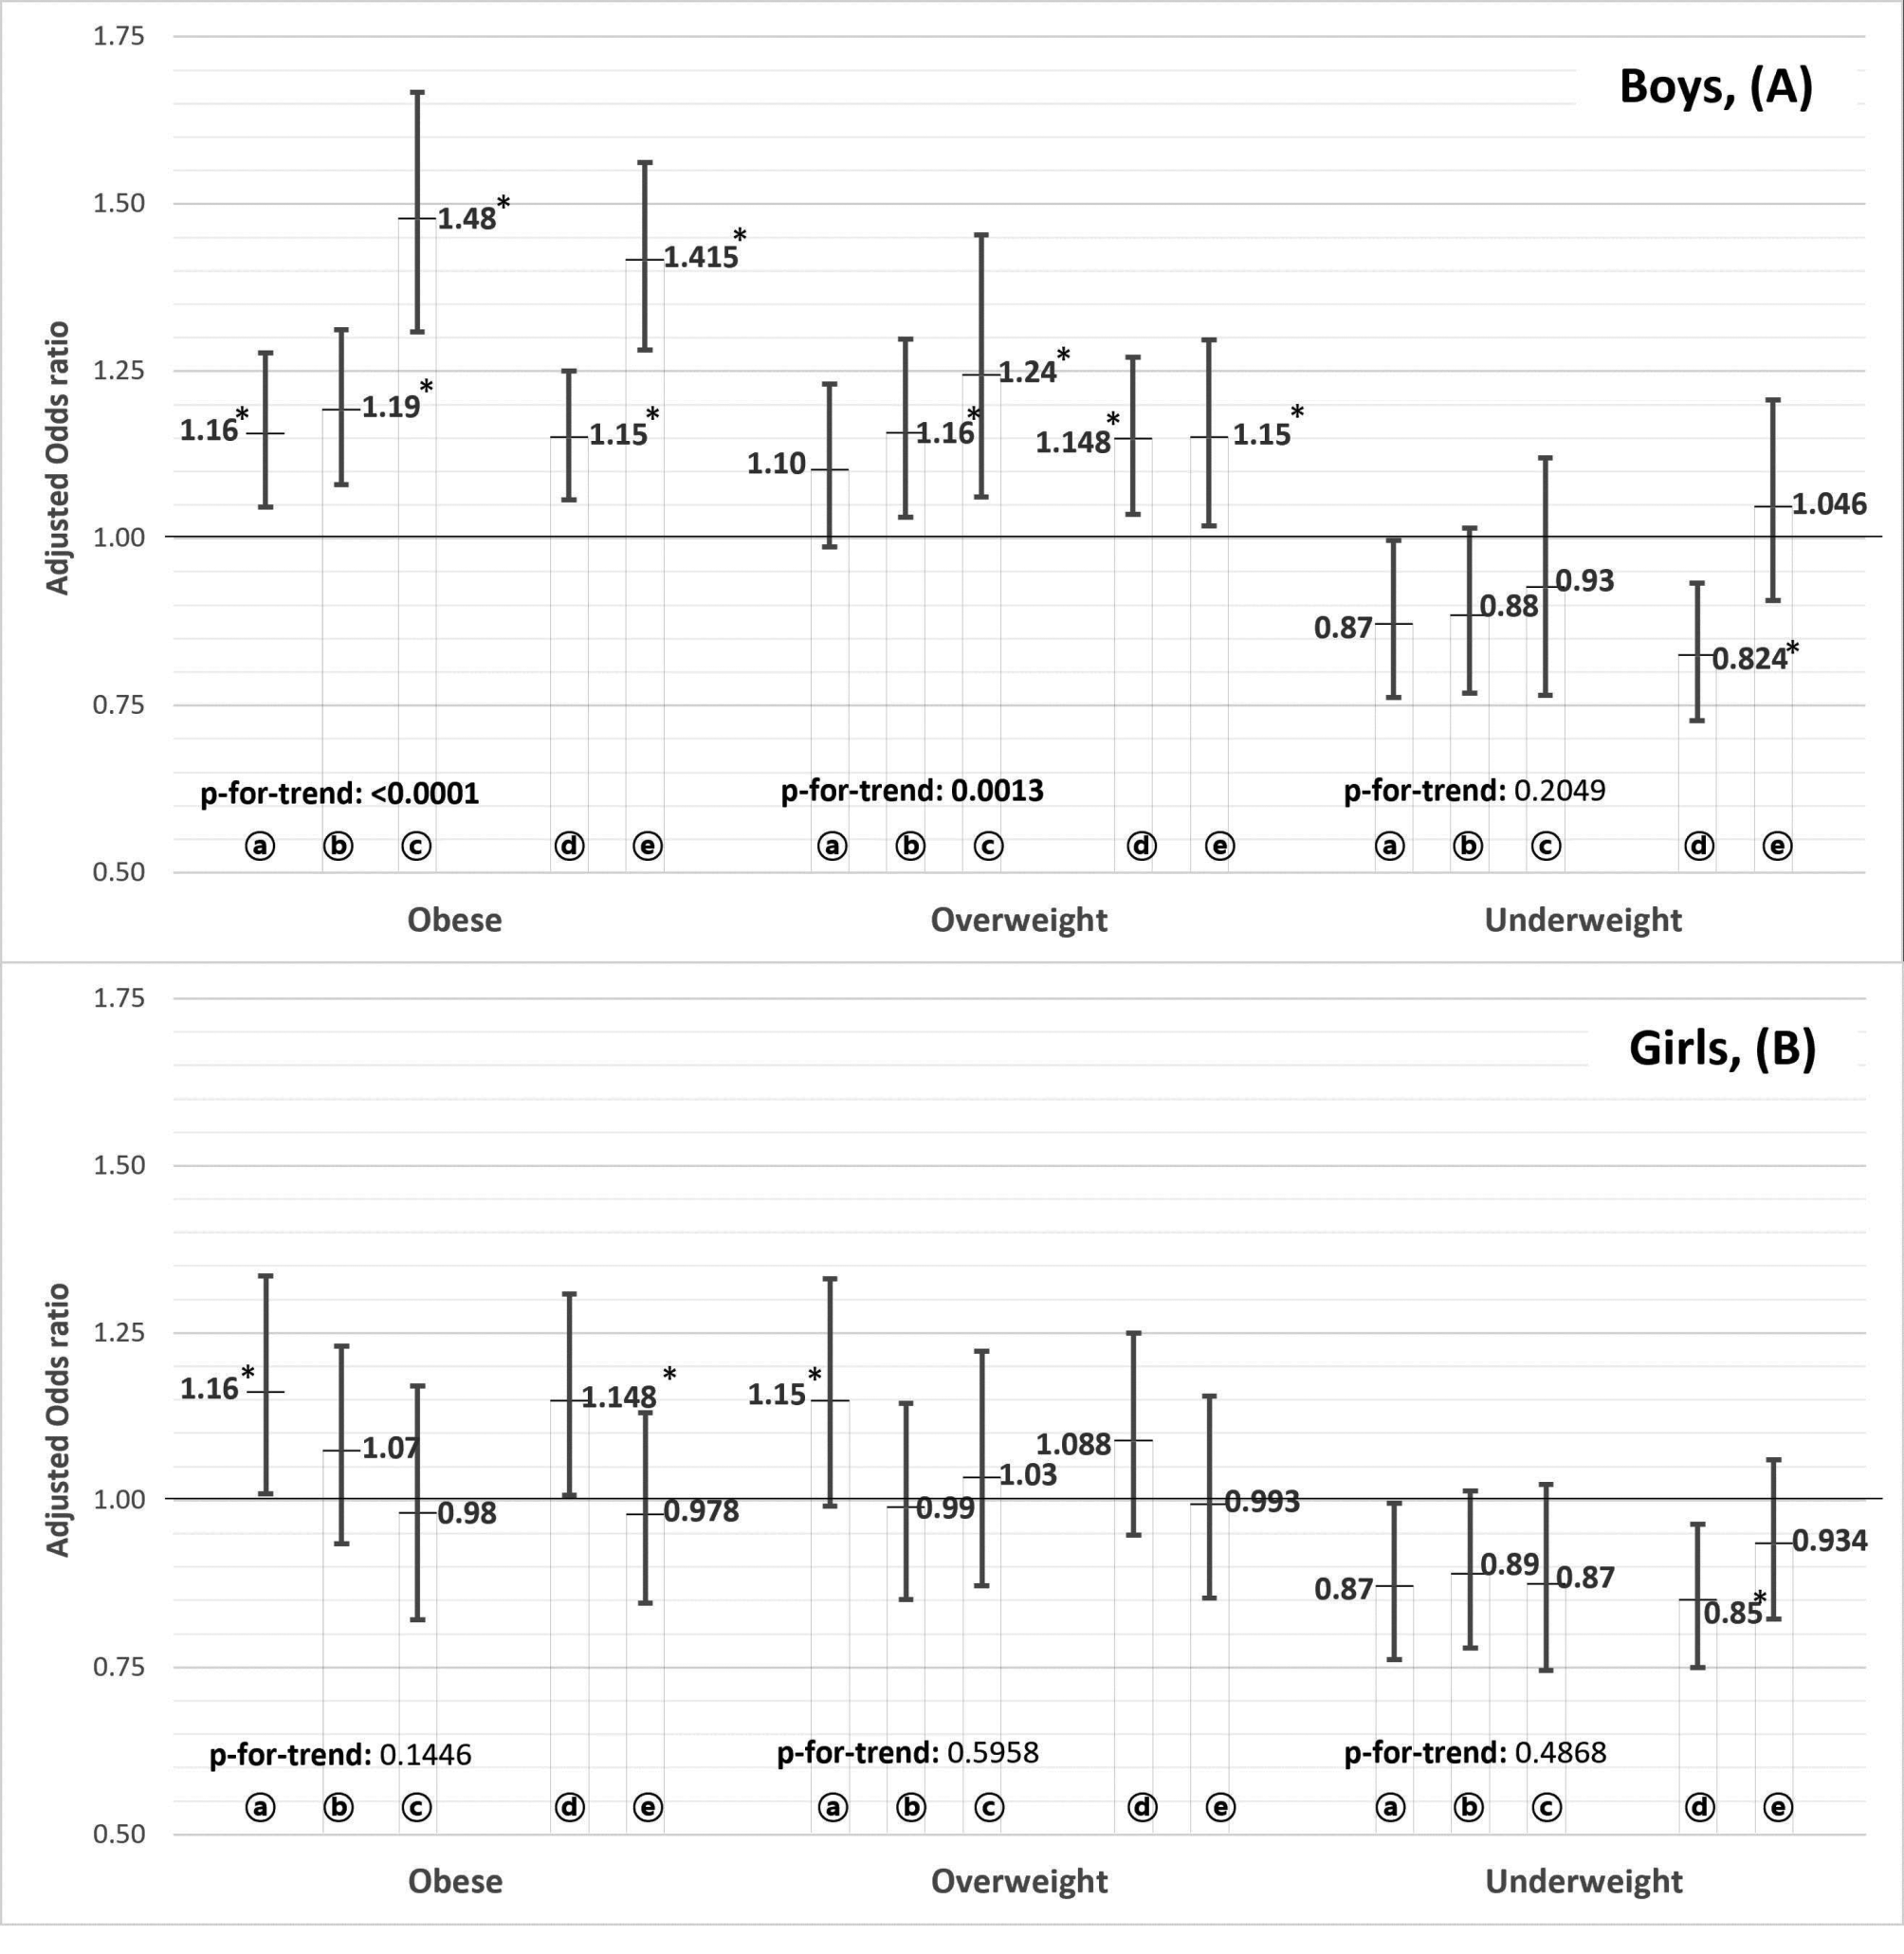
All analyses were stratified by gender. We analyze the variables using chi-square tests. To examine the association between “watching Mukbang and Cookbang” and BMI status (underweight, overweight, and obese), we used a multinomial logistic regression analysis to adjust for all covariates. The covariates are age, family structure, sweetened beverages, fast-food, alcohol status, smoking status, academic achievement, sleep duration, perceived stress level, physical activity, and muscle strengthening exercises. We also analyzed subgroups to find the relationship between the frequency of watching Mukbang and Cookbang and BMI. In addition, obese and underweight participants were divided into two groups each: severely underweight (BMI percentile < 3), underweight (3–5 percentile), obese (95–97 percentile), and severely obese (> 97 percentile) to assess any correlation between severely obese and severely underweight adolescents and watching Mukbang. Odds ratios [30] and 95% confidence intervals (CI) are presented to compare the likelihood of being underweight, overweight, and obese. Variance inflation factors for the study variables were found to be smaller than 1.32; therefore, there was no evidence of multicollinearity. We used SAS software (version 9.4; SAS Institute, Cary, North Carolina, USA) for analysis, and p-values < 0.05 were considered as statistically significant.


留言 (0)