
記住我
The current sample is a subsample of participants from the SENDA study [34]. In the SENDA study, non-demented persons aged 80 years and older were recruited in Chemnitz, Germany, and its surrounds. The exclusion criteria were: (1) diagnosis of acute psychological disorders (such as major depressive disorder) (2) diagnosis of neurocognitive disorders, (3) permanent impairments due to stroke or brain surgery, (4) diagnosis of other neurological diseases (such as epilepsy, Parkinson, or neuropathy) (5) substance abuse, (6) participation in other clinical studies, (7) a physician-directed ban from physical activities, (8) no walking ability, (9) severe restrictions due to cardiovascular, pulmonary, or orthopedic diseases, and (10) failure to reach the minimum required score of 19 during screening with the Montreal Cognitive Assessment (MoCA, [35]). The study was approved by the Ethics Committee of the Chemnitz University of Technology (TU Chemnitz), Faculty of Behavioral and Social Sciences, on December 19, 2017 – number V-232–17-KM-SENDA-07112017. Informed consent was obtained from all individual participants included in that study. The trial was retrospectively registered at German Clinical Trials Register (DRKS) with registration number DRKS00013167. In this study, we analyzed a subsample of N = 138 cognitively healthy participants according to the MoCA cut-off criteria (MoCA ≥ 23, Carson et al. [36]), that took part in the cardiorespiratory fitness assessment and the flanker task. In addition, we also excluded participants from our data analysis due to: accuracy in the flanker task below chance overall or in at least one condition (n = 4), a flanker answer rate below 75% (n = 1), technical issues during recording (n = 2), the participant did not follow the instructions for the task (n = 1), noisy EEG data (n = 3), colorblindness (n = 2), inability to do the fitness assessment (n = 1), and being left-handed according to the Oldfield Handedness Inventory (n = 9). The final sample included N = 115 participants (age: M = 82.4 years, SD = 2.3) and consisted of 55 females and 60 males (see Table 1 for further demographic data).
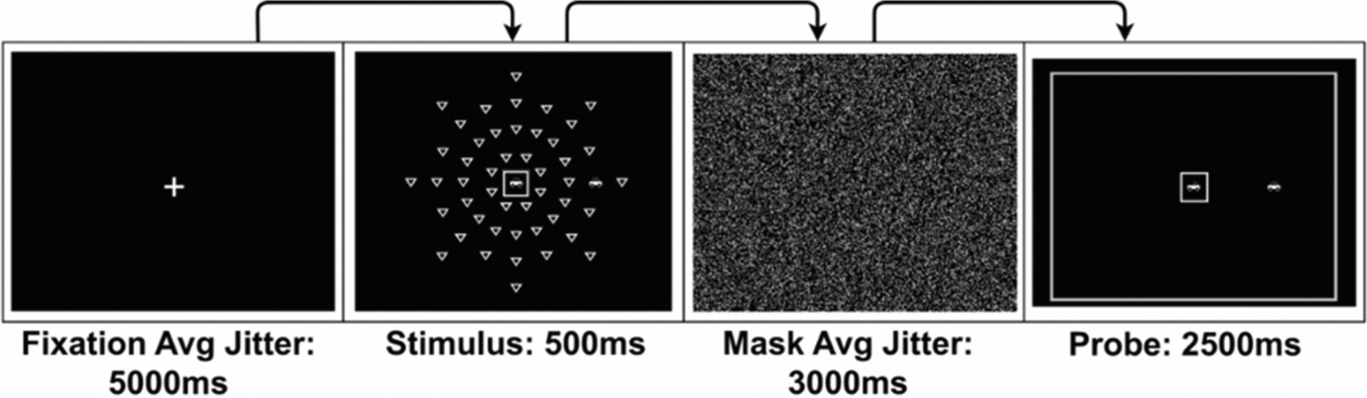
Table 1 Demographic dataMaterialFlanker taskA modified Eriksen flanker task [23] was used to study attentional control and response inhibition. Presentation (Neurobehavioral Systems, Berkeley, CA, USA) was used to present the stimuli, record responses, and send markers to the EEG. The stimuli consisted of a center disk (17 mm) surrounded by four flanker disks of the same size displayed against a black background (Fig. 1) on a 23.8 inch monitor (hardware resolution 1920 × 1080 pixels). Participants were asked to ignore the flanker disks (blue, red, or green) and to react only to the color of the center disk (red or green). Responses were carried out by pressing the down arrow key (marked green) with the right index finger and the right arrow key (marked red) with the right middle finger of a commercial German keyboard. The trials required the resolution of different amounts of distractor conflict based on the color combination of the target and flankers. Congruent (C) trials (all green or all red) had no conflict, neutral (N) trials included only visual conflict (blue flankers around a red or green target) and incongruent (IC) trials had added response conflict (green flankers around a red target or vice versa). This colored flanker version was adapted for the sample age by increasing the stimulus size and expanding the response window used by Winneke et al. [11].
Fig. 1
Setup of a trial in the flanker test
The experiment consisted of 20 practice trials and three blocks of 100 task trials. All three types of stimuli (C, N, IC) were presented randomly with equal probability. One trial (Fig. 1) consisted of a fixation cross (300 ms), a blank screen (200 ms), stimulus presentation (200 ms), a blank screen during the response interval (terminated by key press, maximal 3000 ms), and a blank break interval screen (randomly allocated between 500 to 800 ms). The whole flanker task (including practice trials) took participants approximately 12–15 min.
EEG RecordingWe used the actiCHamp system (Brain Products GmbH, Gilching, Germany) with 32 active EEG electrodes to record the EEG during the Flanker task. The electrodes were positioned according to the international 10–20 system at Fp1, Fp2, F7, F3, Fz, F4, F8, FC5, FC3, FC1, FC2, FC4, FC6, T7, C3, Cz, C4, T8, CP5, CP3, CP1, CP2, CP4, CP6, P7, P3, Pz, P4, P8, O1, Oz, and O2. The setup included an online reference electrode at Fz and a ground electrode at Fpz. We kept electrode–skin impedance below 25 kΩ and recorded at a 500 Hz sampling rate and 24-bit resolution.
Cardiorespiratory fitnessThe two-minute step test [TMST, 37] was used to assess cardiorespiratory fitness because it is an appropriate measure for OA and has good validity [38]. Participants raised one knee at a time, alternating between the left and right knee, and completed as many repetitions as they could in two minutes. The number of lifts completed with the right knee was recorded. The target height of each knee lift was individually marked for each participant so as to be level with the halfway point between the midpoint of their patella and the top of their iliac crest.
ProcedureThe TMST and EEG recording during the flanker task only made up a small part of the testing on the day. Further measurements taken but not included in this analysis involved other motor tasks including gait, balance, grip strength, and fine motor performance, in addition to a demographic and health questionnaire. The order of measurements was as follows: Participants were randomly allocated to perform a dual-task walking test or the same cognitive task while seated. Subsequently, a short physical performance battery was performed with the TMST as the final assessment. Following this, the unfulfilled condition of the dual-task paradigm (sitting or walking) was executed. The remaining procedural steps remained constant, with the flanker test performed following the fine motor tasks, which used the same EEG setup. Rest periods were offered throughout the procedure, and all participants were given a break prior to their EEG recording. All the tests took each participant approximately 2.5 h.
Data analysisFlanker performanceThe preprocessing of the flanker RT data was done using the R base package [39]. Performance parameters (RT and accuracy) were calculated separately for each condition. Prior to averaging, RT < 100 ms were removed because it is not possible to consciously process the stimuli this quickly. In addition, trials with a RT more than two standard deviations slower than the individual mean for the trial type were also removed [40]: only 4% of the trials were removed for these reasons. Afterward, the mean RT was calculated for each trial type based on correct responses only. Table 2 presents the average performance per condition, which confirms that the manipulation of distractors was successful by showing that performance in all outcomes deteriorated with increasing distractor conflict.
Table 2 Behavioral data (N = 115) for the colored flanker taskEEG preprocessing and ERP analysisBrainVision Analyzer 2.2.1 (BrainProducts GmbH, Gilching, Germany) was used for all preprocessing steps. The data was filtered with a zero-phase-shift Butterworth filter (low cut off 1 Hz, order 8; high cut off 30, order 8; notch filter 50 Hz). Eye blinks were corrected via the software implemented Ocular Correction ICA [41] using Fp1 as the reference channel for vertical eye movements. Afterwards, re-referencing was carried out to a common average reference including all 32 electrodes used in the setup. Only trials with a correct answer given within 1500 ms of the presentation of the stimulus were included in the following steps of the analysis. In order to be able to analyze both stimulus-locked and response-locked activity, the continuous data was segmented into 2500 ms epochs relative to the stimulus onset (-200 ms to 2300 ms). A baseline correction was carried out for each segment by subtracting the average pre-stimulus activity (-200 ms to 0 ms). Afterward, automatic electrode-wise artifact rejection was used to remove all trials in which the maximal allowed difference of 100 µV within intervals of 100 ms was exceeded [25].
Based on these pre-processed epochs, stimulus-locked ERPs were obtained by averaging the segments of each condition (C, N, IC) and automatically detecting global peaks in the following time windows: (1) N1 at O1 and O2: negative peak 100 – 200 ms, (2) N2 at Cz and Fz: negative peak 200 – 400 ms, and (3) P3 at Pz: positive peak 350 – 650 ms. These time windows were determined based on Reuter et al. [25], who used the same flanker task, with one modification: The P3 time window was adjusted to be 50 ms later to account for the sample age [42]. The automated peak analysis was checked visually and the search windows were adapted when necessary (n = 20, ca. 17% of the sample). Of the responses that were adapted, the search window for N1 was extended to 250 ms for twelve participants, the N2 window was shortened (individual windows) for four participants, and the P3 window was moved forward 50 ms to 300 – 600 ms for ten participants. Some participants’ results required multiple adaptions.
From the same pre-processed epochs segments relative to the time of keypress (-500 ms to 500 ms) were extracted. The MRCPs were obtained by averaging segments for each condition (C, N, IC) and automatically detecting the most negative local peak at C3 (contralateral to the right hand used for button press) in the pre-response time window -200 to 0 ms [29].
EEG parameters for the C, N, and IC conditions were based, on average, on 93 trials (range 65 – 120), 92 trials (range 66 – 115), and 89 trials (range 52 – 112). The mean latency in milliseconds and mean amplitude in microvolt for each peak were then exported for statistical analysis. Mean amplitudes were calculated as the average voltage in a 40 ms window centered ± 20 ms around the peak [25, 43]. For all statistical analysis, the N1 amplitude and latency was taken from electrode O2 because the O1 and O2 measures were highly correlated and both led to the same results. In addition, the data points from the averaged waveform O2, Fz, Cz, Pz (stimulus-locked), and C3 (response-locked) were exported and used for the creation of graphics in R with the ggplot2 package [44].
ERP data qualityThe bootstrapped standard measurement error (bSME) according to Luck et al. [45] was estimated in order to quantify the data’s quality and the precision of the ERP parameters of interest for each individual. For this purpose, preprocessed single trial data was exported from BrainVisionAnalyzer and a custom-made R script was used to obtain bSME values (10,000 bootstrapping runs) separately for each person, condition and parameter. Within this procedure, the adapted time windows were used when the search window was changed upon visual inspection (i.e., 300–600 ms instead of 350 – 650 ms). Root mean squares (RMS) were calculated to aggregate across all participants and reliability was calculated for each ERP parameter of interest as the ratio of true variance to total variance [45].
Statistical analysisAll statistical analyses were done using IBM SPSS 29 (IBM Corp., Armonk, NY, USA). For each ERP parameter (N1 amplitude, N1 latency, frontal N2 amplitude, frontal N2 latency, central N2 amplitude, central N2 latency, P3 amplitude, P3 latency, MRCP amplitude, and MRCP latency), a repeated measure analysis of variance (rmANOVA) with one factor (Condition: C, N, or IC) was run in order to test for the effects of perceptual and response conflict on amplitude and latency. The Greenhouse-Geisser correction was applied to correct for violations of sphericity when necessary. Significant results were followed up by pairwise comparisons of estimated marginal means.
For mediation analysis, SPSS PROCESS macro v4.0 was used [46]. A parallel mediation model was used to study the direct effect (c’) of fitness (measured with TMST) on flanker task performance (measured as RT) as well as the indirect effect (ab) mediated through the ERP parameters: N1 amplitude, N1 latency, frontal N2 amplitude, frontal N2 latency, central N2 amplitude, central N2 latency, P3 amplitude, P3 latency, MRCP amplitude, and MRCP latency. In addition, the total effect (c) was estimated in order to quantify the relationship between fitness and flanker performance without controlling for the mediators. Sex was also included as a covariate in the model. Figure s1 in the Supplement includes a graphical illustration of the full model. All regression coefficients were reported as standardized coefficients and effects were regarded as significant at p-values < 0.05. Bootstrapped (5,000 runs) confidence intervals were used to determine the significance of indirect effects. Three separate mediation models were analyzed, one for each condition of the task. Only significant results are reported in this text. For ease of understanding, the illustrations of the results were pruned to display the mediators that revealed significant results. Tables s1–s3 in the Supplement include the full model statistics.
留言 (0)