Study design and setting
For this retrospective cohort study, we used data from the RWD database, which is maintained by the Health, Clinic, and Education Information Evaluation Institute, with support from Real World Data Co., Ltd [22, 23]. It contained records of 24 million patients from 225 medical institutions across Japan as of 2022. Those hospitals included various types of hospitals, private and public, from large medical centers to clinics [24]. The database includes the following patient information: demographic data, diagnoses according to the International Classification of Diseases, 10th Revision (ICD-10) codes, procedures, medications, and laboratory test results. This study was approved by the Ethics Committee of Kyoto University (R3141) and did not require individual consent because data were anonymized. During the study, we adhered to the tenets of the Declaration of Helsinki.
Patients’ criteria
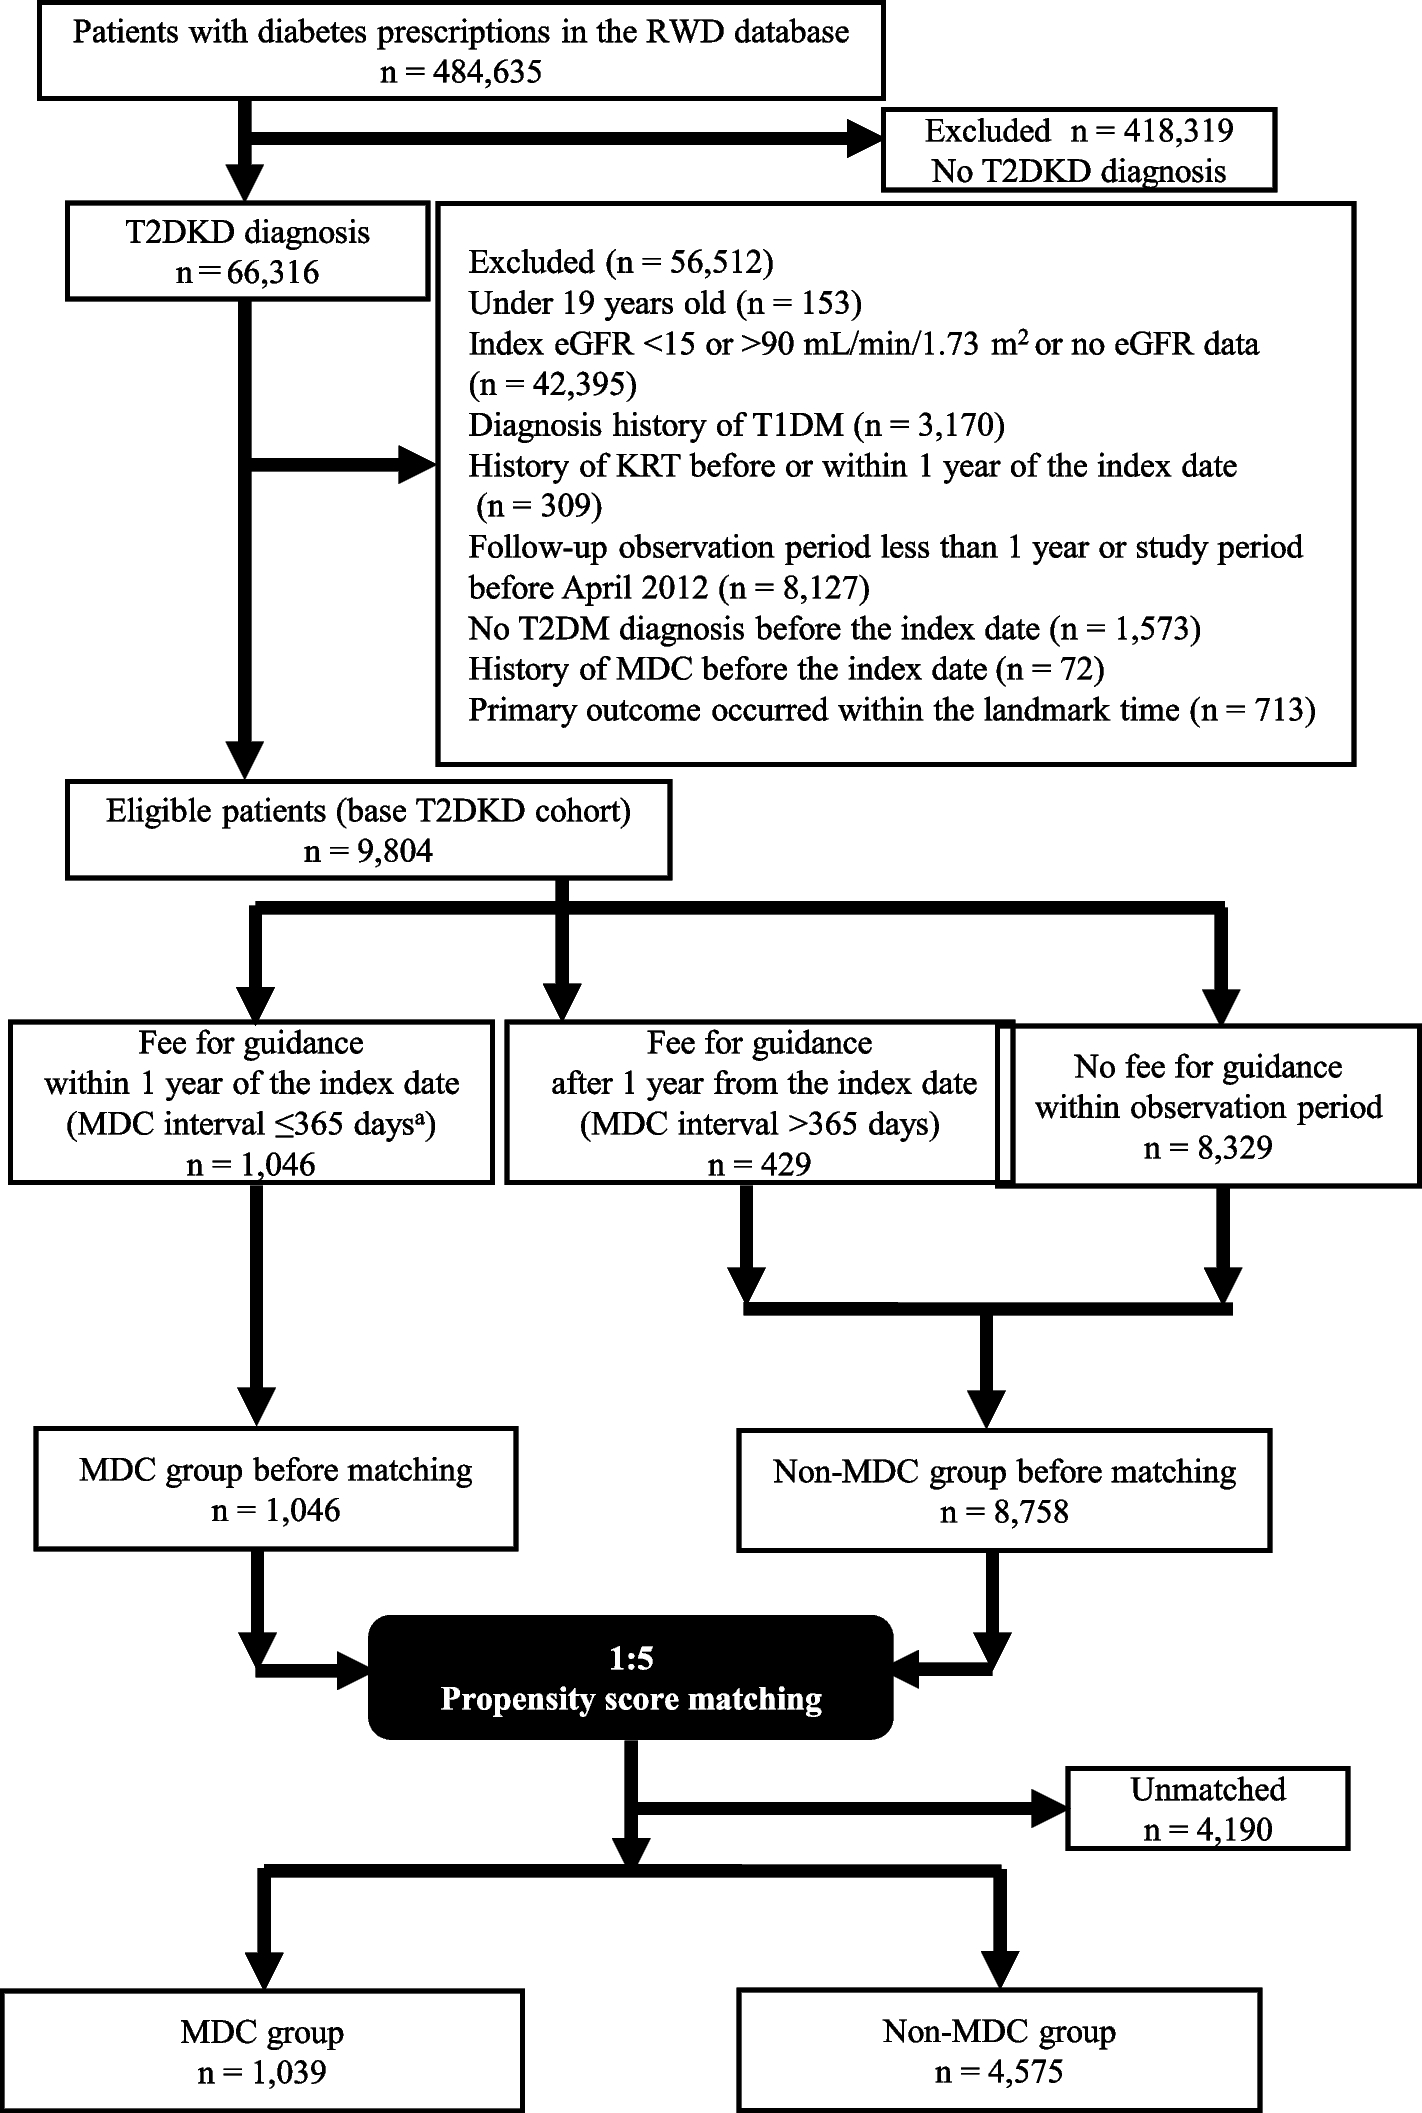
We extracted data of patients with diagnostic codes for DKD (E112 and E142) [25] for whom diagnostic codes for T2DM (E11–E14) had been assigned before the index date (date when the diagnostic codes for DKD were assigned). Other inclusion criteria were age ≥ 20 years at index date and an index estimated glomerular filtration rate (eGFR; defined as the eGFR measured close to the index date [within 90 days]) of 15–90 mL/min/1.73 m2. We excluded patients without index eGFR data, without available follow-up eGFR data more than 1 year after the index date, who had a diagnostic code for type 1 diabetes (E10) before the index date, who had undergone KRT before or within 1 year of the index date, and in whom the fee code for medical guidance for the prevention of dialysis related to diabetes was assigned before the index date. We used landmark analysis to reduce immortal time bias [26] because the time between DKD diagnosis and guidance to prevent dialysis differed among patients, and no outcome occurred between diagnosis and treatment in certain patients. We defined the landmark time as 1 year after DKD diagnosis, and patients in whom one of the outcomes occurred within 1 year from the index date were excluded from the analysis. The study period for the index date was April 2012 to January 2020. The time window for this study is summarized in Supplemental Fig 1.
Medical guidance to prevent dialysis in patients with diabetes
We used the fee codes for medical guidance to prevent dialysis in patients with diabetes to distinguish between the MDC and non-MDC groups. The fee code was identified using the procedure code B001-27. First, staff required for assignment of the fee code comprised a team of physicians, nurses, and dietitians with at least 5 years of experience in diabetes or DKD guidance. Nurses with 2 years of experience and at least 1,000 h of guidance were also acceptable. The requirements for the assignment of the fee code are as follows [27]: 1) glycated hemoglobin (HbA1c) level > 6.5% (National Glycohemoglobin Standardization Program value) or use of oral hypoglycemic agents or insulin; 2) DKD stage 2 or higher (microalbuminuria and eGFR ≥ 30 mL/min/1.73 m2 before the dialysis initiation); and 3) fee code assigned once a month and not in the same month as that for outpatient nutritional guidance. The need for and specifics of the guidance was left to the clinician’s discretion. Examples of guidance included salt reduction, weight loss, smoking cessation, cessation of excessive alcohol consumption, exercise therapy, KRT, and management of comorbidities. The method by which guidance was provided was as follows. Physicians provide guidance to nurses and dietitians in advance, with each professional creating individualized instructional plans. On the designated guidance day, the physicians, nurses, and dietitians conduct separate guidance sessions and subsequently document each session for later review. Thereafter, team conferences and assessments of instructional effectiveness may be conducted as needed, although the frequency is not explicitly defined and is left to the discretion of each facility. Additionally, as a fee code need not be assigned for team conferences, the actual occurrence of team conferences could not be extracted from the database.
The MDC and non-MDC groups included patients who were and were not, respectively, assigned the guidance fee code at least once within 1 year of the index date. This allocation was performed according to an intention-to-treat analysis regardless of fee codes assigned after the landmark time.
Variables
The primary outcome was a 40% decline in eGFR from the index eGFR (confirmed twice at least 30 days apart). This outcome is in line with the 30%–40% reduction in eGFR over 2–3 years in patients with CKD with rapid progression, serving as a surrogate endpoint for kidney failure with replacement therapy (KFRT) [28, 29]. We calculated the eGFR by using the following well-validated formula proposed by the Japanese Society of Nephrology [30]:
$$\mathrm\;\mathrm/\min/1.73\;\mathrm m^2\:=\:194\,\:\times\:\,\mathrm\;\mathrm^\;\mathrm/\mathrm\,\:\times\:\,\mathrm^\;\mathrm\,\:\times\:\,0.739\;\mathrm\;\mathrm$$
Secondary outcomes were death from any cause, hospitalization, permanent dialysis, KFRT (eGFR ≤ 15 mL/min/1.73 m2, confirmed twice within 30 days), and emergency temporary catheterization for blood access.
Covariates used included age, sex, laboratory data (eGFR, proteinuria, and low-density lipoprotein cholesterol, uric acid, and HbA1c levels), body mass index, smoking status, duration of diabetes (time from date of diagnosis of T2DM to that of DKD), comorbidities (hypertension, hyperlipidemia, ischemic heart disease, and hyperuricemia), medications (oral hypoglycemic agents, insulin, calcium channel blockers, renin–angiotensin system antagonists, β-blockers, lipid-lowering agents, and uric acid-lowering agents), procedures (percutaneous coronary angioplasty, coronary artery bypass grafting, and cerebrovascular surgery), and the number of hospital beds. Covariates were identified by their diagnostic, procedural, and Anatomical Therapeutic Chemical (for medications) codes (Supplemental Table 1). Proteinuria was assessed using a urine dipstick test that is used for universal screening in Japan [31].
Statistical analysis
Continuous variables are presented as means and standard deviations (SDs) or medians and interquartile ranges (IQR). Categorical variables are presented as frequencies and percentages. Propensity score (PS) matching was used to match patients’ backgrounds between the two groups. Covariates used for PS calculation were sex, age, number of hospital beds, index eGFR, duration of diabetes, medications, and procedures. Other covariates were not used because of missing values, and we believe that the covariates used were sufficient to adjust for confounding factors based on previous studies [18, 32,33,34]. We used 1:5 matching, a logistic regression model, and the non-replacement nearest-neighbor method with a caliper width of 0.2 of the SD. After PS matching, the absolute standardized mean difference (ASMD) was used to compare the two groups, and Kaplan–Meier survival curves were constructed. Data were censored at death and at the date of the last observation in the database. Time zero was defined as the landmark time, and log-rank tests were used for comparison. Multivariable Cox regression was used to estimate the hazard ratios (HRs) and 95% confidence intervals (CIs). Covariates used for adjustment in the multivariable analysis were the same as those used for PS calculation. All P-values were two-sided, and P < 0.05 was considered statistically significant. All analyses were performed using R version 4.2.3 (R Foundation for Statistical Computing, Vienna, Austria).
Sensitivity analysis
We performed several sensitivity analyses to confirm the robustness of the results. First, we added an extra criterion for censoring. If patients received their first guidance after the landmark time, they were censored at that time and considered a part of the non-MDC group. Second, we revised the definitions of the MDC and non-MDC groups. The former included patients who had received guidance more than twice within 1 year of the index date, while the latter included patients who had not received or only one guidance during that period because only one guidance might not have been enough. Third, we set the upper limit for the observation period at 3 years after the index date; all patients were censored thereafter. Fourth, we changed the duration of the landmark time from 1 to 2 years. In this analysis, patients without available follow up eGFR data for more than 2 years after the index date or who had received KRT within 2 years of the index date were also excluded, and both groups were reclassified accordingly. Fifth, we conducted inverse probability of treatment weighting (IPTW) and overlap weighting [35] instead of PS matching. The first three sensitivity analyses were performed for the primary and secondary outcomes, whereas the remaining sensitivity analyses were performed only for the primary outcome.


留言 (0)