Animals
All study protocols were approved by the Institutional Animal Care and Use Committee of Chungnam National University, Republic of Korea (CNUH-019-A0009-2). Mice were housed in groups on a 12-h light/dark cycle with food and water available. Male and female littermate WT mice and 5XFAD mice with a C57BL/6 J background were used as the control and AD model mice, respectively, and were provided by the Korea Brain Research Institute, Republic of Korea. Mice were genotyped by tail biopsy, tissue digestion, and genomic DNA polymerase chain reaction using the following primers: APP-forward, 5′-AGG ACT GAC CAC TCG ACC AG-3′; APP-reverse, 5′-CGG GGG TCT AGT TCT GCA T-3′; control-forward, 5′-CTA GGC CAC AGA ATT GAA AGA TCT-3′; and control-reverse, 5′-GTA GGT GGA AAT TCT AGC ATC C-3′. All mice were housed under conditions of 40% to 60% humidity at 20 to 26 °C. Ventilation was refreshed 15 to 16 times per hour, lighting was maintained at 150 to 300 lx, and experiments were conducted under the conditions of the Pre-Clinical Experiment Center of Chungnam National University Hospital, Republic of Korea.
Human brain tissues and ethics approval
Frozen human brain tissues were obtained from the Victorian Brain Bank Network, Australia, supported by The Florey Institute of Neuroscience and Mental Health, The Alfred Hospital, and the Victorian Institute of Forensic Medicine, Australia, and funded by the National Health and Medical Research Council, Australia. Details of the human post-mortem cortex tissues are shown in Suppl. Figure 4A. Human tissue experiments were approved by the Bioethics Committee, Institutional Review Board, Chungnam National University Hospital Industry Foundation, Republic of Korea (Institutional Review Board No. CNUH-2020–10-085).
Intrathecal injection and intravenous injection
For anesthesia, the mice were administered 5% isoflurane in oxygen within an induction chamber, followed by a transition to a maintenance dose of 2% isoflurane. Each mouse was securely positioned in a stereotaxic frame, immobilized with ear bars, and oriented such that the head formed an approximate 120-degree angle with the body. The NPs were administered directly into the cerebrospinal fluid of the cisterna magna through the atlanto-occipital membrane of the skull and via the C1 vertebra. A Hamilton syringe (26 G needle with a 30° beveled tip) was used to slowly inject by hand 20 µL NPs in phosphate-buffered saline (PBS) over 1 min at a depth of 5 mm. The needle was left in place for an additional minute before removal, and then direct pressure was applied to the puncture site. Furthermore, normal body temperature was sustained consistently throughout the experiment by adjusting the isoflurane dose and utilizing environmental heating [25]. PyrPeg was injected intravenously at 10 mg/kg, and mice were euthanized 2 days later. PyrPeg was a gift from Dr. C. Justin Lee of the Institute for Basic Science, Republic of Korea. PyrPeg images were detected with 450 ~ 650 nm fluorescent wavelengths [26].
Behavior tests
The Barnes maze test was performed first. The Barnes maze was used to examine hippocampal-dependent spatial learning and memory [27]. This behavioral task is divided into 2 phases: a training phase and a probe test. For the training phase, the mice were placed in the center of the circular platform at the start of each trial and given a defined period of time to find the target escape hole. Affix three distinct shapes (star, square, triangle) onto the wall to indicate the cardinal directions: north, south, east, and west. Additionally, during all training and learning experiments, a metronome sound set at 80 beats per minute (bpm) was employed. If an animal entered the target escape hole before the end of the defined time period, the experiment ended. For each trial, we recorded the time it took for each mouse to find the target escape hole. The mice received 5 trials over 5 days (1 trial per day). On each day (days 1 to 3) of the training phase, the mice were given 2 min of exploration time to help the mouse to find the hidden home cage, which was located through the target escape hole. The mice were also given 5 min per day in the home cage for them to rest and acclimatize.
The radial maze test was performed second and was used to measure spatial working memory [28]. The radial maze was made up of an octagonal central platform (32 cm in diameter) and 8 equally spaced radial arms (each 50 cm long and 12 cm wide). The maze was set in an experimental room with external visual cues. The apparatus was cleaned with ethanol solution between trials. All procedures were performed during the light period of the light/dark cycle. All trials were recorded and analyzed with a Noldus EthoVision XT 15 system, and escape delay, distance traveled, and velocity were measured.
Mouse brain section preparation and immunofluorescence staining
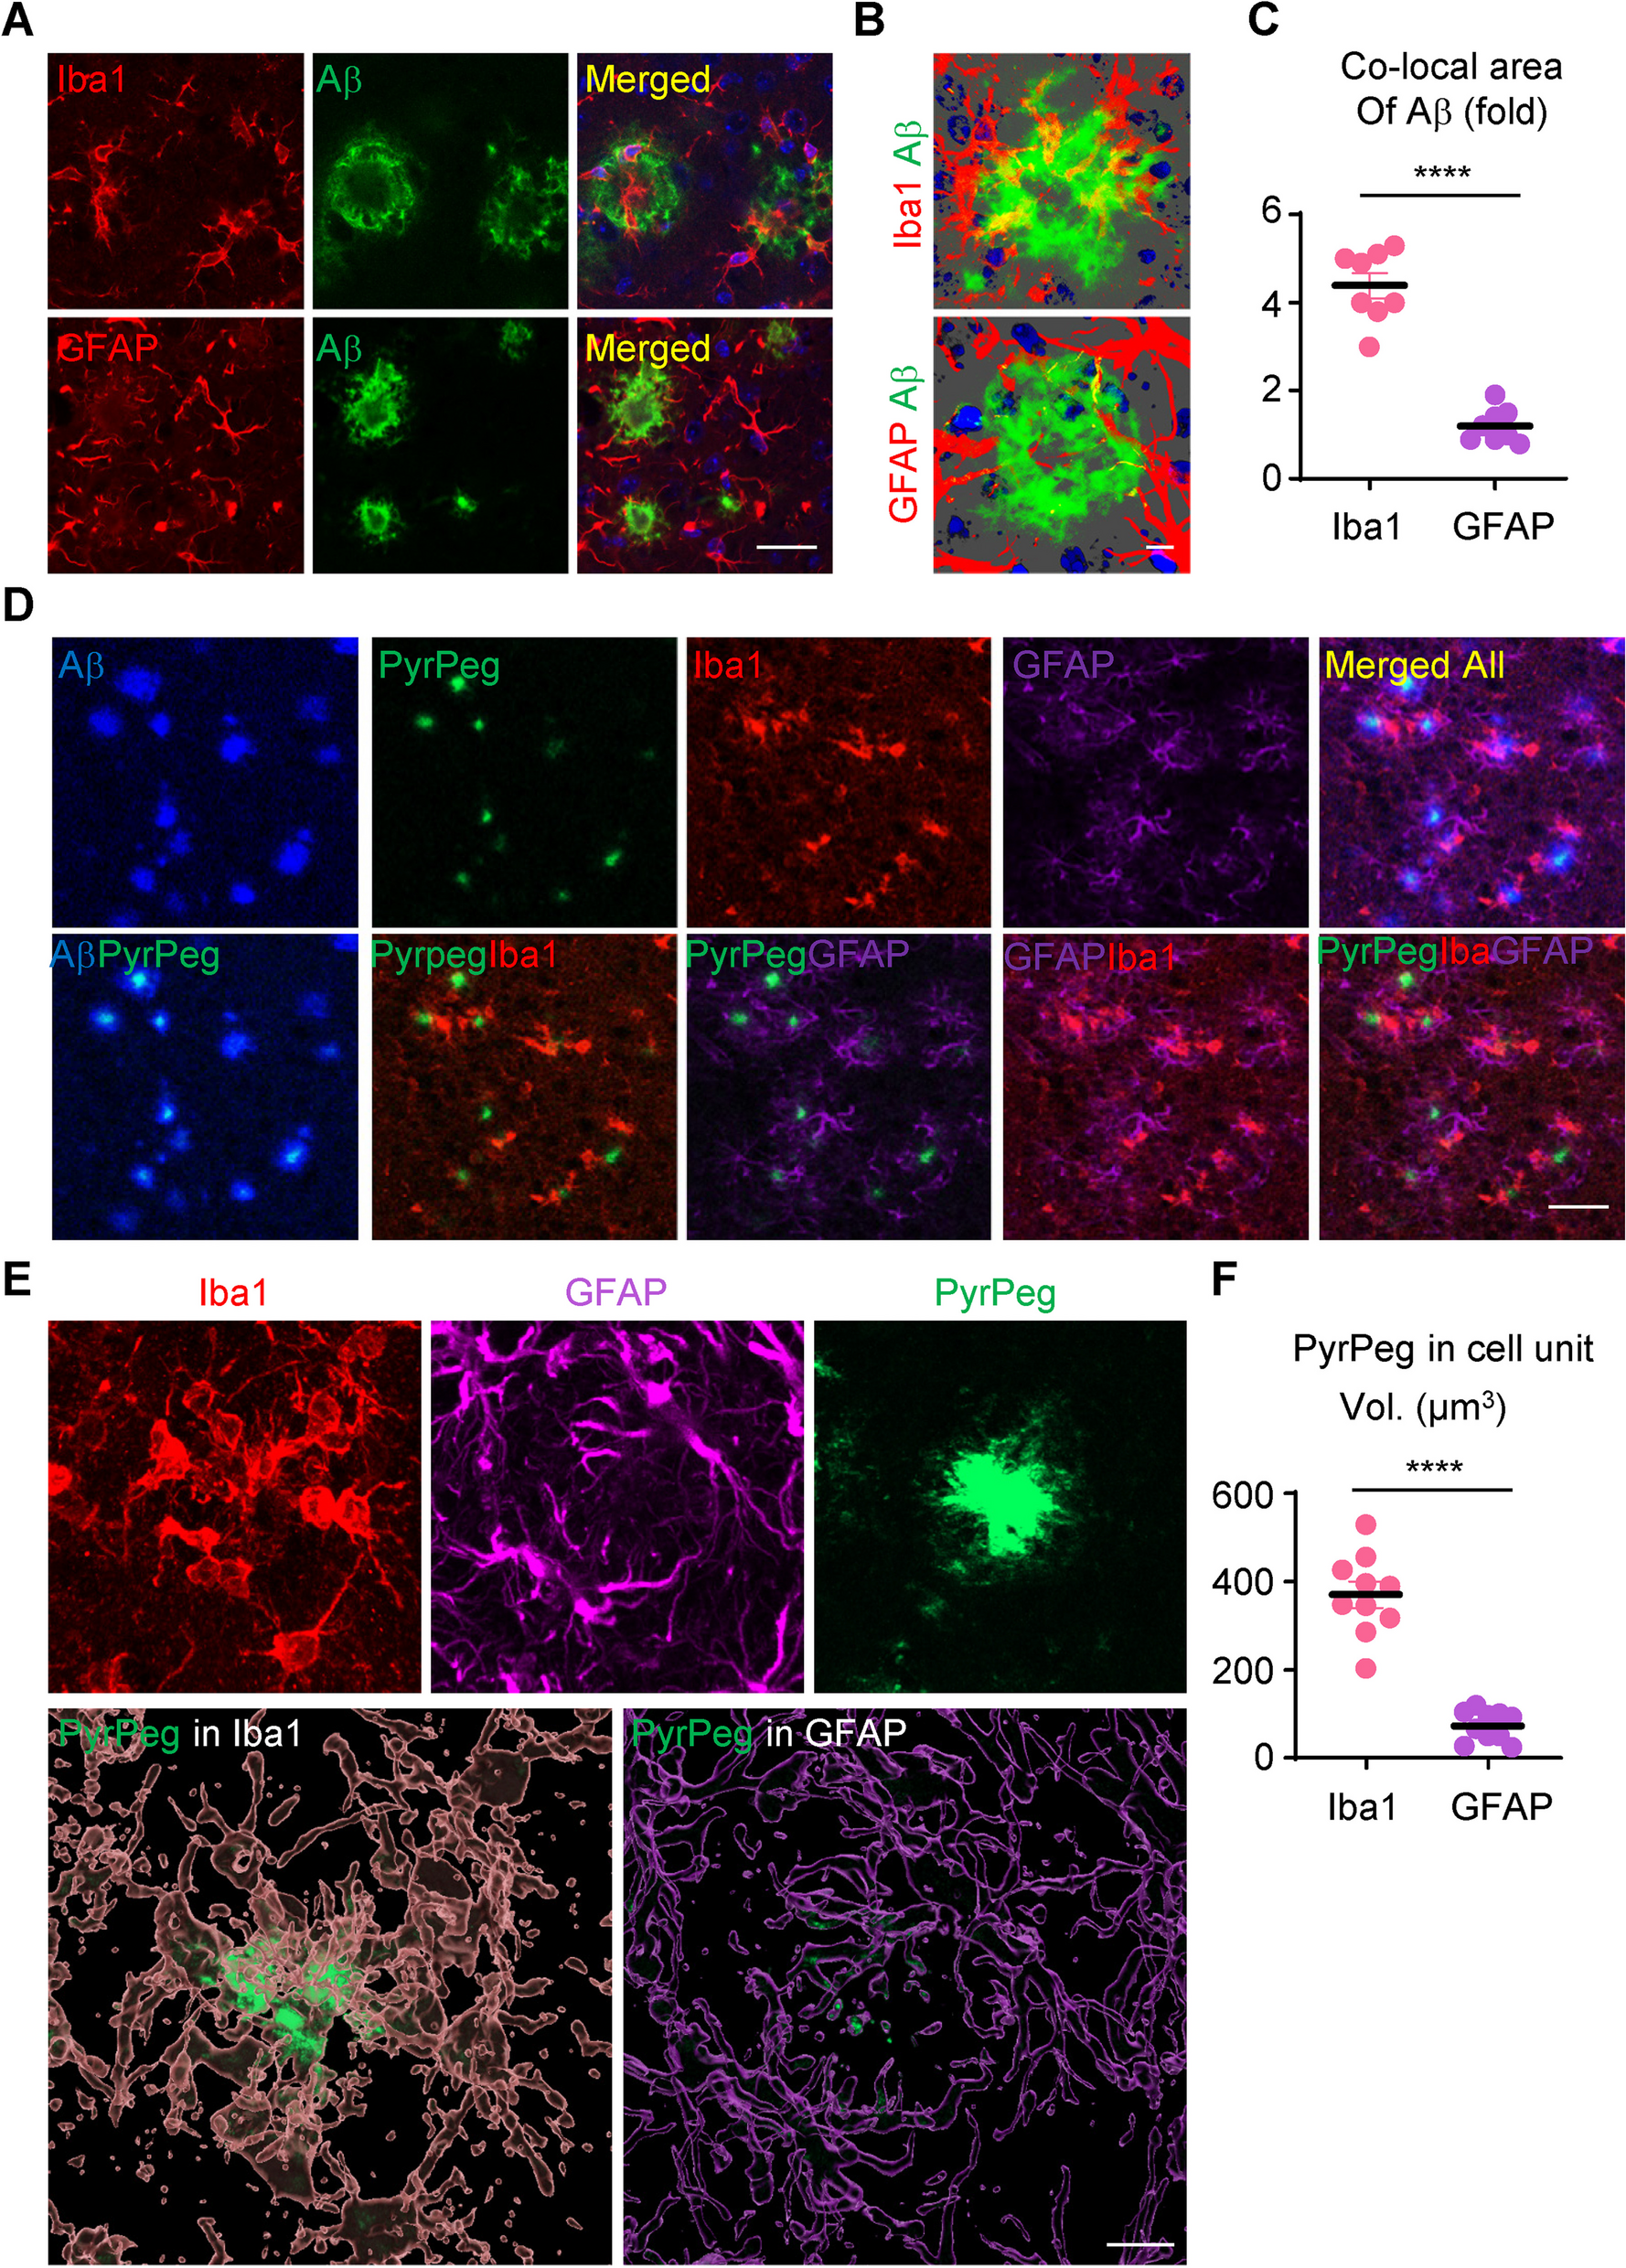
Mouse brain sections were prepared as previously described [29]. Briefly, mice were transcardially perfused with ice-cold 0.9% saline under deep anesthesia. The mice were then sacrificed, and the whole brain was quickly removed and post-fixed in 4% paraformaldehyde for 1 day and then stored in sucrose (using an increasing gradient of 10%, 20%, and then 30% sucrose). Sagittal Sects. (30 µm) were cut using a cryostat. The collected sections were saved in tissue stock solution for subsequent staining. All brain sections were blocked with 5% normal chicken serum (Vector Laboratories, Inc.) and 0.3% Triton X-100 (Sigma) in cold PBS for 1 h, followed by incubation with these primary antibodies: anti-p16ink4a antibody (1:400; catalog no. MA5-17,142, Thermo Fisher Scientific), anti-β-actin (1:500; catalog no. A5316, MilliporeSigma), anti-amyloid-β (1–42) (1:400; catalog no. ab201060, Abcam), anti-Ki67 antibody (1:200; catalog no. 15580, Abcam), anti-TREM2 antibody (1:200; catalog no. PA5-119,690, Invitrogen), anti-Clec7a antibody (1:200; catalog no. ab217331, Abcam), anti-Lamp1 antibody (1:200; catalog no. ab24170, Abcam), anti-GFAP (1:200; catalog no. MAB360, MilliporeSigma), anti-Iba1 (1:200; catalog no. 019–19741, Wako Pure Chemical Industries, Ltd.), and anti-NeuN (1:200; catalog no. 324307, Cell Signaling Technology). Sections were subsequently washed 3 times with ice-cold PBS at room temperature, followed by incubation with Alexa Fluor 568, Alexa Fluor 488, and Alexa Fluor 647 donkey anti-mouse or donkey anti-rabbit secondary antibodies for 1 h. After another 3 washes in ice-cold PBS, the sections were mounted and coverslipped with mounting solution. Nucleus staining was performed with 4′,6-diamidino-2-phenylindole. Fluorescent images were captured on an LSM 900 confocal laser microscope (Carl ZEISS AG) using 40 × oil immersion with image sizes set at 1024 × 1024 pixels. Density analysis of the captured images was performed using ImageJ software. The images were imported into ImageJ, converted to 8-bit images, and smoothed using a Gaussian filter. To quantify Aβ engulfment by microglia and astrocytes, confocal Z-stacks of mouse brain sections stained for Aβ, Iba1, and GFAP were background-subtracted and smoothed using Imaris software (Oxford Instruments). In addition, the IMARIS software was used to measure the overlapping cell volume for each cell unit and to obtain representative images.
Cellular senescence assay and 3,3′-diaminobenzidine staining
SA-β-gal staining was performed as described previously and in accordance with the manufacturer’s instructions [30]. Brain sections was incubated overnight at 37 °C without CO2 in SA-β-gal detection solution. For 3,3′-diaminobenzidine (DAB) staining, the tissues were exposed to 0.3% hydrogen peroxide in PBS for 10 min to remove endogenous peroxidase activity and then incubated in blocking solution. Next, they were treated with anti-Iba1 antibody overnight at 4 °C followed by incubation with the corresponding biotinylated secondary antibody and streptavidin peroxidase complex (Vector Laboratories, Inc.). Then, the tissues were incubated in a solution of DAB (MilliporeSigma) and hydrogen peroxide, dehydrated, and mounted on glass slides using Permount Mounting Medium (Thermo Fisher Scientific). Sections of cerebral cortex were imaged at the same region for each group using a light microscope (AX70, Olympus). To analyze the association between Iba1 staining and SA-β-gal staining, we performed co-localization analysis using the Scatter J plugin in ImageJ software. In short, the staining image to be analyzed was first divided into channels, and then the brightness values of each channel were mapped to a scatter plot. Also, co-localization analysis is possible through the calculation of the Pearson distribution coefficient provided by the plugin [31, 32].
Western blotting
Western blotting was performed as previously described [33]. BV2 cells were lysed on ice using radioimmunoprecipitation assay lysis buffer (ATTO Corporation), and the lysate was purified by centrifugation. For brain tissue, mice were killed, and 1 hemisphere was transferred to liquid nitrogen and stored at − 80 ℃. Protein extraction was performed by homogenization in cold PBS with 1% phosphatase inhibitor and 1% protease inhibitor cocktails (Thermo Fisher Scientific) using a homogenizer. Homogenates were extracted in lysis buffer and centrifuged for 20 min at 13,000 rpm. Protein concentration was measured using the Bradford assay. The samples were solubilized in 5 × sodium dodecyl sulfate buffer, boiled for 10 min at 100 °C, and loaded on 12–15% sodium dodecyl sulfate–polyacrylamide gel electrophoresis gels for protein gel electrophoresis. A pre-stained protein standard was used to determine molecular weights. Following electrophoresis, the samples were transferred to nitrocellulose membranes. Nitrocellulose membranes were blocked in 5% non-fat skim milk powder in 1 × Tris-buffered saline with 0.05% Tween 20. The following proteins were analyzed by incubation with primary antibodies. The target proteins were then detected using a chemiluminescent horseradish peroxidase substrate (Thermo Fisher Scientific).
Quantitative Real-Time PCR
For the RNA extraction assay, BV2 cells were stabilized by seeding 2 × 10^6 cells per well on a dish. The BV2 cells were transfected with p16ink4a siRNA (100 nM) or scrambled (sc) siRNA (100 nM). Lipofectamine 2000 reagent (Thermo Fisher Scientific, Cleveland, OH, USA) was used to transfect the cells according to the manufacturer’s instructions. For tissue, mouse cortex brain was harvested, and the tissue were extracted by homogenizing. Total RNA was isolated using TRIzol reagent following the manufacturer’s protocol (GeneAll, RoboExTM, Thermo Fisher Scientific, Waltham, MA, USA). RNA quantification was performed using a NanoDrop spectrometer (Thermo Fisher Scientific, Waltham, MA, USA). Subsequently, cDNA was prepared from the total RNA using a kit (ENzynomics, Daejeon, Republic of Korea). To determine mRNA levels, qRT-PCR was conducted using the AriaMx Real-Time PCR system, with the expression of GAPDH serving as an internal control. The primers used for PCR were p16ink4a (5’-CCCAACGCCCCGAACT-3’;5-GCAGAAGAGCTGCTACGTGAA-3’), p21 (5-GCAGATCCACAGCGATATCCA-3’; 5-AACAGGTCGGACATCACCAG-3’), IL6 (5-TGAGAAAAGAGTTGTGCAATGG-3’; 5-GGTACTCCAGAAGACCAGAGG-3’), IL1α (5-AGGGAGTCAACTCATTGGCG-3’; 5-TGGCAGAACTGTAGTCTTCGT-3’), IL1β (5-TGCCACCTTTTGACAGTGATG-3’; 5-TGATGTGCTGCTGCGAGATT-3’), Timp1 (5-CACACCAGAGCAGATACCATGA-3’; 5-GGGGAACCCATGAATTTAGCC-3’), Mmp3 (5-GTTGGAGAACATGGAGACTTTGT-3’; 5-CAAGTTCATGAGCAGCAACCA-3’), Mmp12 (5-TGCACTCTGCTGAAAGGAGTCT-3’; 5-GTCATTGGAATTCTGTCCTTTCCA3’), Cxcl1 (5-ACCGAAGTCATAGCCACACTC-3’; 5-CTCCGTTACTTGGGGACACC-3’), Cxcl2 (5’-CCAGACAGAAGTCATAGCCAC-3’; 5-TGGTTCTTCCGTTGAGGGAC-3’), Ccl8 (5-CGGGTGCTGAAAAGCTACGA-3’; 5-TTGGTCTGGAAAACCACAGCTT-3’) and GAPDH (5-CCCTTAAGAGGGATGCTGCC-3’; 5-TACGGCCAAATCCGTTCACA-3’). The ∆∆Ct method was employed to assess age-dependent gene expression changes, normalizing the Ct values of each sample to a reference gene expression. Amplification of the template was deemed undetectable beyond a threshold of 35 cycles. The minimum expression fold changes for the other age groups were then calculated relative to this threshold.
Amyloid beta 42 Mouse ELISA assay
Frozen mouse forebrain samples were homogenate as previously described. Samples were centrifuged at 13,000 RPM for 20 min at 4 °C. The supernatant was collected for ELISA. Aβ 1–42 (Thermo Fisher Scientific, Ca # KMB3441) ELISAs were performed according to the manufacturer’s instructions [34]. Aβ 1–42 was measured using Sunrise microplate reader (Tecan Group Ltd.) at 450 nm.
Poly (D,L-lactic-co-glycolic acid) nanoparticle production and characterization
All reagents and solvents were of analytical grade. The PLGA (Purasorb® PDLG 5002A, Corbion N.V.) NPs were prepared with minor modifications, as previously reported [35]. All types of PLGA NPs were purchased from Nanoglia (Daejeon, Republic of Korea) [25]. To prepare the siRNA-encapsulated PLGA NPs, 20 μmol of each siRNA (Invitrogen; Ca# 53,640, The sequence of p16ink4a siRNA as follow; sense 5’-GGUGAUGAUGAUGGGCAACtt-3’, antisense 5’-GUUGCCCAUCAUCACCtg-3’) in 200 μL autoclaved distilled water was added dropwise to 0.8 mL dichloromethane containing 2.5 mg PLGA and emulsified by sonication (10% of maximum frequency for 30 s; SFX 550, Branson Ultrasonics) to form a primary W1/O emulsion. Next, 2 mL 1% (w/v) PVA1500 (Alfa Aesar) was added, and the mixture was further emulsified by sonication for 1 min to form a W1/O/W2 double emulsion. Then, 6 mL 1% (w/v) PVA1500 was added, and the dichloromethane was evaporated by magnetic stirring for 3 h at room temperature in a fume hood. Finally, the PLGA NPs were collected by centrifugation at 13,000 rpm for 10 min at 4 °C, washed twice with deionized water, and freeze-dried [21, 36].
PLGA-rhodamine conjugated NPs were prepared by mixing PLGA and PLGA-rhodamine B endcapping (AV027, PolySciTech, Akina, Inc.). Nanoparticles were manufactured by mixing two types of polymers in a ratio of 9 to 1. AAV-GFP-encapsulated PLGA NPs were prepared by mixing 100 µg AAV-GFP plasmid and PLGA NPs. The NPs were diluted in double-distilled water to analyze their size and zeta potential by a dynamic light-scattering assay using the Zetasizer Nano ZS90 (Malvern Instruments), as previously described [23]. Scanning electron micrographs of the NPs were obtained with a scanning electron microscope (SNE-4500 M, SEC Co. Ltd.).
siRNA loading efficiency and release assay
The siRNA loading efficiency was measured using 5 mg/mL NP powder in dimethyl sulfoxide. Loading efficiency (%) = (released siRNA after complete hydrolysis/total amount of NPs) × 100. The siRNA release assay was performed by incubation of NP powder loaded with siRNA in 250 µL PBS. The supernatant was collected continuously for 5 days, and the siRNA concentration was calculated using a Nanodrop spectrometer (Thermo Fisher Scientific).
BV2 cell culture, transfection and cell viability assay
The BV2 immortalized murine microglial cell line was received from Dr. Eun-Hye Joe of Ajou University School of Medicine, Suwon, Republic of Korea [4]. BV2 cells were grown in Dulbecco’s modified Eagle medium with 10% fetal bovine serum. For siRNA transfection, BV2 cells were plated in 6-well plates and cultured to approximately 60% confluency when cells were added. BV2 cells were transfected with p16ink4a or scrambled siRNA with Lipofectamine 2000 (Thermo Fisher Scientific) in accordance with the manufacturer’s instructions. To determine the cytotoxicity of siRNA-encapsulated PLGA NPs, cell viability was measured using the EZ-Cytox cell viability assay kit (Daeil Lab Service Co. Ltd.) in accordance with the manufacturer’s instructions. Cell viability was quantified by measuring the absorbance at 540 nm using a Sunrise microplate reader (Tecan Group Ltd.).
Phagocytosis assay and fluorescence-activated cell sorting
Aβ (1–42)-conjugated pHrodo was a gift from Dr. Won-Suk Chung of the Korea Advanced Institute of Science and Technology, Republic of Korea. BV2 cells were treated with Aβ-pHrodo for 3 h. To visualize lysosomes in live cells, BV2 cells were stained with 0.5 µM LysoTracker Green DND-26 (Thermo Fisher Scientific) for 3 h at 37 °C in a humidified 5% CO2 incubator. Live cell imaging was performed with an LSM 900 confocal laser scanning microscope.
BV2 cells were transfected with p16ink4a or scrambled siRNA for 48 h. To measure phagocytosis by fluorescence microscopy, BV2 cells were treated with 0.1 mg/mL pHrodo Red Zymosan Bioparticles Conjugate (P35364, Thermo Fisher Scientific) for 3 h. BV2 cells were washed briefly in PBS and then nuclear DNA was labeled with 4′,6-diamidino-2-phenylindole. For FACS analysis, the cells were stained with the pHrodo bioparticle conjugates for 3 h, washed in PBS, and briefly trypsinized to detach the cells. BV2 cells were then resuspended in 300 µL PBS, and FACS analysis was performed using a BD FACSCanto II flow cytometer (BD Biosciences). Apoptosis was measured by flow cytometry using the EzWay Annexin V-FITC Apoptosis Detection Kit (K29100, Koma Biotech) in accordance with the manufacturer’s instructions. Briefly, the cells were dissociated with trypsin, fixed in 4% paraformaldehyde at − 20 °C, and propidium iodide was used to determine the cell cycle distribution. After staining with annexin V-FITC, the cellular DNA content was evaluated on a BD FACSCanto II flow cytometer. For BrdU labeling and detection, BV2 cells were treated with 10 μM BrdU for 3 h. The existing culture medium was then removed and replaced with new culture medium for a 1-day incubation period. After that fix and permeabilized cells according to standard immunocytocyemistry with anti-BrdU antibody (1:200; catalog no. ab220076, Abcam).
Data acquisition and bioinformatics analysis
We searched the Gene Expression Omnibus (https://www.ncbi.nlm.nih.gov/geo/) and GTEx Portal (https://gtexportal.org/) to investigate transcriptomic alterations in the aged brain. First, we gratefully downloaded the RNAseq data set GSE205803, which the authors gladly provided [37]. Briefly, the authors treated enriched microglia isolated from young mice (young group, < 3 months old, n = 4) and aged mice (old group, > 18 months old, n = 4) with 2.5 μM fluorescently labeled Aβ (1–42) for 2 h. The microglia were divided into 2 groups by FACS (those that took up Aβ42 and those that did not) and were subjected to bulk RNA sequencing [37]. The downloaded data values were already normalized as transcripts per million (TPM), and we compared the gene expression of Aβ42-positive microglia obtained from the young and old groups using t tests. Gene ontology enrichment analyses were performed with significantly altered genes with P values less than 0.01 using PANTHER (version 16.0) [38]. The genes classified as replicative senescence, GO0090399, were depicted using Z-scores transformed from TPM scales. Second, we downloaded the subject phenotypes and gene TPM V8 data of brain tissues from the GTEx Portal. CDKN2A expression was classified in accordance with brain anatomy and compared by subject age using the Kruskal–Wallis test and the Dunn multiple comparisons test by GraphPad Prism.
Illustrations
Illustrations were generated using Biorender (http://www.biorender.com).
Statistical analysis
Statistical analyses were performed with GraphPad Prism version 9.0. The statistical differences between 2 groups were determined by unpaired Student’s t tests. Data were analyzed by repeated measures 1-way analysis of variance (ANOVA) with post hoc Bonferroni tests or by repeated measures 2-way ANOVA with Tukey multiple comparison tests. All data are expressed as mean ± standard error of the mean (SEM). A value of p < 0.05 was considered to be statistically significant (Suppl. Table 1).


留言 (0)