
記住我
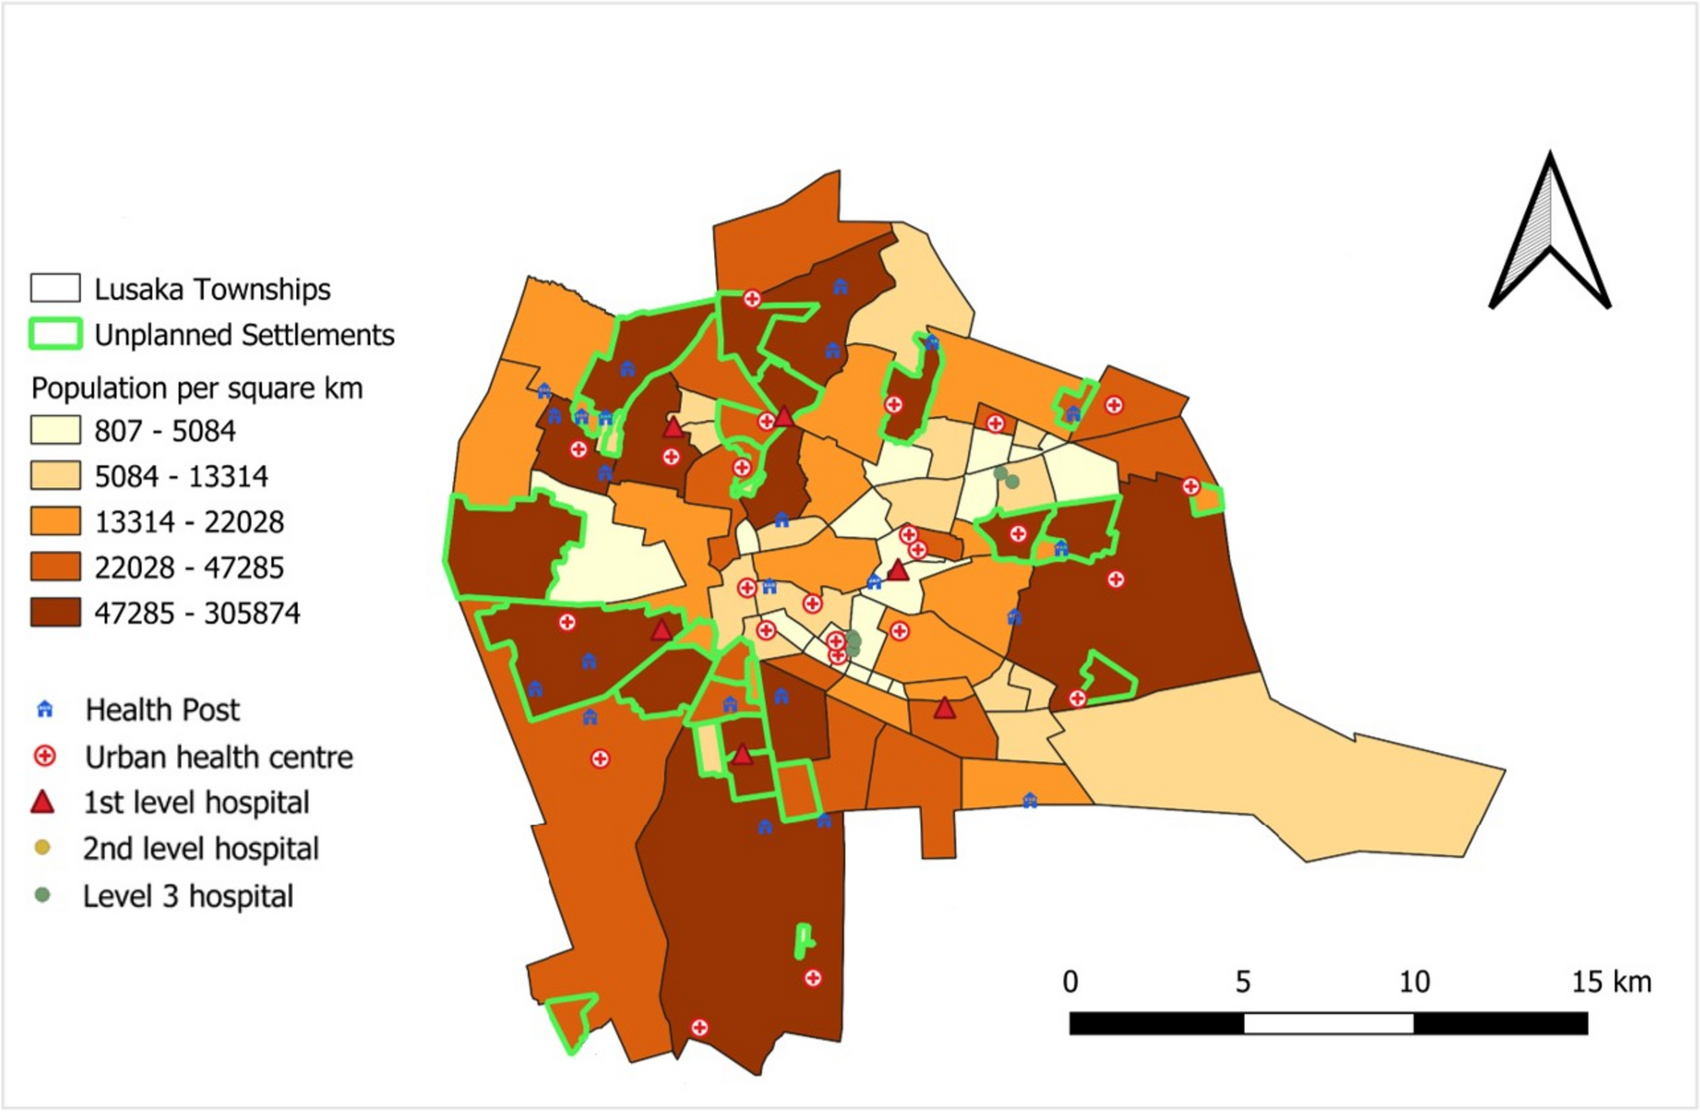
To answer the first objective, we used our data to create a map with unplanned settlement locations and population densities (Fig. 1). The majority of unplanned settlements are serviced by health posts or urban health centers (both primary level) and first-level hospitals. However, no second- or third-level hospitals are located in unplanned settlements.
Fig. 1
Map of Lusaka City with township population densities, location of unplanned settlements and health facilities by level
Based on current HMIS records, approximately 164 health facilities exist in Lusaka, with about 77 government/public facilities and 87 private facilities. Just over 50% of the city’s public facilities, and 3% of its private ones, are located in unplanned settlements, with the rest in planned settlements. Both public and private facilities provide MNH services, although the share of government facilities providing such services is greater than the share of private facilities that offer them (see ZDHS results below). Of the private facilities that provide MNH services, just under two-thirds are primary centers or clinics (with varying capabilities), and over a third are hospitals.
Public health facilities in Lusaka can be categorized into five different types, including health posts, urban health centers, and first-, second-, and third-level hospitals. Lusaka has 32 health posts (also called clinics clinics) that are government run, 18 of which are in unplanned settlements (Fig. 2). These facilities offer promotional and preventive health services, each serving around 7000 or more people. About 36% of the 77 government-owned health facilities falling under the categorization of urban health centers (also termed “primary health centers”). These centers cater to catchment populations of between 30,000 and 50,000 people.
Fig. 2
Number of public/government facilities (out of 77 total) by level and catchment area in Lusaka, HMIS 2021
Nine of the 77 government-owned facilities are first-level (or district-level) hospitals. They are meant to serve around 400,000 people, though sometimes they serve more (78% of these are found in unplanned settlements). Second-level hospitals provide curative care and serve catchment populations of between 200,000 and 800,000 people. Only two government-owned health facilities are second-level hospitals. Tertiary or third-level hospitals provide the most specialized care. Lusaka has six government-owned third-level hospitals, with two offering advanced MNH services to the entire city.
The 2017 ZNHFC was conducted in 62 Lusaka public health facilities. It shows that ANC services (including hemoglobin tests, urine tests, and tetanus toxoid injections) were offered at most health posts and all urban health centers, first- and second-level hospitals, and at third-level hospitals. Institutional delivery was offered at a fifth of health centers, with those facilities providing basic emergency obstetric and newborn care (BEmONC) services, including injectable antibiotics, oxytocic drugs, manual removal of the placental and retained products of conception, assisted vaginal delivery, and neonatal resuscitation. Most first-, second-, and third-level public hospitals also conducted delivery services, with all reporting the ability to conduct BEmONC as well as C-sections and blood tranfusions (comprehensive emergency obstetric and newborn care, or CEmONC).
For referral pathways, urban health centers providing BEmONC refer to first-level hospitals for ANC and delivery care in cases of complications identified earlier during pregnancy (e.g., premature rupture of membrane, bleeding); after 34 weeks gestation (e.g., malpresentation, under age 16, contracted pelvis, fetal distress, obstructed labor); or postpartum (e.g., puerperal sepsis, postpartum hemorrhage) [24]. Second- and third-level hospitals receive referrals from urban health centers or first-level hospitals for specialized care, such as for women with pre-existing medical conditions, pre-eclampsia/eclampsia with other complications, placenta abnormalities, hemorrhage, or premature labor when detected. Newborns are also to be referred when adverse health conditions or delivery complications arise, from urban health centers to first-level hospitals, or first level to second and third levels depending on severity [24].
For the study’s second objective, we used ZDHS to compare trends and inequalities in MNH intervention coverage and mortality between women living in the poorer 60% (approximating those in unplanned settlements) and richer 40% (approximating those in planned settlements) of households in Lusaka from 2001 to 2018. Any ANC became nearly universal among pregnant women within Lusaka (over 97% for all areas in 2018). By 2018, the use of ANC was higher at public than private facilities (though slightly higher in the latter among the richer). Among the poorer 60%, about 74% received any ANC at a public health center and 21% at a public hospital, compared to 1% at a private hospital/clinic and 3% at a mission hospital/clinic. Among the richer 40%, about 56% received any ANC at a public health center, 30% at a public hospital, 7% at private hospital/clinic, and 2% at a mission hospital/clinic.
Coverages of early and four or more ANC visits, institutional delivery, and C-sections among the poorer 60% and richer 40% are presented in Fig. 3. Estimates and confidence intervals are provided in Supplementary Table 1. Coverage of four or more ANC visits (ANC4) in both wealth classifications was substantially lower than any ANC, and improved for women residing in richer areas from 2007 to 2018. This caused the gap between poorer and richer to widen from 7.6 percentage points (pp) to 16.2 pp or a ratio of 1.2 to 1.3 between 2007 and 2018. Data in 2001 showed unrealistically high coverage (and was excluded), suggesting the way ANC4 was measured changed after that year. Early ANC (before 4 weeks gestation) increased somewhat among women from both poorer and richer areas. Inequalities reduced somewhat between the poorer 60% and richer 40%, from a rate difference of 12.3 to 7.5 points, or a ratio of 1.7 to 1.3, respectively between the 2001 and 2018 ZDHS. Still, coverage of early ANC remained low at below 35% for both groups.
Fig. 3
Intervention coverage for ANC, institutional delivery, and C-sections comparing women in the poorer 60% and richer 40% areas of Lusaka, ZDHS surveys 2001, 2007, 2013, 2018
Regarding institutional deliveries, higher coverage was observed among women from both poorer and richer areas between 2001 and 2018 ZDHS. Although institutional delivery coverage has been lower among women from poorer than richer areas, it rose slightly faster from ZDHS 2001 to 2018 among the poorer (78 to 91% respectively) compared to the richer (87 to 97%). Looking at type of facility where women gave birth in 2018 ZDHS, around 44% of those in the poorest 60% gave birth at a public health center and 42% at a public hospital (and less than 2% at a health post), versus 0.5% at a private hospital/clinic and 3% at a mission hospital/clinic. Among women from the 40% richer group in 2018, 33% delivered at a public health center, 56% at a public hospital, and 6% at a private hospital/clinic (and less than 1% at a mission hospital/clinic or government health post).
Coverage of C-sections was lower among women from the poorer than the richer areas across all survey periods. Rates started low at around 4.8% in both groups in 2001. The rate increased among women from richer areas to 12.5%, or within the evidence-based range of meeting the need (10–15%) recommended by the World Health Organization (WHO) [25, 26], while staying too low at 5.6% among the poorer group in 2018. ZDHS did not provide information on C-section rates by sector or whether the procedures were elective or emergency.
Neonatal mortality rates appeared to decline both among women from poorer areas and richer ones, with the gap between them closing due to a greater decline among the poorer (Fig. 4). However, confidence intervals were wide, particularly for the richer group (among whom there were fewer births). Declines in deaths among children under age 5 also appeared to be faster among those living in poorer than richer areas, which had more stable estimates. This consistent pattern may indicate a true improvement in the NMR for the poorer group, although the rate was still 7 units higher among the poorer compared with the richer in 2018 (32 versus 25 per 1000 live births, respectively).
Fig. 4
Neonatal and under-5 mortality rates per 1000 live births (average among births in the last ten years) comparing the poorer 60% and richer 40% with confidence intervals (95% CI), ZDHS 2007 and 2018
Using HMIS data from 2018 to 2021, we examined current MNH service volumes and rates in Lusaka. Government facilities with sufficient HMIS data on MNH services included 34 primary care facilities (urban health centers, posts, or clinics), of which 22 largely served unplanned settlements and 12 primarily planned settlements. Data were used from 12 government hospitals (six first-level hospitals in the unplanned, and two second level, two third level in addition to two police/army hospitals in the planned). Private facilities included 13 primary care facilities or clinics in planned settlements and one in unplanned ones, and 14 hospitals serving the planned settlements.
The highest numbers of ANC1 visits occurred in public facilities, and particularly those serving unplanned settlements (including primary health centers, clinics, and first-level hospitals) (Fig. 5). Coverage rates of ANC4 to ANC1 were around 70% and 80%, respectively, in facilities serving unplanned settlements. For institutional deliveries, hospitals provided much higher volumes than clinics or primary care facilities, including the hospitals serving unplanned settlements (all first level). The ratio of institutional deliveries to ANC1 visits was higher in hospitals than primary care facilities, as women are often referred to give birth in hospitals even if they attended ANC visits at a primary facility.
Fig. 5
Total (summed) service volumes for ANC1, ANC4, and institutional delivery in public and private facilities by level and catchment area, HMIS 2018 to 2021
As expected, all MNH service volumes were much lower in private facilities (which also mainly served planned settlements). The proportion of ANC4 to ANC1 was just over 1 in private hospitals, and around 80% in primary health centers or clinics. This suggests that many women only attended their later ANC check-ups at hospitals, and went to a lower-level private or any public facility for ANC1. The ratio of institutional deliveries to ANC1 was over 1 in public hospitals, but below 1 at public clinics/primary centers as well as all private facilities, which suggests that more women rely on delivery than antenatal care at public hospitals.
Looking at institutional C-section rates between 2018 and 2021 (Fig. 6), rates were lowest in hospitals directly serving unplanned settlements (6.4%). Hospitals located in planned settlements had much higher rates (29% at second level and 40% at third level). Although there are fewer of them, these are larger hospitals conducting the highest volumes of C-sections. Private facilities conducting C-sections were located only in planned settlements. They had lower C-section volumes than the public sector but appeared to have similarly high rates of C-sections as the public second- and third-level hospitals. Primary health centers and public clinics do not provide C-sections.
Fig. 6
Institutional C-section rates in public and private hospitals or clinics located in unplanned or planned settlements, HMIS 2018 to 2021
留言 (0)