Data Sources
Geospatial data encompassing regional, departmental, commune, and neighborhood boundaries in shapefile format were obtained from national specialized directorates such as the Direction des Travaux Géographiques et Cartographiques (DTGC), within the Ministry of Equipment and Transport; the National Agency for Spatial Planning; and the National Agency for Statistics and Demography. These cartographic resources were complemented by satellite imagery data, employed for the identification of slum areas within urban regions of the Dakar area through the Google Earth platform. The definition of slums in this study refers to areas or neighborhoods characterized by irregular, poorly developed, and precarious housing, occupied by poor populations. This type of poorly developed and informal housing represents about 30% of the inhabited areas in Dakar [16]. We also used data from the Ministry of Urban Planning, Housing and Living Environment, the national report “Cities without Slums of 2010,” a UN-Habitat report on the urban profile of Dakar of 2008 and the work of Borderon et al [17]. All these data were used to map the Dakar region and its slums.
C-section deliveries data for 2019 were obtained from the National Health Information System (NHIS) from the DHIS2 platform. These statistics are available at the district and public health facility levels.
Data used for the estimation of C-section rates over time and the determination of the associated factors were carried out within Standard (2005, 2011, and 2017) and continuous (2014, 2017, and 2019) Senegal Demographic and Health Survey (DHS) data. These data were obtained from Measure DHS program (https://dhsprogram.com/) after an approval request [36].
Study Population
The study population comprised urban women of reproductive age residing in the identified slums in urban areas of the Dakar region. In order to examine C-section rates over time and associated factors, the study population was the subpopulation of women of childbearing age residing in urban areas of Dakar who delivered in a health facility. All the deliveries from the last 5 years before the survey was considered. Geospatial analyses were carried out to highlight the geographical location of health facilities delivering C-section according to the spatial distribution of slums housing poor pregnant women.
Primary Outcome
The dependent variable in this study was the mode of delivery, defined as C-section delivery or normal vaginal delivery. The primary focus of the analysis of DHS data was C-section delivery among women living in urban areas of the Dakar region who delivered in a health facility. While in the geospatial analysis using DHIS2 data, the primary endpoint was the rate of C-section among women of reproductive age who live in the slums of urban areas in the Dakar region.
Secondary Outcome
Emergency and elective C-section rates were also estimated to investigate the level of each type of C-section in Dakar. The type of C-section was captured based on the procedure’s timing; such data were collected only in the 2017 and 2019 DHS. The estimated rates of each type of C-section were determined by combining the two periods. An emergency C-section was defined as any procedure carried out after the delivery labor would have started, while elective C-section was defined as any procedure carried out before the onset of labor.
Covariates
A set of covariates were considered for the multivariate analysis to determine factors associated with C-section uptake in the urban areas of the Dakar region using DHS data. The main covariate was the household wealth tertile index, determined from a composite indicator (including household assets such as television, radio, telephone, and air conditioner, and types of housing construction materials) based on multiple correspondence analysis. This continuous indicator was categorized into tertiles of three near-equal size groups ranked in ascending order: poor, medium, and rich. The other socioeconomic covariate considered was mother’s education level, categorized as none, primary, secondary, and higher. Sociodemographic covariates included mothers’ age group (15–24, 25–29, 30–39, and 40–49 years old) and marital status (married or single). Other control variables such as number of prenatal visits (none, 1–4, 8 and more), birth order (1, 2–3, 4 and more), type of health facility delivery (public or private), and finally the year of the survey (2005, 2011, 2014, 2017, and 2019).
Data AnalysisGeospatial Analysis
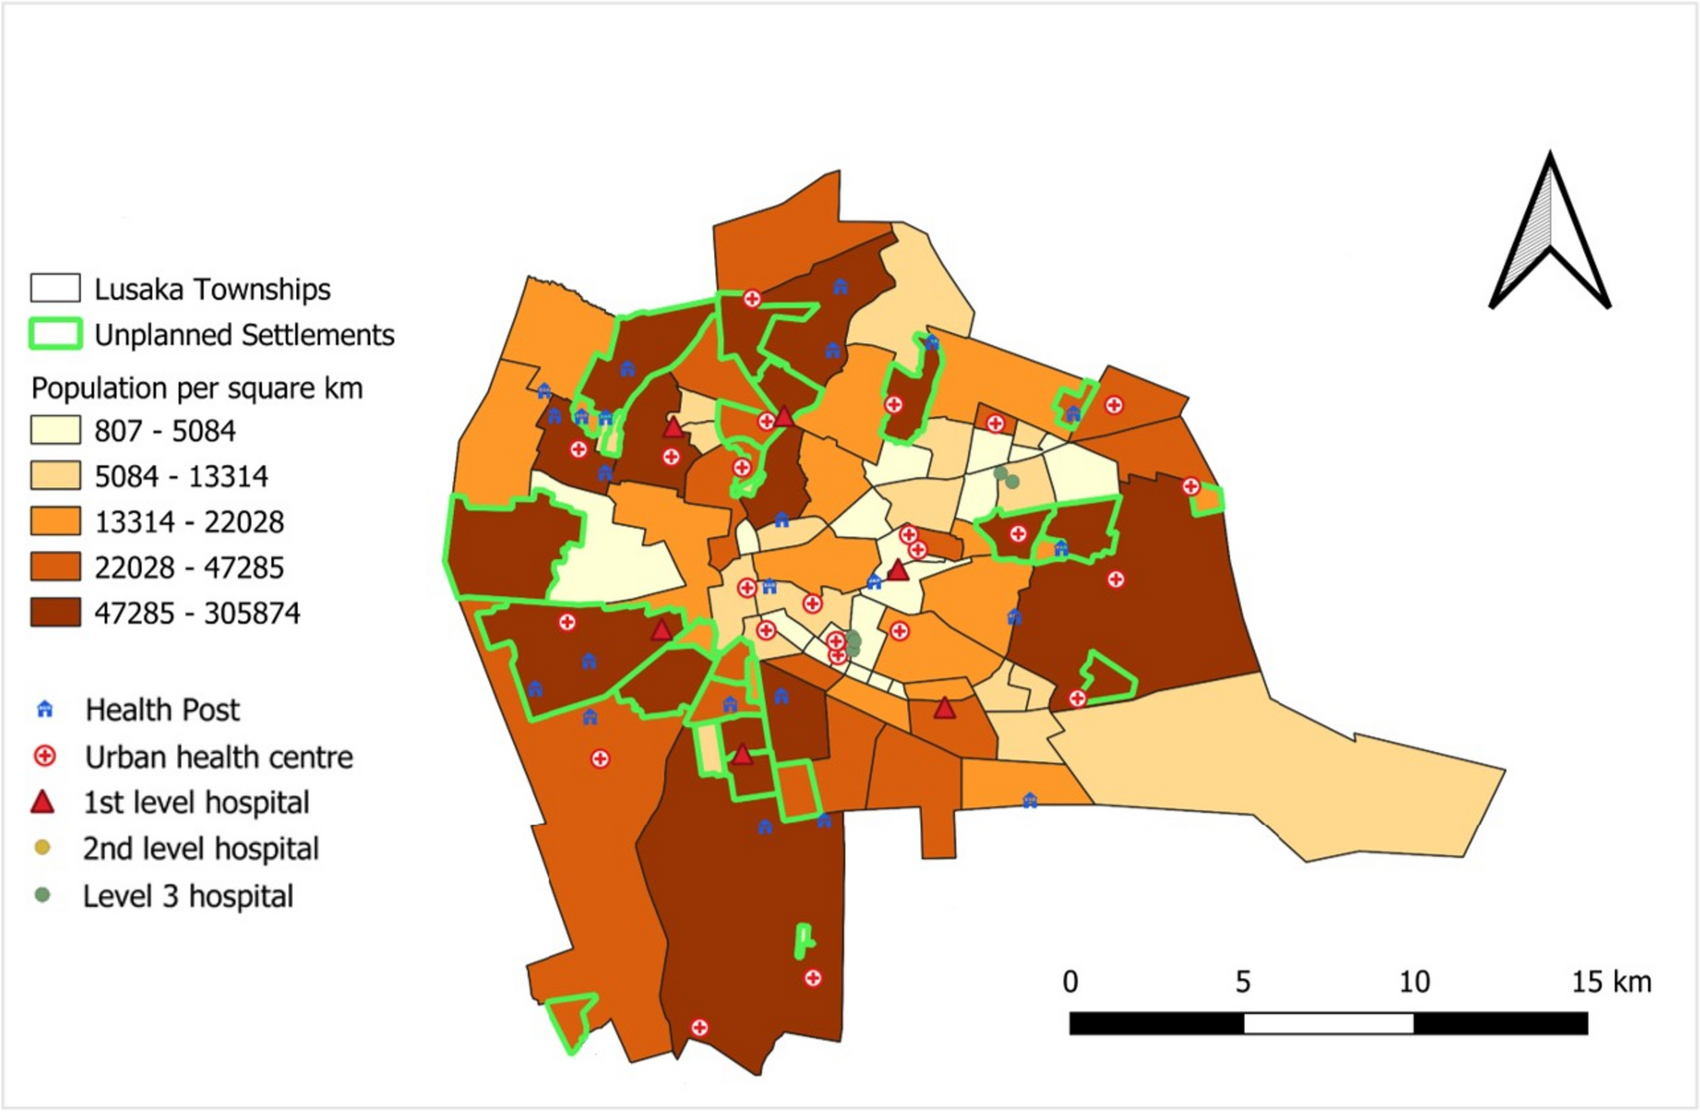
Geospatial analyses involving geographic, sociodemographic, and health data were conducted using ArcGis and Qgis software. These analyses served several purposes including identification of slums and the health facilities offering C-sections and assessing geographical accessibility to Comprehensive emergency obstetric and Newborn Care (CEmONC) services according to the distance-reference tool of less than 2 km. Then, the C-section rate for 2019 was calculated in relation to all births recorded in health facilities providing this service, and the characteristics of the population living in the respective slums were identified by overlaying three layers of geographic information (slum location, population densities, and wealth level) with the goal of estimating the economic welfare of the populations. Using the Google Earth platform, we delimited the slums and their locations using criteria such as the type of buildings, building density, and names taken from the literature. Finally, indicators of C-section use were mapped at both the health facility and health district levels.
Statistical Analysis
C-section rates were calculated for each respective period, along with their corresponding 95% confidence intervals (95% CI) and then stratified according to the study covariates. The dataset for all time periods considered was then pooled for explanatory factor analysis using simple (to estimate unadjusted odds ratio (OR)) and multivariate (to estimate adjusted OR (aOR)) logistic regression. In the multivariate analyses, the main independent variables were wealth tertile and mother’s level of education. Then, multi-collinearity was checked among other variables to include only independent variables, while ensuring the main independent variables in the models. All analyses were weighted. Stata software version 15.1 [37], in particular the “svyest” module that takes into account the survey weights, was used for all statistical analyses.

留言 (0)