
記住我

This prospective single-center study was approved by the cantonal ethics committee. The study was in accordance with the principles of Good Clinical Practice, the Declaration of Helsinki, and other Swiss regulations. For the cadaver, the permission for scientific use existed. All participating patients gave their written informed consent prior to inclusion.
Instrumented cadaverOne intact torso with instrumented lumbar pedicle screws was used for optimization of CT parameters. With the experience from our previous study [https://doi.org/10.1007/s00330-021-07824-x], a tin-filtered low-dose CT protocol for the instrumented spine was established, which was applied to all participants.
Study participantsPatients (male and female) aged 18 years or older with metal implants of the lumbar spine and a clinically indicated CT examination of the lumbar spine at Balgrist University Hospital were prospectively included. Exclusion criteria were tumor or pregnancy. The study comprised the period January 2021 to September 2021.
CT imaging techniqueThe clinically indicated non-contrast standard CT without tin filtration of the instrumented lumbar spine was performed on a 128-slice CT scanner (SOMATOM Edge Plus, Siemens Healthineers, Erlangen, Germany). For all standard CT scans automated tube current modulation (CARE Dose4D, reference 250 mAs) was activated, tube voltage was set to 120 kV and further parameters were a collimation width of 0.6 mm, a rotation time of 1 s and a pitch of 0.8.
Immediately following the standard CT, all study participants were additionally scanned over the identical coverage in z-axis with the non-contrast tin-filtered low-dose CT protocol on the same CT machine. Parameters of the tin-filtered LD-CT scan protocol were: fixed tube voltage (Sn 140 kV), active automated tube current modulation (CARE Dose4D, reference 250 mAs), a collimation width of 0.6 mm, a rotation time of 1 s and a pitch of 0.8.
Image reconstructionFor both, the standard CT and the tin-filtered low-dose CT, image reconstruction in bone kernel (Br 57) was performed in the following planes: axial (2 mm), coronal (3 mm) and sagittal (3 mm). Furthermore, axial images with a 1-mm section thickness were reconstructed in soft tissue kernel (Br 38) for both datasets. For all image reconstructions advanced modeled iterative reconstruction (ADMIRE) strength level 3 was used. Reconstructed images in bone kernel (Br 57) of both the standard CT and the tin-filtered LD-CT were displayed with a window width of 2500 HU and a window level of 600 HU, while the window width and level of images in soft tissue kernel (Br 38) were set to 400 HU and 60 HU, respectively.
CT image interpretationStandard CT and tin-filtered low-dose CT images were anonymized and interpreted independently by a fellowship-trained musculoskeletal radiologist [C.S. (reader 1)] with 9 years of experience and a fellowship-trained orthopedic spine surgeon [F.W. (reader 2)] with 10 years of experience. Image display and interpretation was in random order on a PACS workstation. Readers were blinded to each other and were blinded to clinical information and imaging results.
Qualitative image analysisOn a 4-point Likert scale, reader 1 and 2 rated independently the depiction of anatomy (1 = poor, 2 = fair, 3 = moderate, 4 = good), image noise (1 = very high, 2 = high, 3 = moderate, 4 = minimal) and image artifacts (1 = very strong, 2 = strong, 3 = moderate, 4 = weak) for standard CT and tin-filtered LD-CT, respectively. The exact definition of each category is listed in supplementary table 1.
Quantitative image analysisThe volume CT dose index (CTDIvol), dose length product (DLP), tube voltage (kV) and tube current–time product (mAs) were available for every examination and were extracted from the dose report of the standard CT and tin-filtered LD-CT, respectively. For every examination the scan length was calculated: scan length = DLP / CTDIvol.
In order to get an estimate of the effective dose, the DLP and a standard conversion factor k for the adult lumbar spine (0.018 mSv/mGy*cm) were used: effective dose = DLP * k [15].
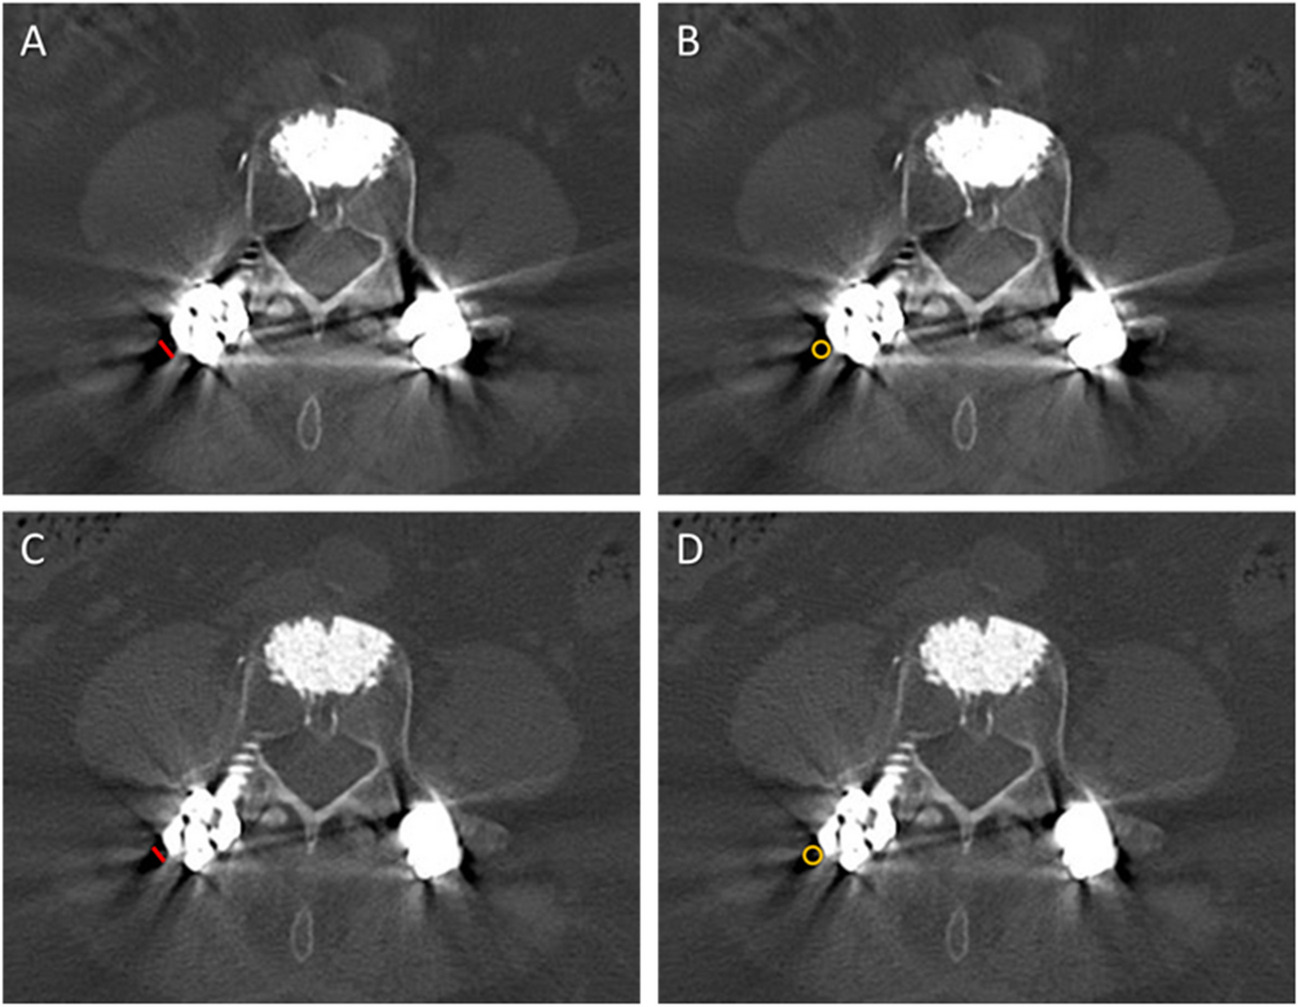
For both the standard CT and the tin-filtered LD-CT, reader 1 measured the following CT values (HU) on axial images (2 mm) in bone kernel (Br 57) using region of interests (ROIs): trabecular bone (mean and standard deviation (SD); average of 2 measurements on 2 different slices at level L3), psoas muscle (mean; average of 2 measurements on the same slices as for trabecular bone) and subcutaneous fat (SD; average of 2 measurements on the same slices as for trabecular bone). All ROIs were placed in regions free of metal artifacts caused by spine implants. Furthermore, for both datasets the width of the most prominent hypodense artifact around the metallic spine implant was measured and a ROI was placed to record the attenuation. The sizes of the ROIs were chosen appropriately in order to measure the greatest possible dimension of each category (Fig. 1). Equally sized ROIs were used for the averaged measurement of trabecular bone, psoas muscle and subcutaneous fat, respectively.
Fig. 1
Measurements of the width and CT value of the most prominent hypodense artifact around the metallic spine implant, exemplary in a 74-year-old female with cement-augmented lumbar instrumentation. Reformatted axial CT image of the standard CT with 120 kV (A and B) and of the low-dose CT with tin filtration (Sn 140 kV; C and D) both demonstrate the measurement of the width (greatest diameter in millimeter; red line in A and C) and of the attenuation (region of interest; yellow circle in B and D) of the most prominent hypodense artifact around the metallic spine implant
Image noise was defined as the averaged standard deviation of the CT attenuation in subcutaneous fat [14]. For trabecular bone the signal-to-noise ratio (SNR), contrast-to-noise ratio (CNR) and a figure of merit (FOM; to compare the dose efficiency between protocols by normalizing the CNR) were calculated for both the standard CT and the tin-filtered LD-CT using the following equations:
SNR = (mean_trabecular bone / SD_subcutaneous fat); CNR = (mean_ trabecular bone – mean muscle) / (SD_trabecular bone); FOM = CNR2 / effective dose [11].
Imaging findingsStandard CT and tin-filtered LD-CT were evaluated by both readers for the presence or absence of the following imaging findings: pedicle screw associated fracture, fracture at other location, fracture of pedicle screw, osteolytic bone resorption around pedicle screw, loosening of pedicle screw, segmental osseous fusion, pedicle screw traversing lateral recess.
Statistical analysisGeneral descriptive statistics were applied. Ordinal data was reported as median with 25th percentile (Q1) and 75th percentile (Q3), and continuous data as mean with standard deviation (SD). To test for normal distribution the Shapiro–Wilk test was applied.
The Wilcoxon signed-rank test was used for comparison of CT dose parameters (scan length, CTDIvol, DLP, effective dose), quantitative parameters (CT values of trabecular bone, muscle, and hypodense artifact; noise, SNR, CNR and FOM) and qualitative parameters (depiction of anatomy, image noise, image artifacts) between standard CT and tin-filtered LD-CT.
Calculation of the prevalence of each imaging finding (pedicle screw associated fracture, fracture at other location, fracture of pedicle screw, osteolytic bone resorption around pedicle screw, loosening of pedicle screw, segmental osseous fusion, pedicle screw traversing lateral recess) was performed for standard CT and tin-filtered LD-CT, respectively, and the McNemar test was applied for comparison.
Agreement between readers was assessed with kappa statistics (ĸ) and effect size for ĸ was interpreted as slight (0–0.20), fair (0.21–0.40), moderate (0.41–0.60), substantial (0.61–0.80), or excellent (0.81–1.00) [16].
SPSS (Version 26, IBM Corporation, Armonk, NY) was used for statistical analysis. Significance was assumed for any value of p < 0.05.
留言 (0)