Chemicals and enzyme sources
All chemicals were from standard sources. Stock solutions of hesperidin (45 mM) were prepared using dimethyl formamide as the solvent. The enzyme αRβG I (EC 3.2.1.168) from Acremonium sp. DSM 24697 was recombinantly produced in Pichia pastoris and the supernatant used as enzyme source (Weiz et al. 2019).
Characterization of orange peel waste (OPW)
OPW was provided by ECA Agroindustria (Concordia, Entre Ríos). The samples were dried to a constant weight through lyophilization. Klason lignin and cellulose were quantified following the method outlined by Bettucci et al. (1998). Hemicellulose content was determined gravimetrically using the procedure described by Breccia et al. (1995). Total sugar content in the biomass was analyzed using the micro-method reported by Masuko et al. (2005), while soluble sugars were measured using the method developed by Yemm and Willis (1954). Protein content was quantified using the Kjeldahl method for organic nitrogen (Bradstreet 1954). Acidic and neutral detergent fibers were determined based on the methodology described by Van Soest et al. (1991), and ethereal extract was quantified according to Saa-Otero et al. (2000). The quantification of hesperidin was carried out according to Mazzaferro and Breccia (2012). All assays were performed in triplicate, and the results were expressed as a percentage of the dry weight.
Enzymatic hydrolysis activity
For quantification of αRβG I activity, each reaction contained 1.8 mM hesperidin, 4 % of DMF in 190 μL of 50 mM sodium citrate buffer pH 5.0, and 10 μL of suitably diluted enzyme solution. The reaction was performed for 10 min at 60 °C. One unit of αRβG I activity was defined as the amount of enzyme required to release 1 μmol of reducing sugars (as maltose) per min.
Synthesis of 4-methylumbellipheryl rutinoside (4-MUR) using OPW
To perform the transglycosylation reaction using OPW, 0.3 g of lyophilized OPW was combined with 10 mL of a 1.8 mM solution of 4-methylumbelliferone in 50 mM sodium citrate buffer pH 5, with 0.03 U/mL of the enzyme αRβG I (30 °C, 20 min).
To analyze the resulting transglycosylation products, LC-MS was employed. The samples were subjected to centrifugation to separate the supernatant from the orange peels. Afterwards, 300 μl of methanol were added to 100 μL of the supernatant, mixed for 1 min, and centrifuged (4 °C, 20 min, 4 000 g). The analysis was conducted using an LC series Summit System (Dionex) coupled with an API2000 mass spectrometer (AB Sciex), employing an Isera ISAspher 100-3 C18-AQ-PoiE column (150 × 2 mm, 3 μm). For the mobile phase, a linear gradient of acetonitrile was utilized (flow rate: 0.25 mL/min, column temperature: 45 °C, injection volume: 10 μL); gradient program: ACN: 10 %, 0–2 min; 10 % → 90 %, 2–10 min; 90 % → 90 %, 10–10.5 min, 90 % → 10 %, 10.5–11 min; 10 % → 10 %, 11–19 min. The compounds were detected by UV-VIS and mass spectrometry. The following parameters for mass detection in positive ion mode were used (Q1 MS): ion source gas 1, 25 psi; ion source gas 2, 40 psi; curtain gas, 15 psi; ion spray voltage, 5 000 V; temperature, 400 °C; entrance potential, −10 V, declustering and focusing potential were used in screening mode.
Transglycosylation of ethylene glycol and glycerol
For transglycosylation reactions, ethylene glycol and glycerol (40 % [v/v]) were incubated together with 1.8 mM hesperidin and 0.02 U/mL of αRβG I in 50 mM sodium citrate buffer pH 5 for 30 min at 60 °C. The transglycosylation reaction to glycerol and ethylene glycol were analyzed by LC-MS. The samples were prepared using Vivaspin 500 concentrators (Sartorius). The concentrate was then diluted (1:3) using 10 mM ammonium formate solution pH. At the end, acetonitrile was added up to a final concentration of 70 % [v/v]. The analysis was performed using an LC series 1100 System (Agilent) coupled to a triple quadrupole mass detector (QTrap 4500 mass spectrometer; AB Sciex) with an APS-HP column (3 μm, HILIC, 60 × 2 mm, Multospher). As mobile phase, an isocratic flow of 85 % acetonitrile and 15 % water was applied (flow rate: 0.3 mL/min, column temperature: 30 °C, injection volume: 2.5 μL). The following parameters for mass detection in negative ion mode were used (Q1 MS): ion source gas 1, 40 psi; ion source gas 2, 50 psi; curtain gas, 30 psi; ion spray voltage, −4 000 V; temperature, 400 °C; declustering potential, −70 V; focusing potential, −260 V; entrance potential, −10 V.
Glyceryl rutinoside synthesis optimization
To quantify the concentration of the transglycosylation product(s), rutinose (nRutinose) and hesperetin (nHesperetin) were quantified (Miller 1959, Mazzaferro and Breccia 2012) using an Epoch Microplate Spectrophotometer (BioTek) together with 96-well UV Flat Bottom Microtiter Plates (Thermo).
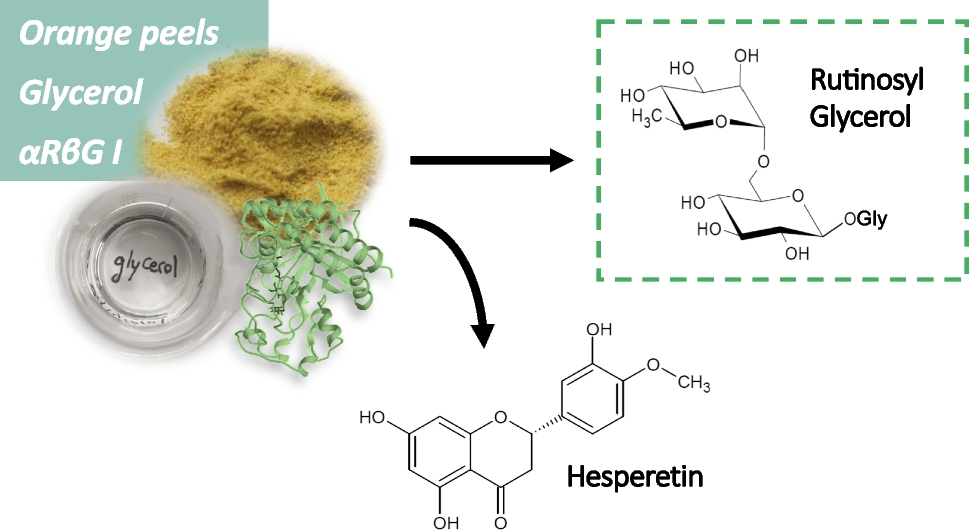
Schematically, the enzymatic reactions catalyzed by αRβG I are the following:
(1)
Hesperidin + H2O ➔ Hesperetin + Rutinose (hydrolysis)
(2)
Hesperidin + R-OH ➔ Hesperetin + R-rutinoside (transglycosylation)
When the reaction is conducted without alcohol, only reaction (1) takes place and the amounts of products (n, mol) correlate as follows:
However, when the reaction is conducted with added alcohol, and because water cannot be excluded from the reaction medium, both reactions (1) and (2) take place, and the amounts of products correlate as follows:
Therefore, the difference between the hesperetin and the rutinose concentrations was taken as a measure for the amount of transglycosylation product in the measured sample.
To optimize the synthesis reaction, several parameters were evaluated. Initially, the glycerol concentration was investigated over a range of 0 % to 70 % [v/v]. The reaction mixture comprised 1.8 mM hesperidin in a 50 mM sodium citrate buffer pH 5, with 6 % [v/v] DMF and 0.03 U/mL of αRβG I (60 °C, 30 min). Subsequently, the reaction temperature was assessed in the range of 15 to 80 °C, utilizing a reaction mixture containing 50 % [v/v] glycerol. Following that, the enzyme quantity was examined within the range of 0.02 to 0.2 U/mL, using a reaction mixture containing 50 % [v/v] glycerol. The temperature was maintained at 60 °C, and the reaction time was reduced to 15 min to observe any variations. Finally, the reaction progress was monitored over time, using the optimized conditions. All experiments were performed in duplicate.
Transglycosylation of glycerol from OPW and purification
To perform the transglycosylation reaction using OPW, 0.9 g of OPW lyophilizate was mixed with 30 mL of 50 % [v/v] glycerol in 50 mM buffer sodium citrate pH 5, and 0.09 U/mL of αRβG I was used for the reaction (60 °C, 17 h). Then, the enzyme was inactivated placing the sample boiling-water bath (10 min) and centrifugated (10 min) to separate the liquid phase.
A solvent extraction was performed three times by adding 0.5 volume of ethyl acetate. The product solution (15 mL aqueous phase) was diluted with 35 mL demineralized water. The solution was then incubated together with 1.5 g of activated charcoal under constant stirring (room temperature, 30 min) and filtered (filter paper Double Rings 103).
The activated charcoal was washed four times with 50 mL demineralized water (constant stirring, room temperature, 5 min) and filtrated. To elute the glyceryl rutinoside from the surface of the charcoal, 50 % [v/v] ethanol was added (constant stirring, room temperature, 30 min) and filtered. The process was performed three-times. The ethanol was evaporated (60 °C), and the remaining solution was analyzed by direct infusion mass spectrometry. The mass spectrometry experiments were performed in a XEVO-G2XSQTOF system using the electrospray (ESI) source. The samples were introduced into the mass spectrometer at 10 μL/min flow rate using a direct infusion mode. Data were obtained in positive ionization mode, acquiring full scan spectra for 1 min in the m/z range 50–1 000 with 1 s scan time. ESI-QToF positive mode parameters: capillary, 3 kV; sampling cone 38 V; source temperature 100 °C; source offset 25 V; desolvation temperature, 250 °C; cone gas flow, 50 L/h; desolvation gas flow 600 L/h. To acquire the MS/MS spectra from the ion at m/z 423, nitrogen was used as collision gas with a collision energy of 37.8 eV.

留言 (0)