Bacterial strains
C. stationis ATCC6872 was purchased from American Type Culture Collection (ATCC). KCCM10340, KCCM10448, KCCM10530, KCCM10972, and KCCM10610 were provided by the Korean Culture Center of Microorganisms (KCCM). These strains were used for genome analysis and IMP/XMP-producing analyses (Fig. S1). E. coli K-12 strain JM109 was used as a cloning host for plasmid construction. E. coli K-12 strain W3110 was used as the wild-type (WT) strain. E. coli I-9ushAaphA/pMWKQ (Kakehi et al. 2007) was provided by Ajinomoto Co., Inc. and was used to obtain an IMP-accumulating strain via mscL knockout. For the analyses shown in Figs. 2, 3 and 5, and Fig. S3, an empty pET-16 vector was co-transformed to enhance lacI expression to facilitate stable growth under non-induction conditions.
Plasmid construction
All primers used in this study are listed in Table S4. The scheme for plasmid construction is described in detail below. PCR was performed using the KOD One PCR mix (TOYOBO, Osaka, Japan), and the coding sequences of the constructed plasmids were verified using Sanger sequencing.
For pMAN-∆mscL, the DNA fragment containing each 1.5 kb upstream and downstream of the mscL gene was artificially synthesized by Genscript Co., Ltd. (Piscataway, NJ, USA). The upstream and downstream fragments were cloned into pMAN997 plasmid (Matsui et al. 2001) using HindIII and BamHI restriction enzymes (Takara bio, Shiga, Japan) and a DNA ligase kit (Ligation high, TOYOBO).
For transporter expression plasmids, genes of interest were amplified using PCR on WT C. stationis ATCC6872, IMP producer KCCM10610, and XMP producer KCCM10340 using primer numbers 1 and 2 for cs0286WT and cs0286T43I, numbers 2 and 3 for cs0286V2L G64E, numbers 4 and 5 for cs0510, numbers 6 and 7 for cs0916, numbers 8 and 9 for cs0966, and numbers 10 and 11 for cs2429 (Table S4). Each transporter gene fragment was cloned into the EcoRI-digested pSTV29 vector using the homemade SLiCE reaction mix (Motohashi 2015).
Primers 12–21 were prepared for the site-directed mutagenesis of cs0286. PCR was performed using pSTV29-cs0286WT as the template. Primers 12 and 13 were used for cs0286V2L; 14 and 15 for cs0286G64E; 16 and 17 for cs0286R143A; 18 and 19 for cs0286Q146A; and 20 and 21, for cs0286N208A. PCR fragments were cyclized using the SLiCE reaction. cs0286G64E was used to prepare cs0286G64E R143A, cs0286G64E Q146A, and cs0286G64E N208A in the same manner. For the experiment shown in Fig. S4, 6xHis-tag fused vectors were used. This vector was made with SLiCE reaction which concatenates synthesized 6xHis-tag fragment and non-tag vectors linearized by PCR with primers 26 and 27.
mscL knockout
The I-9ushAaphAmscL strain was created by a previously reported method utilizing the temperature-sensitive replication origin of pMAN997 (Matsui et al. 2001). E. coli I-9ushAaphA was transformed with pMAN-∆mscL and cultured at 30 °C for the replication of orits. Genomically integrated transformants were selected by 42 °C culture under selective force with ampicillin. Transformants with a correctly inserted pMAN-∆mscL cassette in the genomic mscL locus were screened by PCR with primer sets numbers 22/23 and 24/25. The hit strain was cultured again at 30 °C, and single-colony clones were tested to determine whether they exhibited ampicillin resistance. The ampicillin-sensitive clones, which should have passed a secondary crossover-recombination event, were tested to check if the mscL locus was correctly disrupted by PCR with the number 22/25 primer set, followed by Sanger sequencing.
Culture conditions
C. stationis IMP/XMP production analyses
Cells grown on CM2B plates (10 g/L polypeptone, 10 g/L yeast extract, 5 g/L NaCl, 10 μg/L biotin, 100 mg/L adenine, and 100 mg/L guanine) were inoculated into 20 mL seed medium (50 g/L glucose, 5 g/L polypeptone, 10 g/L yeast extract, 2.5 g/L NaCl, 100 mg/L adenine, and 100 mg/L guanine). After 24 h of cultivation at 31.5 °C, 3 mL of the seed culture was inoculated into 27 mL of the main medium (80 g/L glucose, 1 g/L sodium glutamate, 10 g/L NH4Cl, 25 g/L MgSO4·7H2O, 0.1 g/L CaCl2, 37 mg/L FeSO4·7H2O, 32 mg/L MnSO4·7H2O, 36 mg/L ZnSO4·7H2O, 8 mg/L CuSO4·5H2O, 23 mg/L L-cysteine, 24 mg/L alanine, 8 mg/L nicotinate, 45 μg/L biotin, 5 mg/L thiamine hydrochloride, 30 mg/L adenine, and 19 mL/L phosphoric acid [85%]). Cells were cultured at 31.5 °C and sampled chronologically.
E. coli IMP production analyses
Cells grown on LB plates were inoculated into the modified MS medium composed of 40 g/L glucose, 1 g/L MgSO4·7 H2O, 16 g/L (NH4)2SO4, 1 g/L KH2PO4, 0.01 g/L FeSO4 ·7 H2O, 0.01 g/L MnSO4 7H2O, 8 g/L yeast extract, and 30 g/L CaCO3 and cultivated at 37 °C (Fig. 1) or 30 °C (Figs. 2, 3, 5, and Fig. S2) for 24 h, unless otherwise noted. Growth was assessed by measuring the optical density at 600 nm. Purine nucleotides in the culture supernatant were separated by HPLC using a GS-220HQ column (Shodex, Tokyo, Japan) and 0.2 M NaPO buffer (pH 4.0) as the mobile phase and were detected spectrophotometrically by monitoring the absorbance at 254 nm. Protein levels in the growth media were quantified with Bradford’s method using the Bio-Rad Protein Assay Kit following the manufacturer’s protocol (Bio-Rad Laboratories, Hercules, CA, USA). All experiments were performed with more than three biological replicates.
Calculation of metabolic kinetics
For the measurement of the intracellular and extracellular nucleotides, sampled cell cultures were freeze-thawed and heated at 85 °C for 5 min with intermittent vortexing before centrifugation. After heat extraction, extracts containing intracellular and extracellular nucleotides were measured as described above. Using data at 16 and 24 h, when cell growth ceased and IMP, inosine (Ino), and hypoxanthine (Hyp) content increased linearly, kinetic parameters v1, v2, and v3 were calculated as follows:
$$\begin_=\frac}\right]}_}+}}+}\right]}_}+}}+}\right]}_}+}})} /}(}}_) \\ _=\frac}\right]}_}}} /}(}}_)\\ _=\frac}\right]}_}+}}+}\right]}_}+}})} /}(}}_)\end$$
Protein extraction and Western blotting
Cells cultured for 24 h as described above were collected and resuspended in buffer (20 mM Tris–HCl, 300 mM NaCl, 3 mM MgSO4, 10% w/v glycerol, pH 8) to an OD600 of 10. Proteins were extracted by ultrasonication and concentrations were determined using the Pierce™ BCA Protein Assay Kit (Thermo Fisher Scientific, Waltham, MA, USA). Ten micrograms of lysate was loaded on the SuperSep™Ace 10–20% gradient polyacrylamide gels (Wako, Osaka, Japan) with the sample buffer solution with reducing reagent (Nacalai tesque, Kyoto, Japan). After SDS-PAGE, proteins were transferred to the membrane using iBlot®2 PVDF kit (Thermo Fisher Scientific) following the manufacturer’s protocol. The membranes were soaked in the blocking solution (Nacalai tesque) overnight at 4 °C, washed, and incubated in the His-tag antibody (Cat# MAB050, R&D systems, Minneapolis, MN, USA) at 1:1000 dilution for 3 h at room temperatures. After washing, membranes were incubated in the HRP-fused secondary antibody (Cat# 8738, CellSignaling technology, Danvers, MA, USA) at 1:5000 dilution for 3 h at room temperatures. After washing, bands were visualized with Immobilon® Forte western HRP substrate (Merck Millipore, Burlington, MA, USA).
Whole genome sequencing
Genomic DNA from the strains of C. stationis ATCC6872, KCCM10340, KCCM10448, KCCM10530, KCCM10972, and KCCM10610 was isolated using the Wizard Genomic DNA Purification Kit (Promega, Madison, WI, USA). Genome sequence analysis was performed at Macrogen Co., Ltd. (Seoul, Korea) with ATCC6872 (WT) genomic DNA using the SMRT sequencing with the PacBio platform (Menlo Park, CA, USA) and Illumina sequencing (San Diego, CA, USA). PacBio reads were assembled using HGAP (v3.0), and errors in the draft assembly were corrected with Illumina reads (> 1000 × depth, 150 bp paired ends) using Pilon (v1.21). Gene annotation was performed using the Prokka pipeline (v1.12b).
Genomic DNA of KCCM10340, KCCM10448, KCCM10530, KCCM10972, and KCCM10610 was used for library preparation on an Illumina platform with 150 bp paired-end reads. Read depths exceeding 1000 × were acquired, and single-nucleotide polymorphisms (SNPs) were called using the ATCC6872 genome as a reference. BWA (v0.7.17), SAMTools, and SnpEff (v4.3t) were used for the mapping, variant calling, and annotation of SNPs, respectively. Among the SNPs, nonsynonymous mutations were filtered, and the inclusion relations of SNPs of each strain were counted using the R package VennDiagram (v1.7.3).
Molecular dynamics (MD) simulations
The MD simulations were performed using GROMACS version 2020.6 (Abraham et al. 2015). The all-atom Fuji force field (Kamiya et al. 2020; Fujitani et al. 2009) was used for the proteins, lipids, and ions in TIP3P water (Jorgensen et al. 1986). All systems were hydrated with 150 mM NaCl electrolyte. The temperature was set to a constant (298 K) using a Nosé–Hoover thermostat (Nosé, 1984; Hoover 1985) with a coupling constant of 1.0. The pressure was set to 1 bar constant, using a semi-isotropic Berendsen barostat (Berendsen et al. 1984) or a Parrinello–Rahman barostat (Parrinello and Rahman 1981) with a coupling constant of 2.0 ps for both barostats. Electrostatic interactions were calculated using the particle mesh Ewald (PME) method (Darden et al. 1993) with a real-space cut-off of 1.0 nm. The Lennard–Jones interactions were calculated using the Lennard–Jones particle mesh Ewald (LJ-PME) method (Wennberg et al. 2015) with geometric approximations of the combination rules in reciprocal space. The Verlet cut-off scheme was used for the neighbor list. The linear constraint solver (LINCS) algorithm (Hess 2008) with a LINCS-order of six was used to constrain all the bonds. To remove the bond-angle degrees of freedom from hydrogen atoms, a virtual site model was adapted.
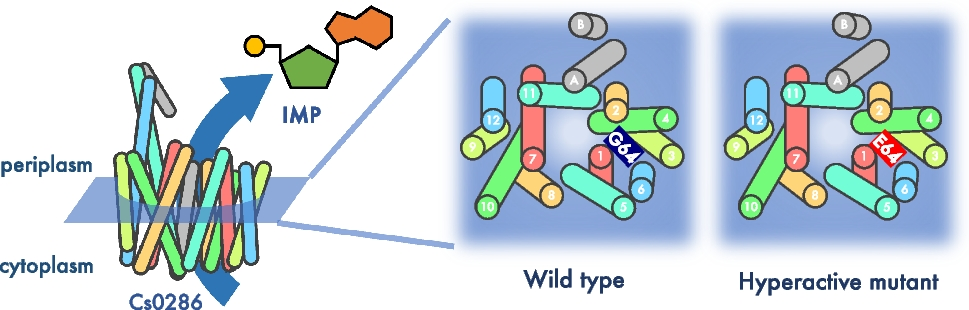
The initial coordinates of Cs0286 and its mutant were built using Alphafold2 (Jumper et al. 2021; Mirdita et al. 2022). The initial proteins were embedded in a pre-equilibrated E. coli model membrane (for 1 μs) consisting of six lipids (652 molecules of PMPE [1-palmitoyl-2-cis-9,10-methylene-hexadecanoic-acid-sn-glycero-3-phosphoethanolamine]; 181 molecules of PMPG [1-palmitoyl-2-cis-9,10-methylene-hexadecanoic-acid-sn-glycero-3-phosphoglycerol]; 40 molecules of PVPE [1-palmitoyl-2-vacenoyl-sn-glycero-3-phosphatidylethanolamine]; 68 molecules of HYPE [1-palmitoleoyl-2-cis-11,12-methylene-hexadecanoic-acid-sn-glycero-3-phosphoethanolamine]; 101 molecules of PMHP [1-palmitoyl-2-cis-11,12-methylene-hexadecanoic-acid-sn-glycero-3-phosphoethanolamine]; and 41 molecules of cardiolipin [1-(1-palmitoyl-2-cis-9,10-methylene-hexadecanoic-acid-sn-3-phosphatidyl)-3-(1-palmitoyl-2-oleoyl-sn-3-phosphatidyl)-sn-glycerol]) using LAMBADA (Schmidt and Kandt 2012). Overlapping lipids whose heavy atoms were within 0.12 nm of those of the protein were removed. In systems containing IMP, the initial position of IMP was set using the CDOCKER module in Discovery Studio 2020, placing it in the largest cavity within the protein. The position set was similar to the corresponding position of chloramphenicol (Cm) in the co-crystal structure of MdfA and Cm (PDB:4ZOW, Heng et al. 2015). System energy was minimized using alternating steepest-descent and conjugate gradient methods, followed by isothermal-isobaric ensemble equilibration using the semi-isotropic Berendsen barostat, with position restraints only on the heavy atoms of the protein for 30 ns with a time step of 2 fs. Then, unconstrained simulations were performed using a semi-isotropic Berendsen barostat, initially for 20 ns with a time step of 2 fs and later for 10 ns with a time step of 4 fs. Using the final structures as the initial structure, three unbiased simulations were carried out with a time step of 4 fs, using a semi-isotropic Parrinello–Rahman barostat with a different initial velocity that satisfied a Maxwell–Boltzmann distribution at 298 K. Production runs were performed for three 100-ns runs for the IMP-free system and ten 340-ns runs for the system with IMP. Interaction energies were calculated using the GROMACS gmx energy tool, and the trajectories of the last 20 ns (without IMP) or 100 ns (with IMP) were used.
Statistical analyses
Statistical analyses were performed using R (v4.2.0) and its package multcomp (v1.4). For the data in Fig. 1c, Dunnett’s tests were performed. VC was set as a control. Tukey’s honest significant difference tests were performed for the data shown in Figs. 2a, 3c–e, 5a–c, and Fig. S2. Data were visualized using Microsoft Excel.

留言 (0)