
記住我
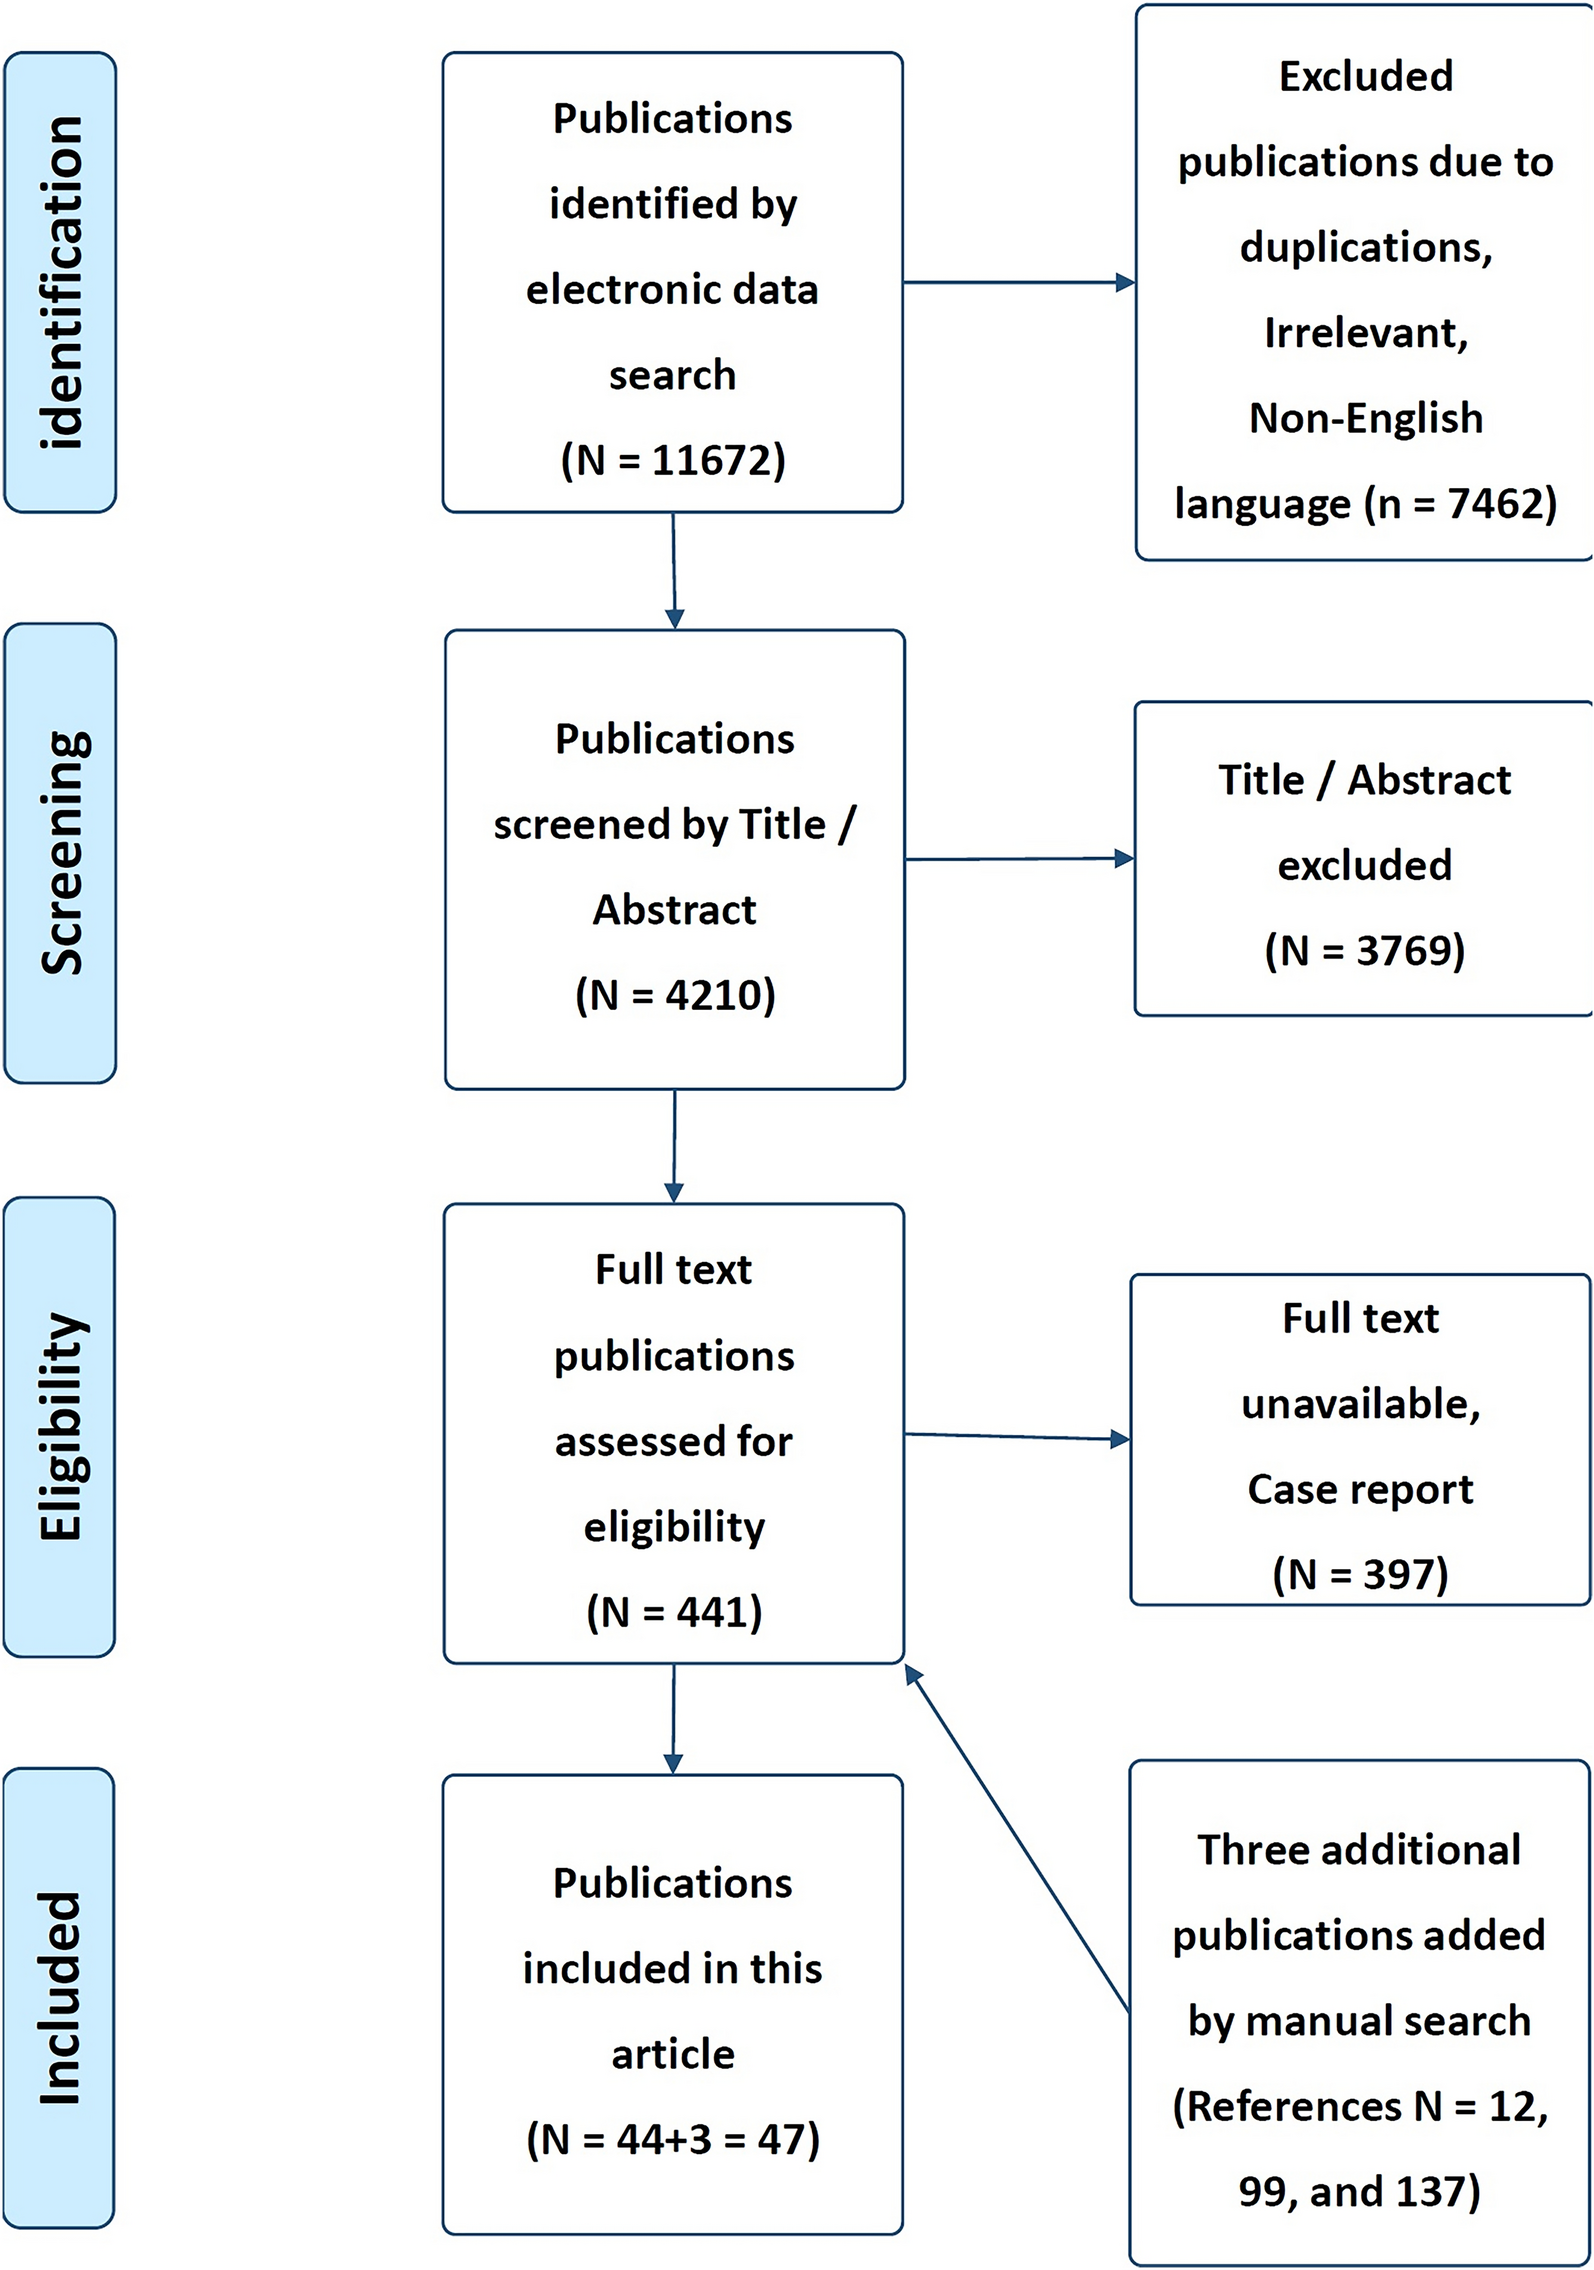
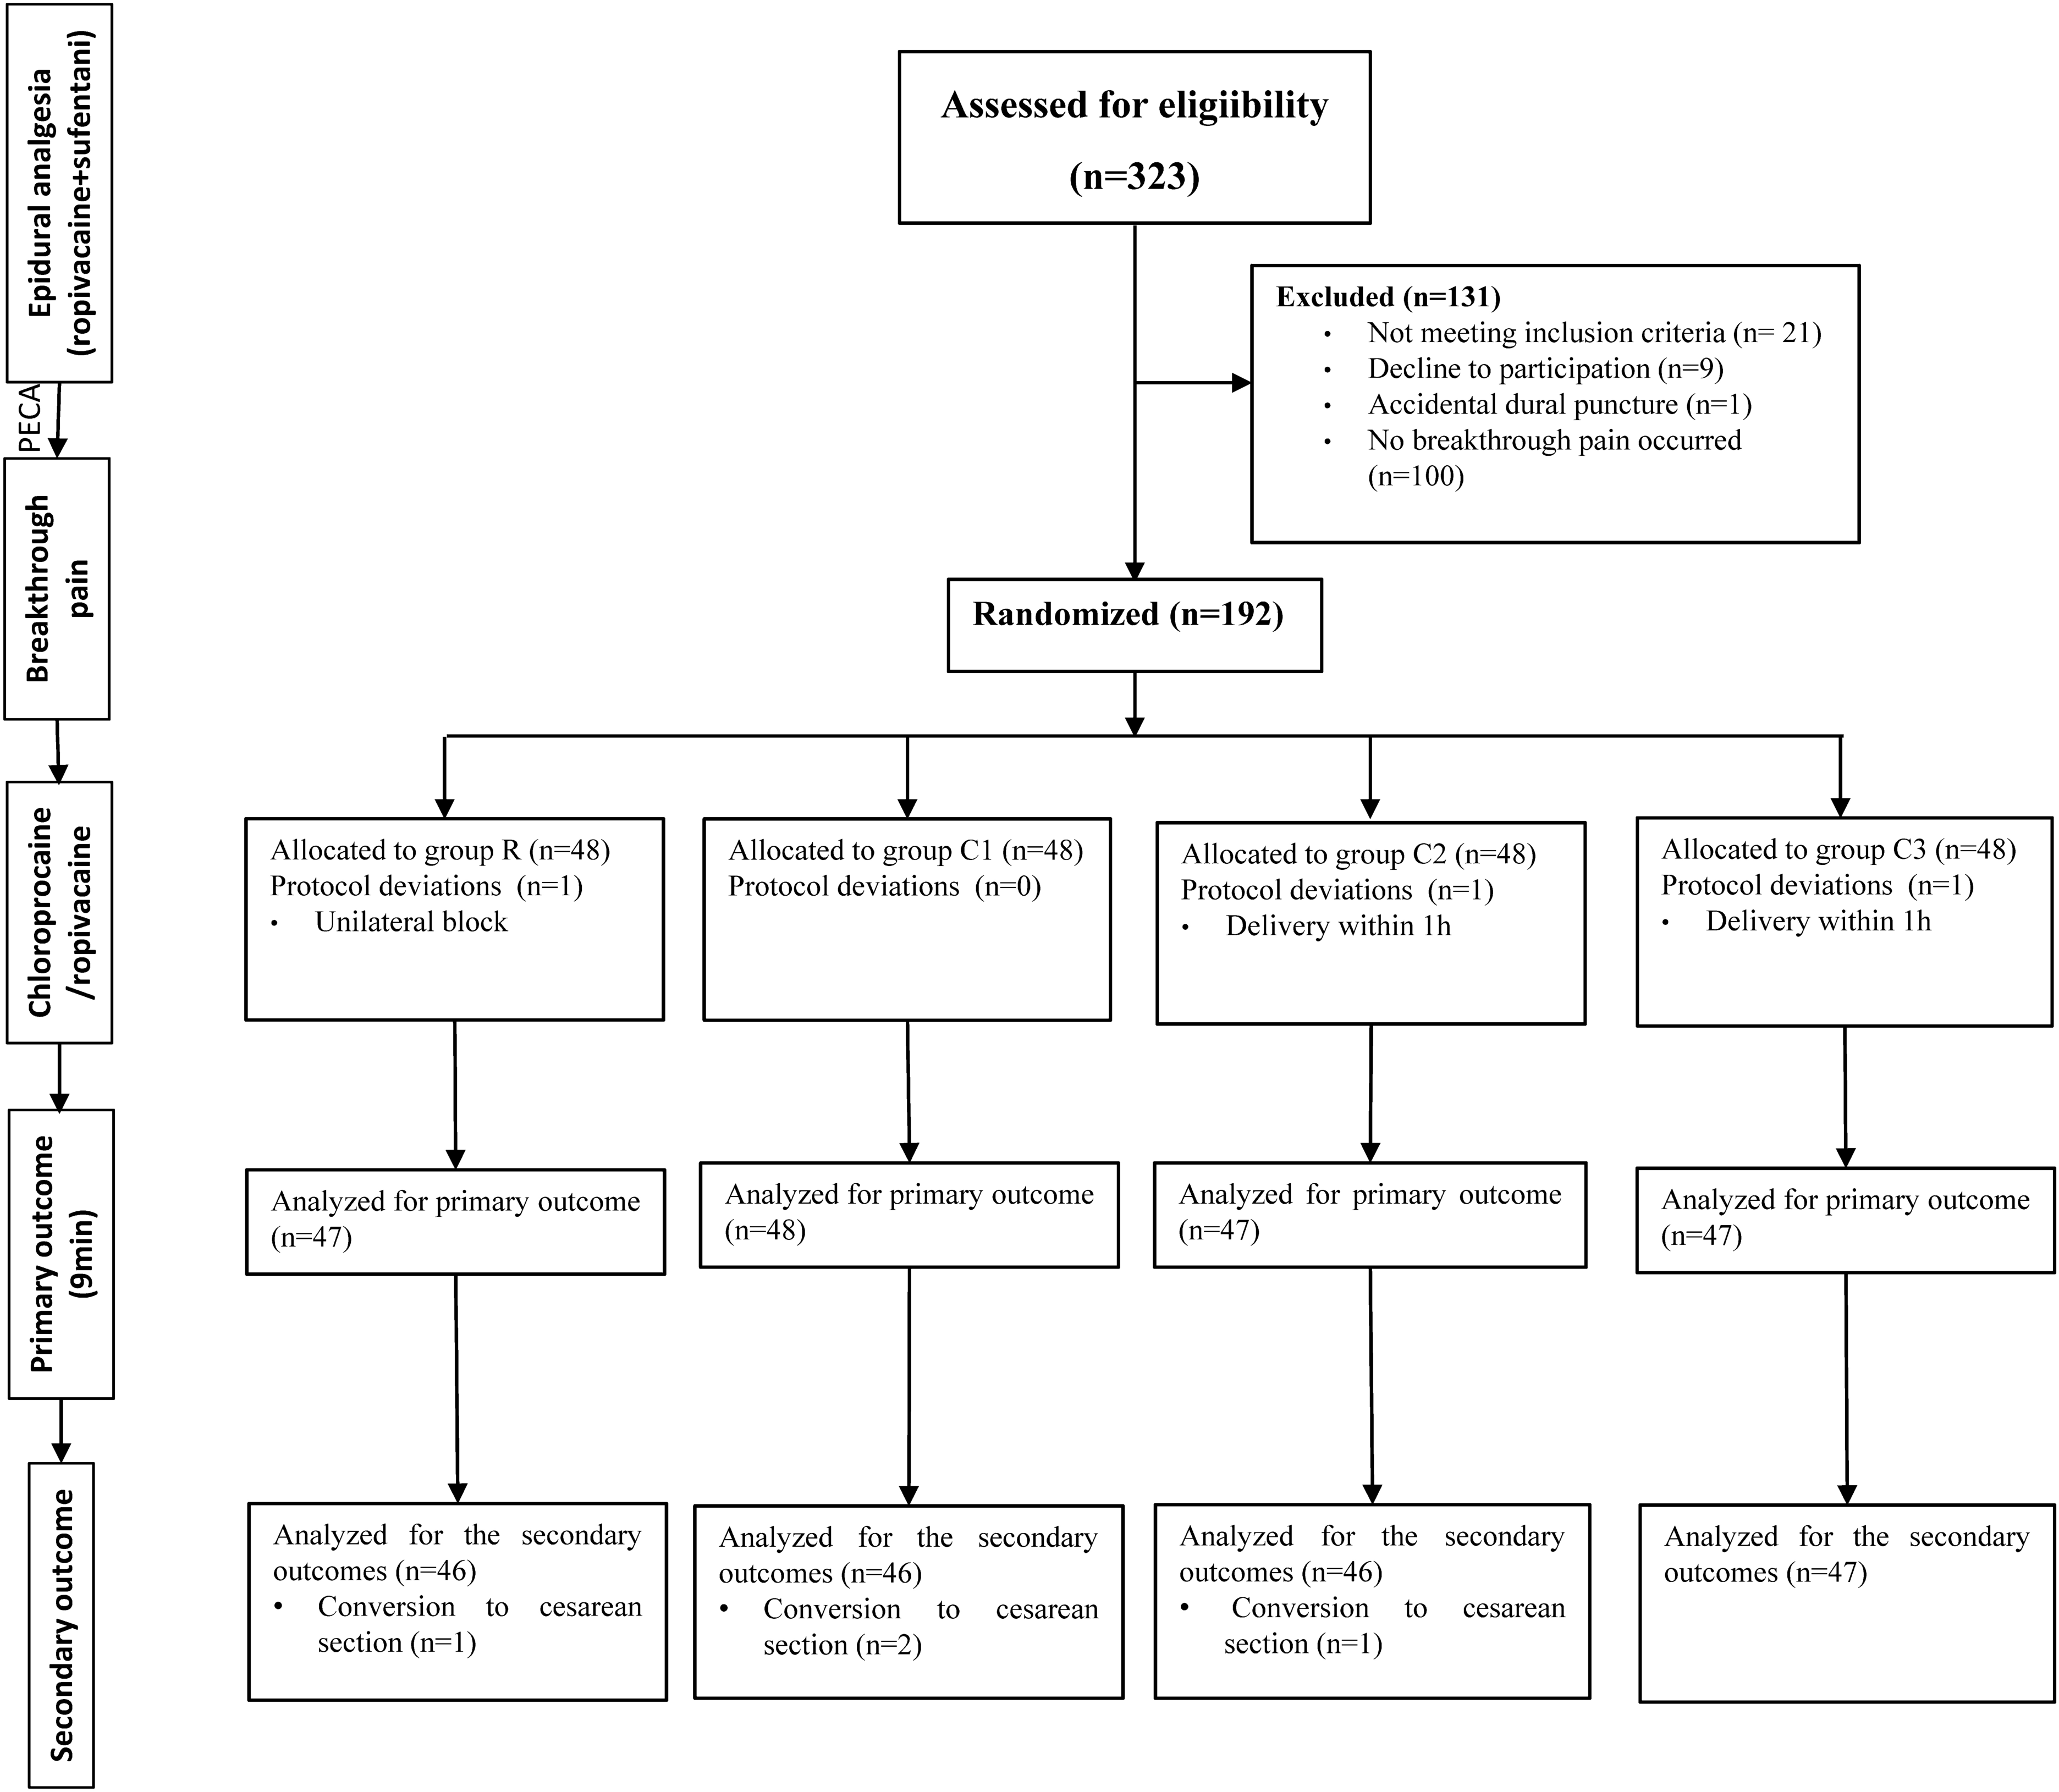
Of 34,192 total survey respondents, 2711 patients met the inclusion/exclusion criteria and were included in this cLBP study (Fig. 2).
Fig. 2
The gender distribution was uniform with 52.55% male and 47.45% female. The average age ± standard deviation (SD) at injury and when treated with HWDS were 44.97 ± 12.60 years and 45.76 ± 12.65 years, respectively. The average reported pain chronicity was 287.60 ± 171.75 days and the average duration of HWDS usage was 94.89 ± 63.89 days. These data are summarized in Table 1.
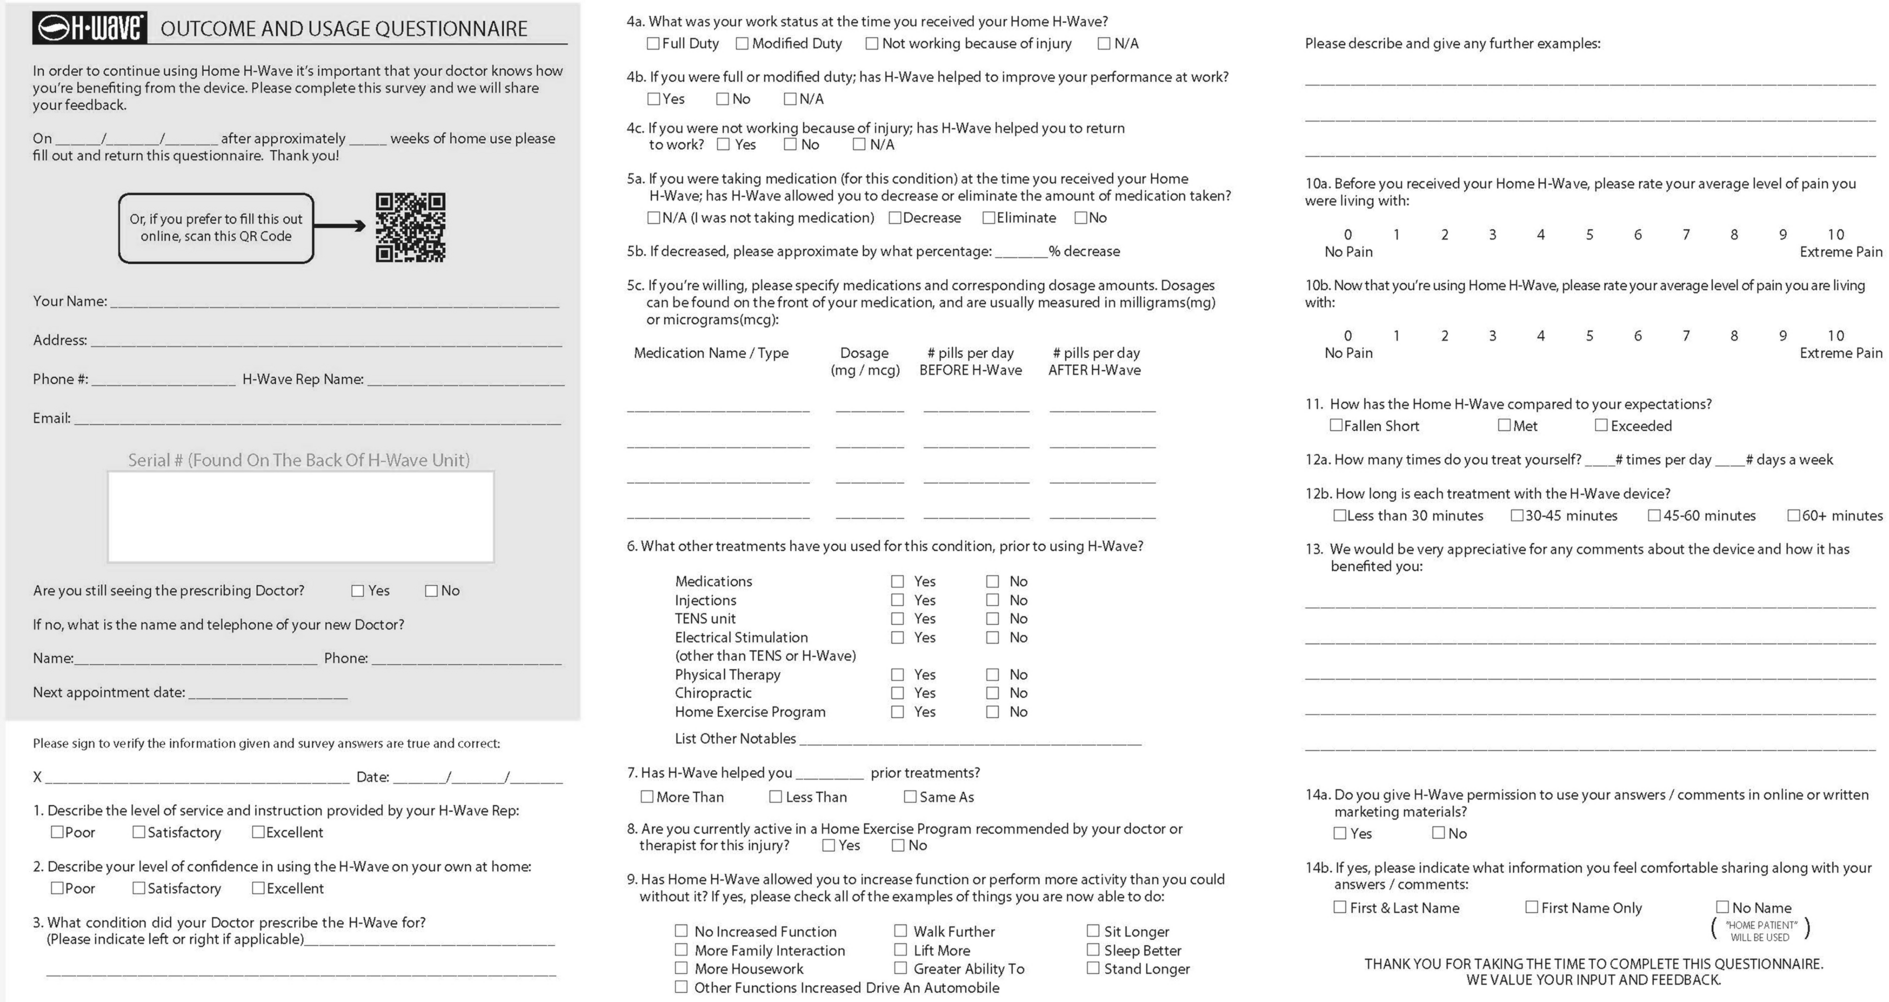
Table 1 Characteristics of H-Wave® device stimulation (HWDS) intervention cohortDevice UsageOn average, 2636 patients treated themselves almost twice daily (1.91 ± 0.91) over 5.5 days (5.50 ± 1.69) each week. Almost half (49.98%) applied the device for sessions lasting 30–45 min.
Insurance MixThis cohort consisted almost entirely of workers’ compensation (n = 1722, 63.5%), personal injury (n = 778, 28.7%), and auto injury (n = 207, 7.6%) claimants.
Concomitant Home Exercise ProgramOver two-thirds (1784 patients, 68.5%) reported active participation in a prescribed home exercise program, while the rest of the cohort did not.
SafetyNo adverse or severe adverse events related to HWDS use were reported by any survey participants in this study.
Primary Outcome MeasuresPain ReductionThe pre-treatment visual analogue scale (VAS, 0–10) score reported for 2684 patients was 7.56 ± 1.80 (95% interval: 7.49, 7.63), while the post-treatment score for 2672 patients was 4.43 ± 2.14 (95% interval: 4.35, 4.51). The difference between pre- and post-treatment scores (2672 patients) was 3.12 ± 1.96 (95% interval: 3.05, 3.19), which was statistically significant (p = 0.0008) (Fig. 3, Table 2). Of note, 1527 patients (56.89%) reported their pre-treatment pain to be 8 or higher, while 759/1527 (49.71%) reported post-treatment reduction in pain level to 5 or below.
Fig. 3
Pain reduction after treatment with H-Wave® device stimulation, with a difference greater than 3 being statistically significant (p = 0.0008)
Table 2 Analysis of primary and secondary outcome measuresUsing a minimum of 20% pain reduction as a liberal estimate—in particular compared to weaker TENS data—of clinically meaningful significance, among 2711 LBP patients, 2312 patients (85.28%) reported pain relief of at least 20% from baseline (before H-Wave treatment) (Fig. 4).
Fig. 4
Pain relief of at least 20% after treatment with H-Wave® device stimulation, which was statistically significant (p < 0.0001)
Function/ADL ImprovementOf 2586 patients [after exclusion of 125 surveys missing data], 2492 patients (96.36%) reported statistically significant improvement (p < 0.0001) in function/ADL post-treatment with HWDS (Fig. 5, Table 2).
Fig. 5
Improvement in function/ADL after treatment with H-Wave® device stimulation, which was statistically significant (p < 0.0001)
Medication Usage ReductionOf 2102 patients [after exclusion of 609 surveys missing data], 1354 patients (64.41%) reported statistically significant (p < 0.0001) reduction or elimination of use of pain medications. Specifically, 1123 (53.42%) decreased and 231 (11.00%) completely stopped medication use (Fig. 6, Table 2).
Fig. 6
Decrease or elimination in medication usage after treatment with H-Wave® device stimulation; decreased + eliminated vs. no effect was statistically significant (p < 0.0001)
Sleep ImprovementOf 2711 patients, 1620 patients (59.76%) reported statistically significant (p < 0.0001) improvement in their quality of sleep (Fig. 7, Table 2).
Fig. 7
Improvement in sleep quality after treatment with H-Wave® device stimulation, which was statistically significant (p < 0.0001)
Secondary Outcome MeasuresWork Status and PerformanceOf 2444 patients [after exclusion of 267 surveys missing data], 1369 (56.0%) were not working when starting HWDS, while 573 (23.5%) were doing modified work and 502 (20.5%) were fully working. Of the 1369 not working, 853 specifically indicated that they had not been working due to their injury, with 281 (32.9%) of those reporting that HWDS had subsequently helped them return to work.
Of the 1017 patients on full or modified duty [after exclusion of 58 surveys missing data], 830 (81.61%) reported statistically significant (p < 0.0001) improvement in their work performance post-treatment with HWDS (Fig. 8, Table 2).
Fig. 8
Improvement in work performance in patients on full or modified duty after treatment with H-Wave® device stimulation, which was statistically significant (p < 0.0001)
Subgroup analysis indicated that improved work performance was more likely for those on full duty than on modified duty (odds ratio [OR] = 1.758; 95% confidence interval [1.171, 2.639]).
Prior Treatment and Preference for HWDSAlmost all of 2711 patients, 2680 (98.86%), reported the use of various other forms of treatment prior to starting HWDS (p < 0.0001). Of 2615 patients [after exclusion of 96 surveys missing data], 1658 (63.40%) reported that HWDS helped them more than prior treatments, being statistically significant (p < 0.0001); while 905 (34.60%) reported similar effectiveness and only 52 (2.00%) inferior benefits (Table 2).
Patient ExpectationsOf 2582 patients [after exclusion of 129 surveys missing data], 2467 patients (95.55%) reported that HWDS use exceeded or met their expectations. Specifically, 863 (33.43%) reported exceeded and 1604 (62.12%) reported met expectations, with these levels of expectation being statistically significant (p < 0.0001) (Fig. 9, Table 2).
Fig. 9
Level of patient expectation, where proportion reporting that H-Wave® device stimulation either met or exceeded expectations was statistically significant (p < 0.0001)
Patient Satisfaction with ServiceOf 2625 patients [after exclusion of 86 surveys missing data], 2613 (99.54%) reported that the level of service provided by H-Wave® representatives was excellent or satisfactory (p < 0.0001). Specifically, 2208 (84.11%) reported excellent and 405 (15.43%) satisfactory service, which was statistically significant (p < 0.0001) (Fig. 10, Table 2).
Fig. 10
Level of patient satisfaction with service, where the proportion reporting H-Wave® device stimulation instruction to be excellent or satisfactory was statistically significant (p < 0.0001)
Patient Confidence in Device UseOf 2619 patients [after exclusion of 92 surveys missing data], 2601 (99.31%) reported their level of confidence in device usage to be excellent or satisfactory. Specifically, 1980 (75.60%) reported excellent and 621 (23.71%) satisfactory confidence, which was statistically significant (p < 0.0001) (Fig. 11, Table 2).
Fig. 11
Level of patient confidence in device use, with proportion of H-Wave® device stimulation use on their own being excellent or satisfactory was statistically significant (p < 0.0001)
Outcomes Based on Treatment Length PeriodsFor further analysis, survey patients were stratified into three subgroups based on number of days they had used H-Wave, with a “trial period” ranging from 22 to 35 days (3–5 weeks), an “early treatment period” from 36 to 98 days (5–14 weeks), and a “late treatment period” from 99 to 365 days (14–52 weeks). The number of patients in the trial period, early treatment period, and late treatment period are 737 (27.18%), 647 (23.87%), and 1327 (48.95%), respectively.
Subgroup comparison analysis results were generally consistent without any major deviation, although using the device for longer periods resulted in better outcomes of pain relief, medication elimination, sleep improvement, and work performance (Table 3).
Table 3 Effect of treatment duration on outcome measuresThese observations were confirmed with statistical significance by further multiple regression analyses, where duration of device usage, participation in a home exercise program, and full or modified work are all important positive variables to consider when assessing the efficacy of HWDS. Negative variables to consider include longer pain chronicity and older patient age when injured. Specific statistically significant (p < 0.0001) inferences of interest include the following:
Longer device use results in greater pain relief.
Pain reduction is higher for those working than not working.
A higher pain level before treatment is associated with more substantial pain relief.
Longer pain chronicity results in less pain reduction.
Active home exercise program participation is associated with more functional improvement.
Outcomes Based on Analysis of All DiagnosesWhile not the primary purpose of this study, the investigators were interested in how outcomes of HWDS for nonspecific chronic LBP might compare with the much larger cohort with “all diagnoses” treated, especially since prior H-Wave® studies have included many other conditions. For this analysis, diagnostic inclusion/exclusion criteria included all patient conditions, with duration of pain chronicity from the date of injury until the start of H-Wave® treatment remaining 90–730 days, and duration of device usage from 22 to 365 days. Of the same 34,192 patients, all-diagnoses cohort totaled 11,503 patients, which included the 2711 primary LBP study patients (23.6%). Survey results were surprisingly similar for the larger cohort, despite being heavily skewed away from nonspecific chronic LBP.
The following outcomes were nearly equivalent for all diagnoses compared to nonspecific cLBP: male gender 52.09% (0.46% less), age when injured 46.50 (1.53 years more), age when treated 47.33 (1.57 years more), duration of device usage 94.51 days (0.38 days less), pain improvement 3.00 (VAS, 1–10; 0.12 less), significant pain relief (≥ 20%) 85.60% (0.32% more), function/ADL improvement 96.07% (0.29% less), not working before treatment 57.61% (1.61% more), improved work performance 82.62% (1.01% more), expectations met 95.75% (0.20% more), service satisfaction 99.67% (0.13% more), confidence with device 99.54% (0.23% more), and device usage 1.90/day and 5.65 days/week (0.01/day less, 0.15 days/week more).
The following outcomes were slightly different: pain chronicity 305.13 (17.53 days more), medication reduction 67.28% (2.87% more), sleep improvement 57.53% (2.23% less), and helped more than prior treatments 66.38% (2.98% more).
留言 (0)