
記住我
Involvement of the nervous system in Systemic Lupus Erythematosus (SLE) gives rise to nonspecific and heterogeneous neuropsychiatric manifestations, and its mortality rate is surpassed only by that of Lupus Nephritis (LN) (1). Approximately 12%-95% of lupus patients present clinical CNS-related symptoms, encompassing headaches, cognitive impairments, and psychiatric disorders, collectively termed as Neuropsychiatric SLE (NPSLE). Nevertheless, the intricate mechanisms underpinning the pathogenesis of NPSLE remain obscure (2–4). Hence, it is critical to identify a suitable animal model that best resembles human NPSLE, thereby facilitating an in-depth exploration of NPSLE’s pathogenesis. This pursuit is pivotal for a more profound comprehension of the underlying mechanisms and for the advancement of innovative diagnostic or therapeutic methodology catering to NPSLE patients.
To date, several lupus-prone mouse models displaying CNS manifestations have been employed for investigating NPSLE, exemplified by the MRL/MpJ-Faslpr/lpr (MRL/lpr) (5–7). However, a recent study has indicated that the neuropsychiatric manifestation of MRL/lpr mice is confined primarily to depression-like behavior, without discernible distinctions in other behavioral assessments encompassing general activity, motor coordination, anxiety-like behavior, cognition activity as well as social ability (5). The lack of robust behavioral phenotypes within this mouse strain restricts its viability as a definitive NPSLE mouse model. Inquiries into Neuropsychiatric SLE have also encompassed the use of New Zealand black/New Zealand white (NZB/W) F1 and BXSB mice which have also been used in NPSLE studies; nonetheless, both NZB/W F1 and BXSB mice exhibit an even lower incidence of behavioral phenotypes compared to MRL/lpr mice (8, 9). Additionally, B6.lpr mice and B6.Sle1.Sle3 strains have displayed certain levels of depression-like and anxiety-like behaviors (10, 11). Nevertheless, the attenuated lupus phenotypes and delayed disease onset in B6.lpr and B6.Sle1.Sle3 mice restrain their application for the NPSLE study. Given these multifaceted challenges, there is an urgent need to identify a new robust mouse model for NPSLE, thereby enabling an in-depth exploration of the underlying disease mechanisms.
Methyl-CpG binding protein 2 (MeCP2), a protein encoded by a gene located on chromosome Xq28, selectively binds 5-methyl cytosine residues in CpG dinucleotides in mammalian genomes (12, 13). Intriguingly, the expression level of MeCP2 has been established as a pivotal contributor in neurological diseases, such as Rett syndrome (RTT) (14–17). A transgenic murine model was created through the insertion of a human Mecp2 gene, resulting in the overexpression of the MeCP2 protein (18–20). This transgenic mouse model develops a progressive neurological phenotype, exhibiting stereotypy and repetitive movements, epilepsy, spasticity, hypoactivity, and early death (19).
More interestingly, Mecp2 was identified as one of the susceptibility genes associated with SLE through a genome-wide association study (GWAS) (21–25). Mecp2 transgenic mice bred on the FVB/N background exhibited elevated levels of anti-nuclear antibodies (26). Significantly, a recent study conducted by Yang et al. identified an impairment in the TH1 immune response and IFN-γ production in children presenting with postnatal neurological syndromes arising from Mecp2 duplication. This group of patients also exhibited variable immunological abnormalities, including reductions in memory T and B cells, natural killer cells, and responses in immunoglobulin (Ig) assay (20).
We hypothesize that C57BL/6 mice transgenic for human Mecp2 (designated as B6. Mecp2Tg1) could potentially exhibit concurrent autoimmune and neuropsychiatric-resembling characteristics. In this study, we undertook a comprehensive evaluation through the exploration of autoantibody profiles, immune cell subpopulations and their activation status, proteinuria levels, neuropsychiatric phenotypes, and pertinent signaling pathways. The objective was to ascertain the feasibility of using B6.Mecp2Tg1 mouse model as a novel tool for investigating NPSLE.
2 Materials and methods2.1 AnimalsSix-week-old female C57BL/6J (B6, stock# 000664) mice and age-matched female MRL/MpJ-Faslpr/J (MRL/lpr, stock# 000485) mice were purchased from the Jackson Laboratory (Bar Harbor, ME). These mice were housed in the animal facility of the University of Houston (Houston, TX) and were afforded ad libitum access to food and water. Breeding pairs of mice transgenic for human Mecp2 with a B6 background, hereafter referred to as B6.Mecp2Tg1, were generous gifts from Dr. Huda Zoghbi at the Baylor College of Medicine (Houston, TX). The B6.Mecp2Tg1 strain comprises a 99-kb human PAC clone containing all exons of the Mecp2 gene while lacking other transcriptional units for neighboring genes. This human-derived Mecp2 gene insertion was presumed to have occurred within the X chromosome (19). B6.Mecp2Tg1 mice were bred under specific pathogen-free (SPF) conditions, and all animal protocols were approved by the Institutional Animal Care and Use Committee (IACUC) at the University of Houston.
We studied adult female mice for both B6 and MRL/lpr strains, as well as both genders for the transgenic mice aged nine to seventeen weeks. Previous research on MRL/lpr indicated that female mice display more prominent signs of a lupus-like disease (27, 28). The B6.Mecp2Tg1 strain exhibits abnormal behavior starting from 12 weeks of age (19), while MRL/lpr display NPSLE-like features at the same age (6).
2.2 GenotypingTail tissues were clipped from the litters and collected in RNase- and DNase-free microcentrifuge tubes. The collected tissues were subsequently treated with tail lysis buffer, containing 0.5% SDS, 0.1M NaCl, 0.05M Tris (pH 8.0), and 2.5 mM EDTA. Proteinase K (Catalog# AM2546, Thermo Fisher Scientific) was added into the pre-warmed lysis buffer at a concentration of 1 mg/ml prior to utilization. The primers, synthesized by Integrated DNA Technologies (IDT), were specifically designed for the amplification of the human-derived Mecp2 gene by PCR: Forward primer, CGCTCTGCCCTATCTCTGA; Reverse primer, ACAGATCGGATAGAAGACTC.
2.3 Enzyme-linked immunosorbent assaySerum samples obtained from all mice groups at different age intervals were tested for the presence of total immunoglobulins and anti-dsDNA antibodies using ELISA assays. In the case of total immunoglobulin detection, microplates were coated with 2 µg/ml goat anti-mouse IgG (Southern Biotech) or IgM. Following blocking, serially diluted immunoglobulin (Ig) standards (IgG, Catalog# I5381, Sigma-Aldrich; mouse IgM, catalog# 010-0107, Rockland) or serum samples were added into the microplate. After a two-hour incubation at room temperature, the bound Igs were detected with alkaline phosphatase-conjugated goat anti-mouse IgG (Catalog# 2040-04, Southern Biotech) or goat anti-mouse IgM (Catalog# 626822, Invitrogen). Subsequently, quantification was carried out by measuring the absorbance at 405 nm. For the detection of IgG anti-dsDNA antibodies, 100 μg/ml of mBSA in phosphate-buffered saline (PBS) was applied to pre-coat the plates at 37°C for thirty minutes prior to the incubation of dsDNA standards (Catalog# D1501, Sigma) with an initial concentration at 1250 ng/ml. Serum samples were diluted 1:50 in PBS and added to the plates for a two-hour incubation. Alkaline phosphatase-conjugated goat anti-mouse IgG was used as the detection antibody.
2.4 Flow cytometrySpleens were harvested from all mice groups at 17 weeks of age, and Cell Staining Buffer (Catalog# 420201, BioLegend) was used for the preparation of single-cell suspensions. Following cell quantification using the Countess™ II Automated Cell Counter (Catalog#A27977, Thermo Fisher Scientific), splenic cells were adjusted to a concentration of 1 x 10⁷ cells per milliliter. Cell suspensions of 100 µl per well were added into a 96 well V-bottom plate (Catalog# 3894, Corning), each well containing 1 x 10⁶ suspended cells. A pre-incubation on ice for 10 minutes was conducted with 0.25 μg per well of TruStain FcX™ PLUS (anti-mouse CD16/32) (Catalog# 156604, BioLegend) to block non-specific immunoglobulin binding to Fc receptors.
Antibodies conjugated with FITC, PE, PE/Cy7, APC, and APC/Cy7 against CD3 (Clone 17A2, Catalog# 100204), CD4 (PE, Clone GK1.5, Catalog# 100408), CD4 (APC, Clone GK1.5, Catalog# 100412), CD8a (Clone 53-6.7, Catalog# 100712), CD69 (Clone H1.2F3, Catalog# 104526), CD44 (Clone IM7, Catalog# 103028), CD62L (Clone MEL-14, Catalog# 104418), CD25 (Clone 3C7, Catalog# 101904), B220 (Clone RA3-6B2, Catalog# 103222), CD19 (Clone 6D5, Catalog# 115506), CD21 (Clone 7E9, Catalog# 123408), CD23 (Clone B3B4, Catalog# 101608), CD86 (Clone GL-1, Catalog# 105012), GL7 (Clone GL7, Catalog# 144610), CD138 (Clone 281-2, Catalog# 142504), CD11b (Clone M1/70, Catalog# 101206), CD11c (Clone N418, Catalog# 117324), and F4/80 (Clone BM8, Catalog# 123110) were purchased from Biolegend. These conjugated antibodies were subsequently added to the plates following the designed panels for the identification of B cells, T cells, myeloid cells, and their respective subsets. Following a 20-minute incubation on ice in darkness, cells were washed twice with Cell Staining Buffer through centrifugation at 350 x g for five minutes, followed by the addition of 7-amino-actinomycin D (7-AAD) (Catalog# 420404, Biolegend) to discriminate dead cells. Analysis of the splenic single-cell suspensions was performed on a multicolor BD LSR II cell analyzer (BD Biosciences). FlowJo software was employed for data acquisition and subsequent analysis.
2.5 Antigen arrayThe detailed procedure for the antigen array has been described previously (29–31). A compilation of 85 putative autoantigens (Supplementary Table 1) identified in the literature was meticulously selected to establish the autoantigen array. These represent established autoantigens that have been studied in at least one of the autoimmune diseases, including SLE, rheumatoid arthritis (RA), Sjögren’s syndrome, or multiple sclerosis (MS) (30, 31).
The selected antigens were printed in a 2 × 8 block matrix layout onto epoxy-modified microarray slides (STRATEC Consumables). This was accomplished utilizing a microarray printing robot (sciFLEXARRAYER S3, Scienion) positioned within a controlled printing chamber at 25°C and 60% humidity. Serum samples derived from different mouse groups at 17 weeks were diluted with super G solution (Catalog# 105101, Grace Bio-Labs). Each subarray was exposed to 100 μl of the diluted serum sample for subsequent detection using Cy5-conjugated goat anti-mouse IgG (Catalog# 115-175-166, Jackson ImmunoResearch). The array slides were scanned using a GenePix Microarray Scanner 4400A (Molecular Devices LLC, USA), and each individual spot was assessed and quantified through GenePix Pro 7 software (Molecular Devices LLC, USA). A heatmap depicting the antigen array was generated and evaluated employing RStudio (Version 1.3.959; RStudio, Inc.) utilizing average linkage Euclidean distance hierarchical clustering.
2.6 Behavioral testingAll tests as detailed below were conducted under low incandescent lighting conditions and were digitally documented by ANY-maze software (Stoelting Co., IL, USA). Behavioral tests were conducted three times across development, at 9-, 13-, and 17-week-old. Subsequent measurement of all data were executed employing ANY-maze software and subjected to further analysis via ImageJ (NIH) software (http://rsbweb.nih.gov/ij/).
2.6.1 Open field testThe mouse was allowed to move freely within an open field apparatus (43 cm × 43 cm) surrounded by transparent plexiglass walls, for a duration of 15 minutes. Tracking of travel distances and durations within both central and peripheral zones was recorded using the ANY-maze software. The animal’s head was designated as the reference point for a zone entry tracking. The central zone was demarcated as a 20 cm × 20 cm area positioned at the center of the enclosure, in alignment with prior descriptions (32). The overall distance traveled reflects the general locomotor activity, while reduced time spent within the center zone signifies tendencies toward anxiety-like behavior (33). A thorough cleansing procedure using 70% ethanol was performed on the apparatus between successive test animals.
2.6.2 Elevated plus mazeThe elevated plus maze test is used for measuring anxiety-like behavior in rodents. The test is based on the natural aversion of mice for open and elevated areas, as well as on their natural spontaneous exploratory behavior in novel environments. The EPM apparatus consists of four arms, each with a length of 10 cm × 50 cm, where two arms are open and two are closed. These arms intersect to form a “cross” shape at an elevation of approximately 70 cm above the ground. The mouse was positioned at the intersection area, facing the open arms of the maze, and allowed to explore the maze for a duration of 5 minutes. The movements of each mouse were meticulously tracked and recorded using the ANY-maze software, enabling measurement of the time spent by the mouse in each of the four arms. The number of entries into the open arms and the time spent in the open arms are used as indices of open/elevated space-induced anxiety in mice. Diminished time spent by a mouse in the open arms is indicative of anxiety-like behavior (34).
2.6.3 Light-dark testThe light and dark test is widely used to measure anxiety-like behavior in mice. The test is based on the natural aversion of mice to brightly illuminated areas and on their spontaneous exploratory behavior in novel environments. The LD apparatus contains two compartments: a lit compartment measuring 27 × 27 × 27 cm and a dark compartment featuring blackened walls and floor with dimensions 27 × 18 × 27 cm. These two compartments were separated by a partition with an small opening (7 × 7 cm), enabling the mouse to travel between the two compartments. Each mouse was granted five minutes to explore the entire apparatus, including both compartments. The total duration spent within the lit area was recorded. The number of entries into the compartments and the duration of time spent in each compartment are recorded and used as indices of bright-space anxiety-like behavior in mice. A reduced duration in time spent within the lit compartment suggests an augmentation in anxiety-like behavior (35).
2.6.4 Tail suspension testThe tail suspension test (TST) was performed to evaluate the depression-like behavior in mice. For this assessment, each mouse was suspended by its tail using adhesive tape and fastened to a hook affixed to a metal bar positioned at a height of 45 cm. The metal bar was situated longitudinally between two metal bases. During a 6-minute test session, the cumulative duration of immobility was recorded and measured. The test was conducted concurrently for two animals placed within separate chambers. An extended period of immobility exhibited by a mouse during the TST serves as an indicator of depression-like behavior (36).
2.6.5 Forced swim testThe Forced swim test (FST) was employed to assess depressive-like behavior in mice. The apparatus consisted of a clear Plexiglas cylinder (40 cm in height, 20 cm in diameter) filled with water to a depth of approximately 30 cm (23-25°C). The water was replaced between each trial to ensure consistency. Each mouse was individually placed into the water-filled cylinder and subjected to 6-minute swim session, with a 2-minute pre-test followed by a 4-minute test session. The entire swim session was recorded from a side view. The duration of immobility, which represents a state of behavioral despair, was the primary measure of interest (37).
2.6.6 Object recognition testThe novel object recognition test is predicated on the robust inclination of rodents to preferentially explore novel objects in an open field arena (38). This test encompassed three distinct stages. The first step was the habituation phase, during which the mouse was given five minutes to freely explore the arena (43 cm × 43 cm). For the second stage, two identical objects (each measuring 5 cm × 5 cm × 10 cm) possessing the same texture were positioned within the apparatus, placed at opposing sides with a 5 cm separation from the walls. The mouse was once again placed in the arena and allowed to explore the familiar objects and their surroundings for 5 minutes. Subsequently, the mouse was returned to its home cages for 10 minutes, during which one of the objects was substituted with a different novel object positioned in the same location. The third stage encompasses placing the mouse within the testing arena, allowing it to freely explore both the familiar and the novel object for a duration of five minutes. Time spent exploring the objects were recorded in each stage. Data extracted from the third stage were presented as novel object preference score, calculated as (time exploring novel object/total time for familiar and novel objects exploration) × 100%. The act of exploring the objects was defined as whisking, sniffing, rearing on or touching the object, and approaching the object within a 3 cm proximity.
2.6.7 Social preference testThe social interaction test was conducted within a transparent plastic arena measuring 70 cm × 25 cm × 38 cm, divided into three compartments using two liftable doors. Two cylindrical pencil cups constructed from wire mesh, one containing an adult unfamiliar mouse and the other empty, were placed upside down within the two opposite side chambers (each measuring 28 cm × 25 cm × 38 cm). This arrangement facilitated olfactory interaction while minimized tactile interaction. In the test protocol, each object mouse was initially placed in the empty apparatus and allowed to freely explore the entire apparatus for 5 minutes. Subsequently, an empty cup was placed in one side compartment and a similar cup housing an age- and gender-matched social target mouse in the opposite side compartment and the mouse was allowed to access all the compartments for 10 minutes. Following this session, a novel age- and gender-matched mouse was placed under the empty cup, enabling the object mouse to engage for an additional 10 minutes either with the familiar caged mouse or a novel caged mouse situated in the opposite side compartments. The data extracted from the final phase were represented as a preference score calculated as (time interacting with the novel mouse/total time interacting with both familiar and novel mice) × 100%. Interaction of the object mice with familiar/novel mice was defined by actions such as sniffing, rearing on or touching the pencil cup, and approaching the cup within 3 cm (39).
2.7 ImmunofluorescenceMice were sacrificed at 17 weeks of age and subjected to extensive cardiac perfusion with cold PBS followed by 4% paraformaldehyde (PFA). Subsequently, the brain and kidney were carefully harvested and fixed in 4% PFA for 24 hours at 4°C. After dehydration, the brain was embedded within the optimal cutting temperature (OCT) compound, and cryosections were prepared in a coronal plane using a cryosection machine (Leica CM3050 S Cryostat, USA). The frozen sections were subjected to fixation with 4% PFA, followed by permeabilization using 0.5% Triton X-100 in PBS. To inhibit non-specific binding, blocking was executed using 10% goat serum. The sections were subsequently incubated with primary antibodies at different dilutions: 1:800 for DCX (Catalog# 4604S, Cell Signaling Technology), 1:1000 for MeCP2 (Catalog# ab50005, Abcam), 1:200 for glial fibrillary acidic protein (GFAP) (Catalog# 12389S, Cell Signaling Technology), 1:500 for ionized calcium-binding adaptor molecule 1 (Iba1) (Catalog# ab178846, Abcam), 1:200 for neuronal nuclear protein (NeuN) (Catalog# 24307S, Cell Signaling Technology), 1:1000 for CD31 (Catalog# ab24590, Abcam), and 1:500 for Albumin (Catalog# ab207327, Abcam). These brain sections were then incubated with secondary antibodies. For the staining of immune cell infiltration, FITC anti-mouse CD3 Antibody (Clone 17A2, Catalog# 100204, Biolegend) was employed at a dilution of 1:100, and FITC anti-mouse CD19 Antibody (Clone 6D5, Catalog# 115506, Biolegend) at the same dilution. For the IgG deposition test, the frozen sections were directly incubated with goat anti-mouse IgG antibody after the blocking procedure. To counteract fading and label the nuclei, Prolong Gold Antifade Reagent with DAPI (Catalog# 8961s, Cell Signaling Technology) was used. Images were captured using an IX-81 inverted microscope (Olympus) and processed through cellSens Dimension software (Olympus). The acquired results were then subjected to analysis using ImageJ software, including the measurement of dendritic length of the DCX+ newborn neurons, the thickness of the granule cell layer (GCL) of the hippocampus region, and the soma area of the Iba-1 positive macrophages.
2.8 TUNEL stainingTerminal deoxynucleotidyl transferase dUTP nick end labeling (TUNEL) staining was conducted utilizing an in situ fluorescein-labeled cell death detection kit (Catalog# 11684795910, Roche). Tissue sections were fixed with 4% PFA for 20 minutes, followed by a 30-minute PBS wash. Subsequently, the slides were incubated with permeabilization buffer and then exposed to the TUNEL reaction mixture for labeling. Following the staining procedure, the slides were examined under IX-81 inverted microscope (Olympus), and the captured images were processed using cellSens Dimension software (Olympus).
2.9 Western blottingWhole brain tissues were lysed with protein extraction buffer containing 2% SDS, 25 mM DTT, 100 mM Tris at pH 6.8, and 1x protease/phosphatase inhibitor cocktail (Catalog# 5872S, Cell Signaling Technology). Proteins were run on SDS-PAGE gels with a loading of 40 μg per lane. Proteins were then transferred onto PVDF membranes using the semi-dry transfer method in a transfer buffer consisting of 190 mM Glycine, 25 mM Tris, 0.1% SDS, and 20% methanol. Subsequently, membranes were blocked with 5% non-fat dry milk (Nestle) in TBST buffer containing 20 mM Tris-Cl at pH 7.5, 150 mM NaCl, and 0.1% Tween 20. This was followed by an overnight incubation of primary antibodies at an optimized dilution; refer to Supplementary Table 2 for more details. The secondary antibodies were diluted at 1:1000 for one-hour incubation at room temperature. Membranes were then developed using a Clarity Western ECL Substrate kit (Catalog# 1705061, Bio-Rad), and a Gel Doc™ XR+ System (Bio-Rad) was used to acquire chemiluminescent western blotting images. Band intensities were quantified through ImageJ software and subsequently normalized against loading control levels of β-actin or GAPDH.
2.10 Statistical analysisThe sample size for mice in each test was determined through power analysis. For the analysis of the antigen array test, all data were normalized with the positive control within each array block, followed by logarithmic transformation using base 10. This facilitated the generation of a heatmap that showcased antibody clusters exhibiting similar expression patterns. For the heatmap, proteins were categorized as significantly elevated if their associated P value was below 0.05. Data from each group were imported into R studio for clustering analysis and heatmap construction. The clustering was executed in an unsupervised manner based on Euclidean distance. Moreover, the nonparametric Spearman’s method was used for the correlation analysis between each autoantibody and the anti-dsDNA level. Regarding all other tests, multiple comparisons were performed using one-way analysis of variance (ANOVA), and Tukey’s test was implemented to adjust for confidence intervals and significance. The presentation of aggregate data took the form of means ± SEM. GraphPad Prism software version 9 was used for statistical analysis. A significance threshold of less than 0.05 was adopted for all tests.
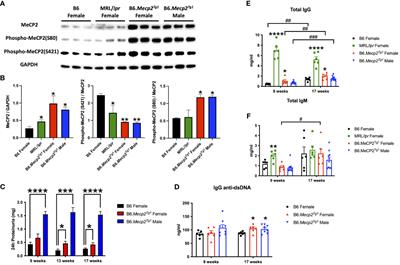
3 Results3.1 Upregulation of MeCP2 protein in B6.Mecp2Tg1 and spontaneous murine lupus MRL/lpr miceTo determine MeCP2 protein expression in murine lupus, we performed a western blot analysis using the brain tissue lysates from the spontaneous lupus mouse model MRL/lpr. The protein expression of MeCP2 and its two phosphorylated forms within the brain of MRL/lpr and Mecp2 transgenic mice was examined, as shown in Figures 1A, B. The overall MeCP2 protein expression level was significantly increased in MRL/lpr mice, as compared to the wildtype B6 control (Figures 1A, B). This result strongly suggests that MeCP2 is indeed upregulated in murine lupus. Interestingly, both female and male B6.Mecp2Tg1mice displayed a significant increase in pan-MeCP2 and phospho-MeCP2 at S80 while displaying a reduction in phospho-MeCP2 levels at S421 within the brain compared to B6 (Figures 1A, B).
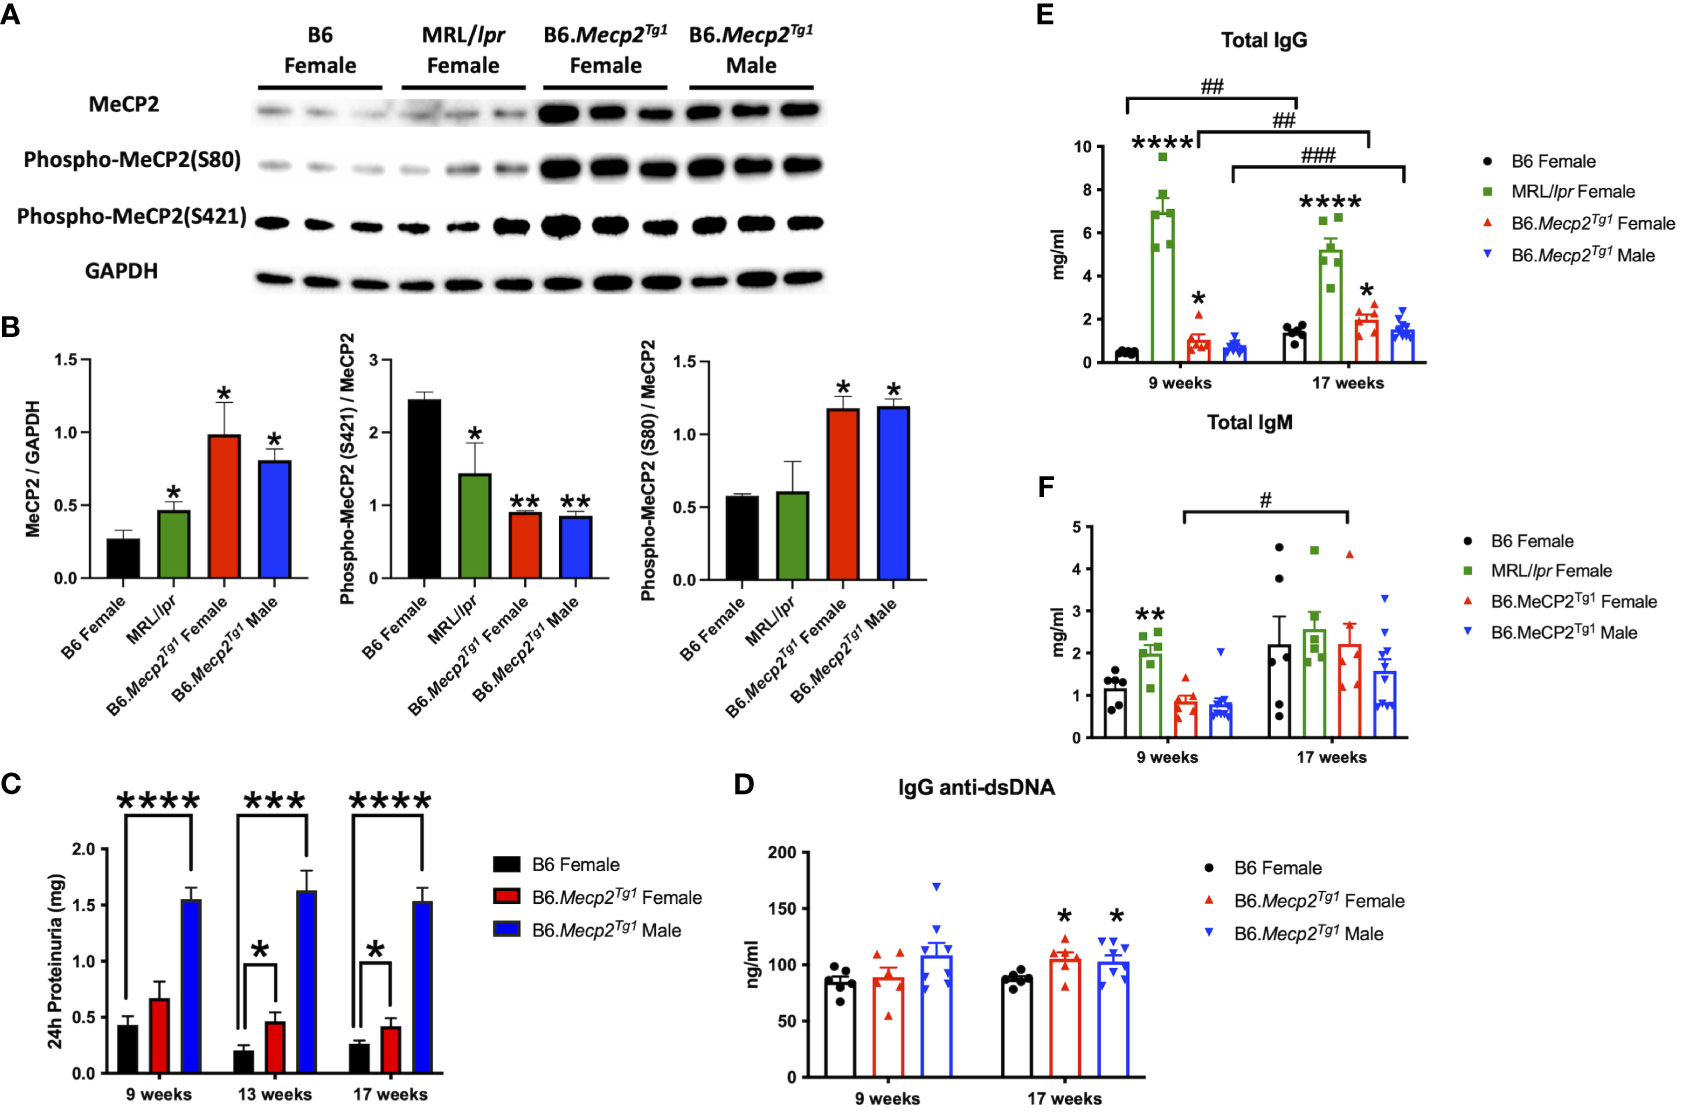
Figure 1 MeCP2 overexpression mice exhibit elevated proteinuria and immunoglobulins. (A, B) Expression of MeCP2 and its two phosphorylated forms within the brain of all mice groups, along with the normalization analysis. (C) Quantification of 24-hour proteinuria across different age intervals for the four mice groups. (D-F) Assessment of IgG anti-dsDNA antibody, total IgG, and IgM levels at both the 9-week-old and 17-week-old for the mice. n = 5-12 per group. *, P < 0.05, **, P < 0.01, ***, P < 0.001, ****, P < 0.0001. #, P < 0.05, ##, P < 0.01, ###, P < 0.001. * means changes between mouse groups, and # means changes within each mouse group.
3.2 Autoimmune phenotypes in B6.Mecp2Tg1 miceThe litters from the B6.Mecp2Tg1 breeding pair were genotyped, and only mice carrying the transgene were used for further experiments (Supplementary Figure 1A). As shown in Supplementary Figure 1B, the spleen weights of both genders of the transgenic mice were similar when compared to B6 controls. 24-hour proteinuria was measured at different time points in the transgenic mice. Intriguingly, male B6.Mecp2Tg1 mice displayed elevated proteinuria levels as early as 9-week-old, while female B6.Mecp2Tg1 mice exhibited a notable increase in proteinuria starting at 13 weeks of age (Figure 1C). The 24-hour proteinuria data for all mice groups at 17 weeks of age, including lupus-prone control MRL/lpr mice, was summarized in Table 1.
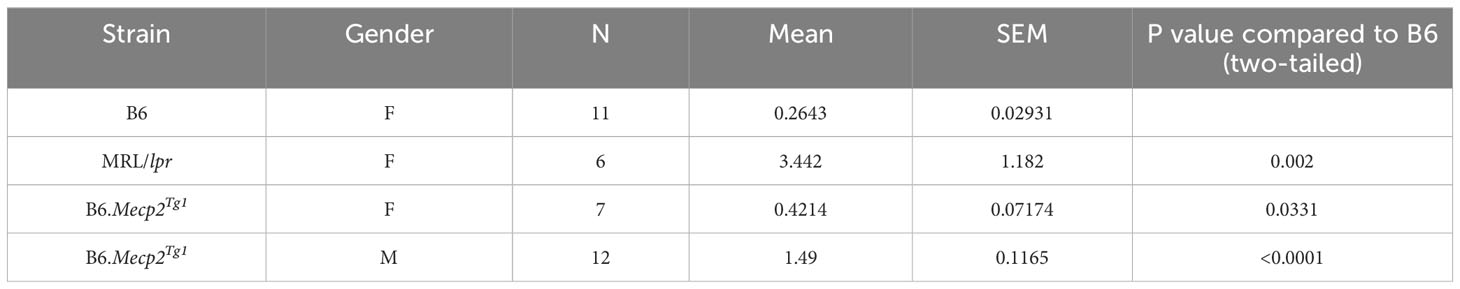
Table 1 24h Proteinuria at 17 weeks (mg).
Both genders of the transgenic mice exhibited enhanced levels of IgG anti-dsDNA in comparison to B6 controls at 17 weeks of age, aligning with the profile observed in MRL/lpr mice (Figure 1D, Table 2). Remarkably, the total IgG level was notably upregulated in early-aged female B6.Mecp2Tg1 mice compared to B6, and this elevation persisted through the 17 weeks of age point (Figure 1E). The male transgenic mice displayed elevated IgG level over time, although not significantly compared to B6. Furthermore, Figure 1F indicates a considerable elevation in IgM levels over time in female B6.Mecp2Tg1. Collectively, these findings suggest that similar to the MRL/lpr, both male and female B6.Mecp2Tg1 mice display lupus-like phenotypes, including elevated proteinuria, augmented anti-dsDNA antibodies, and increased total IgG/IgM levels.
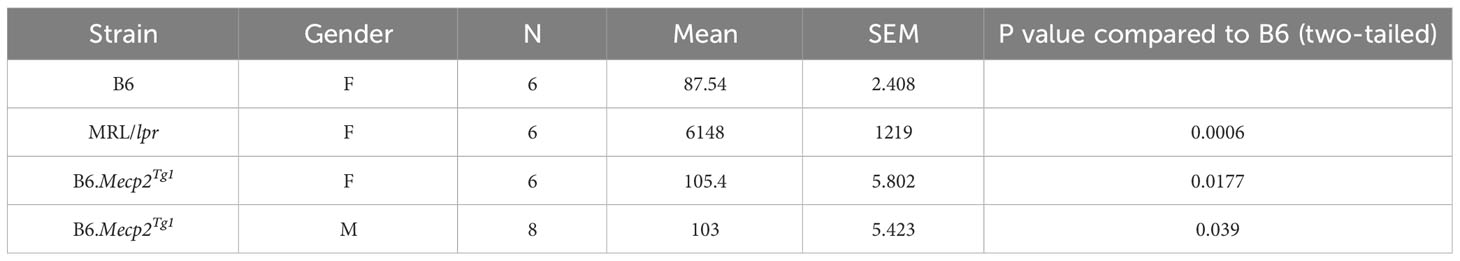
Table 2 IgG anti-dsDNA level at 17 weeks (ng/ml).
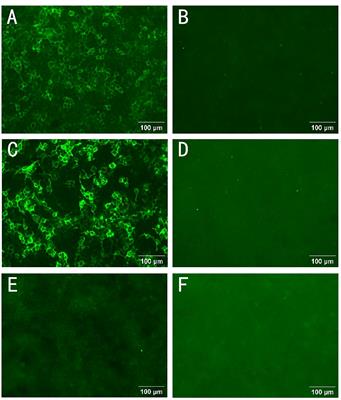
Given the notable increase of 24-hour proteinuria observed in the Mecp2 transgenic mice, we performed immunofluorescence to detect potential pathological alterations in the B6.Mecp2Tg1 mice kidneys. As shown in Supplementary Figure 1C, an enhanced deposition of IgG was observed in the kidney glomerulus area in female B6.Mecp2Tg1 mice when compared to B6 controls. Furthermore, pronounced macrophage infiltration into the kidneys of female Mecp2 transgenic mice was evident, in contrast to B6 controls (Supplementary Figure 1D, E). Collectively, aggregated IgG deposition, increased macrophage infiltration, and elevated proteinuria confirmed the progressive renal impairment observed in Mecp2 transgenic mice, akin to the phenotypes associated with lupus nephritis.
3.3 Autoantibody profiling in B6.Mecp2Tg1 miceNext, we employed an in-house autoantigen array harboring 85 antigens to comprehensively screen for autoantibodies across all mouse groups. As shown in Figure 2A, each autoantigen array chip is subdivided into 2 x 8 subarrays, enabling the concurrent assessment of 16 samples per assay. Serum samples obtained from mice in each group were applied to the array, with Cy5 labeled anti-mouse IgG used to recognize the antigen-antibody complexes on the array surface. Subsequently, an unsupervised heatmap cluster method was applied to interpret the outcomes of the antigen array test. The resulting clustering of all three mouse strains accurately and distinctly identified each group, revealing a hierarchical order: MRL/lpr > B6.Mecp2Tg1 > B6 (Figures 2B, C). Comprehensive statistical analyses comparing the groups are shown in Supplementary Table 3. A representative array image of IgG anti-dsDNA antibody is shown in Figure 2D. Notably, female B6.MeCP2Tg1 mice exhibited higher autoantibody levels compared to B6 (Figures 2B-D). Interestingly, 59 out of 85 autoantibodies displayed notable correlations with anti-dsDNA antibody levels within each mouse group (Supplementary Table 3). Among all autoantibodies tested, 13 of them exhibited strikingly elevation in both the MRL/lpr and female transgenic mice compared to B6, including the anti-ribosomal P0 (RPLP0), a key CNS autoantibody in NPSLE (Figure 2E). Other significantly elevated autoantibodies including Ku (p70/p80), CK17, M2, EJ, TRS7, cTNT, Cyclin B1, HA, ANXA11, RPLP2, LM and tTG. These findings collectively underscore that B6.Mecp2Tg1 mice, particularly the females, manifest a remarkable upsurge of autoantibodies, similar to a spontaneous murine lupus strain MRL/lpr.
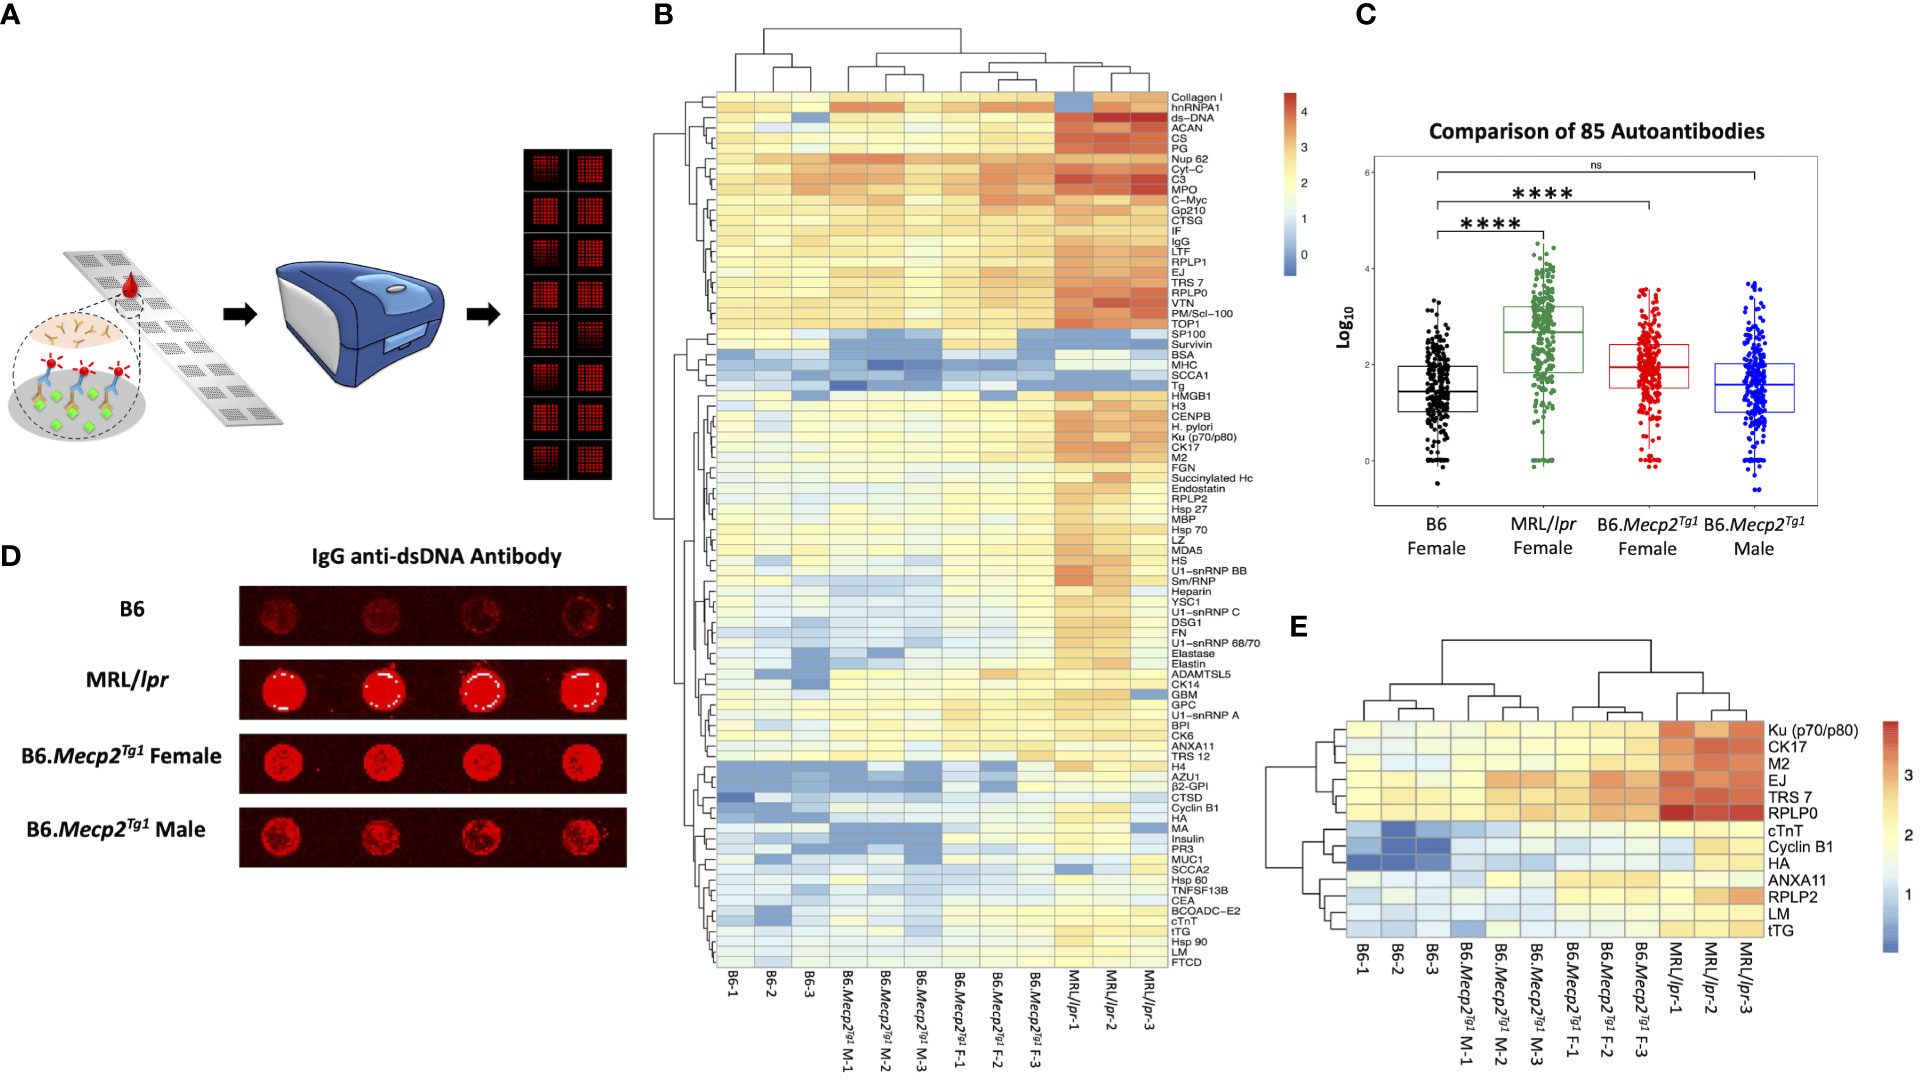
Figure 2 Comprehensive autoantibody profiling across all mice groups at 17-week-old. (A) A schematic depiction of the workflow of the autoantibody array, utilizing fluorescence labeling for detection. (B) Unsupervised HeatMap cluster analysis for the autoantibody levels in all mice groups, effectively demonstrating distinct clustering patterns. (C) Overall comparison of the total 85 autoantibody IgG levels. (D) An example of the IgG anti-dsDNA antibody signal presented on the array slides, wherein antigens were printed in quadruplicate. (E) Representation of remarkably elevated antibodies in both MRL/lpr and female transgenic mice when compared to B6. n = 3 per group at 17-week-old. ****, P < 0.0001. “ns” means no significant change.
3.4 Immune cell subsets and activation status in B6.Mecp2Tg1 miceFlow cytometry was implemented to characterize immune cell phenotypes in splenocytes from the transgenic mice and B6 controls, elucidating alterations in T cells, B cells, myeloid cells, and their respective subsets in the B6.Mecp2Tg1 mice. Figure 3A shows the gating strategy for CD3+ T cells and their subsets, including CD3+CD4+ or CD3+CD8+ T cells, along with their activated CD69+ forms. Notably, the total count of CD3+CD4+ T cells was significantly upregulated in B6.Mecp2Tg1 mice compared to B6 controls while the CD3+CD4+CD69+ activated T cells did not show any substantial changes. No remarkable differences were observed between transgenic mice and B6 controls in CD3+CD4+CD44-CD62L+ naïve T cells or CD3+CD4+CD44+CD62L+ central memory T cells. Conversely, the population of CD3+CD4+CD44+CD62L- effector memory T cells was notably increased, particularly in female B6.Mecp2Tg1 mice (Figure 3B). For CD3+CD8+ T cells, neither the overall count nor any specific cell subsets showed significant changes in the transgenic mice (Supplementary Figure 2A). In addition, the number of B220+CD19+ total B cells, CD21intCD23high follicular B cells, CD21highCD23low marginal zone B cells, CD19+GL7+ germinal center B cells, and B220-CD138+ plasma B cells exhibited no meaningful changes in the transgenic mice when compared to B6 (Figure 3C; Supplementary Figure 2B). Interestingly, in the female B6.Mecp2Tg1 mice, there was a marked increase in the population of CD86+ labeled activated germinal center B cells (CD19+GL7+CD86+) and CD86+ labeled plasma B cells (B220-CD138+CD86+) when compared to B6 controls (Figure 3C). Furthermore, the quantities of CD11b+F4/80+ macrophages, CD11c-CD11b+ cells, and CD11c+CD11b+ dendritic cells remained relatively unchanged in the transgenic mice; however, the female transgenic mice exhibited a notable increase in the count of CD86+ labeled activated CD11b+F4/80+CD86+ macrophages compared to B6 controls (Supplementary Figure 3B; Figure 3C). Additionally, the CD4+CD25+ regulatory T cells did not display any significant differences between transgenic and B6 control mice (Supplementary Figure 3A), as well as CD93+CD23- T1 B and CD93+CD23+ T2 B cells (Supplementary Figure 3A).
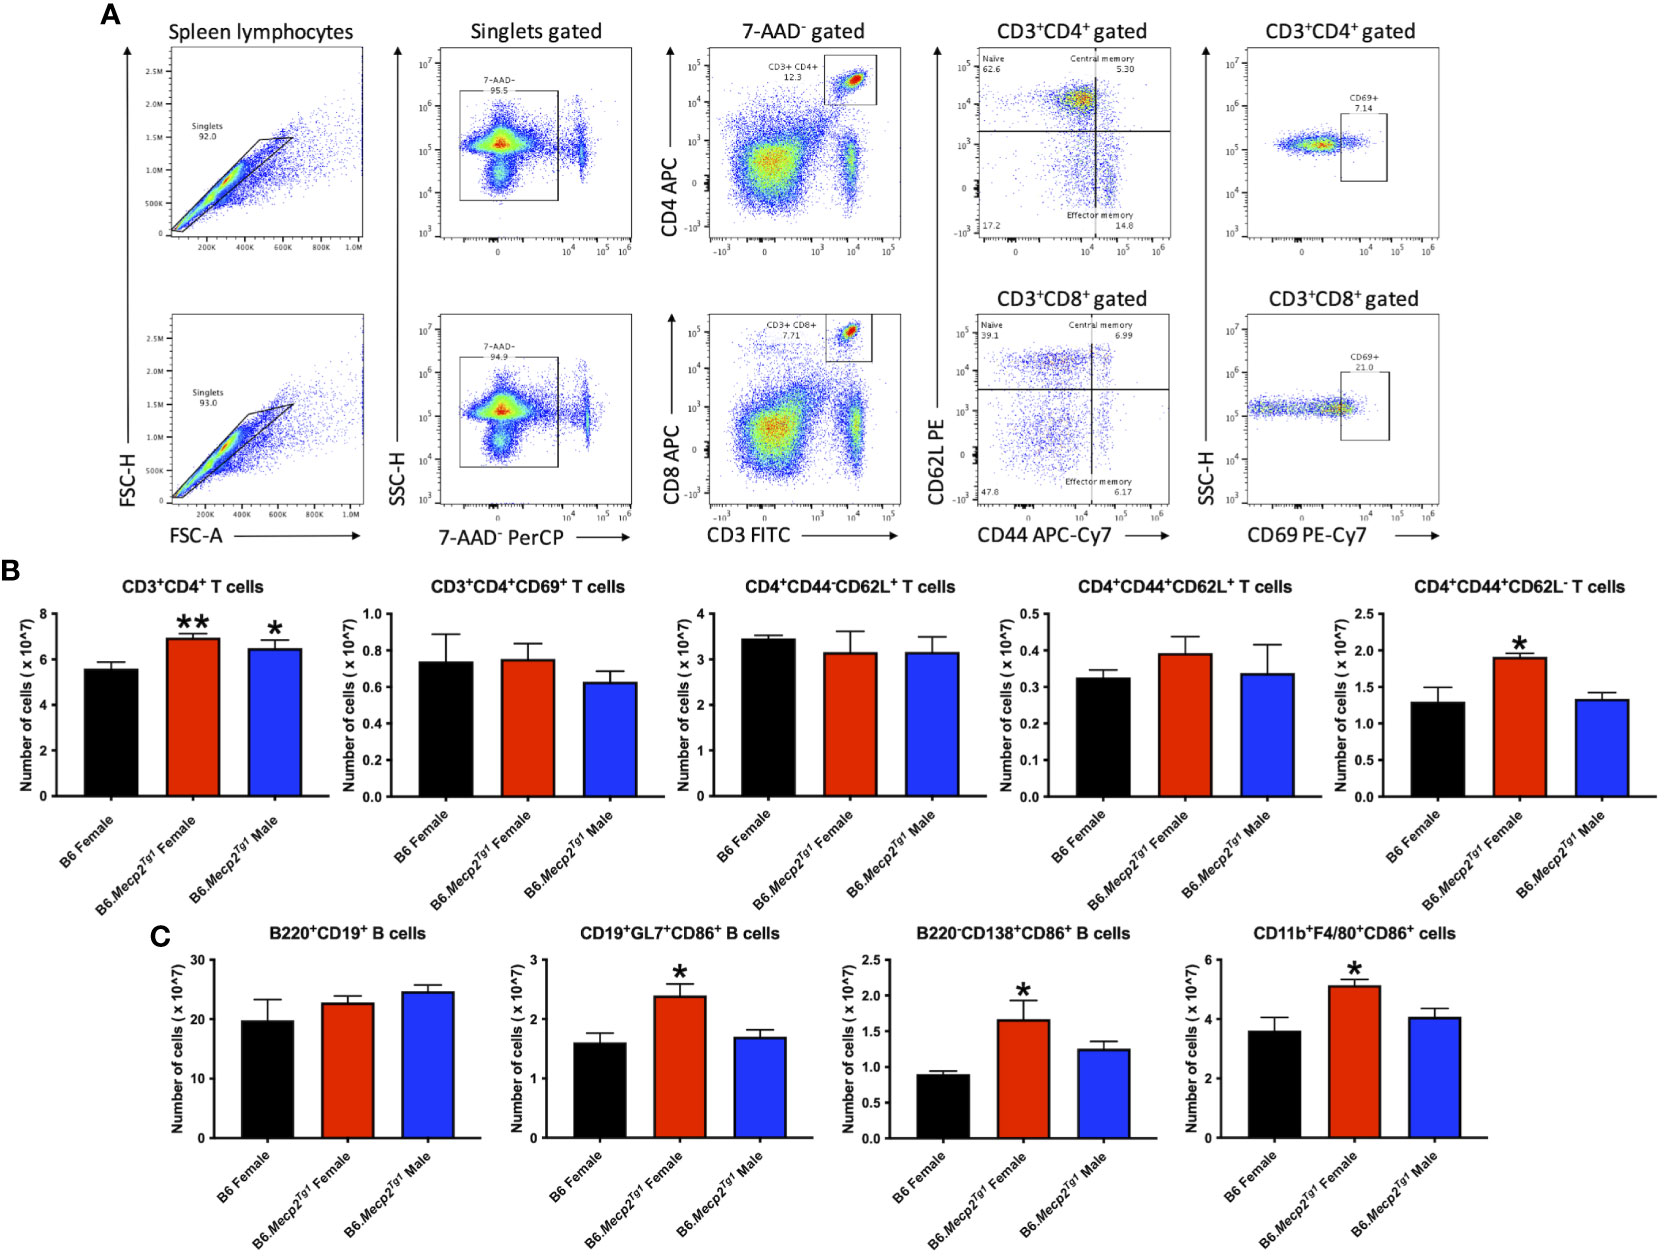
Figure 3 Cell numbers are remarkably changed in CD3+CD4+ T cell subsets and activated B cell subsets in the splenocytes from female B6.Mecp2Tg1 mice compared to B6. (A) Gating strategy of T cell subsets. (B) Cell number changes of CD3+CD4+ and its activation form, as well as the changes of its subsets CD4+CD44-CD62L+ naïve T cells, CD4+CD44+CD62L+ central memory T cells, and CD4+CD44+CD62L- effector memory T cells. (C) Cell number changes of B220+CD19+ total B cells, CD86+ labeled activated CD19+GL7+ germinal center cells, B220-CD138+ plasma B cells, and CD11b+F4/80+ macrophages. n = 3 per group at 17-week-old. *, P < 0.05, **, P < 0.01.
In summary, the increase of splenic effector memory T cells, and the surge of activated germinal center B cells, plasma cells, and macrophages collectively indicated an expanded immune cell population and an activated immune system in the B6.Mecp2Tg1 mice.
3.5 Anxiety-like behavior and locomotor dysfunction in B6.Mecp2Tg1 miceNext, we conducted an open field test to assess anxiety-like behavior and locomotor activity in the transgenic mice. The open field area was divided into three distinct zones: the central, peripheral, and corner zones. The mouse movement was traced and presented (Figure 4A). The results distinctly indicate a remarkable decline in the overall distance traveled by the transgenic mice compared to the B6 controls. Similar reduction in locomotion was observed in spontaneous lupus mouse strain MRL/lpr as early as 9 weeks of age (Figure 4B). Moreover, the prolonged duration of the transgenic mice spent in both the corner and peripheral zones of the open field arena indicated an anxiety-like syndrome and diminished locomotor activity (Figure 4C).
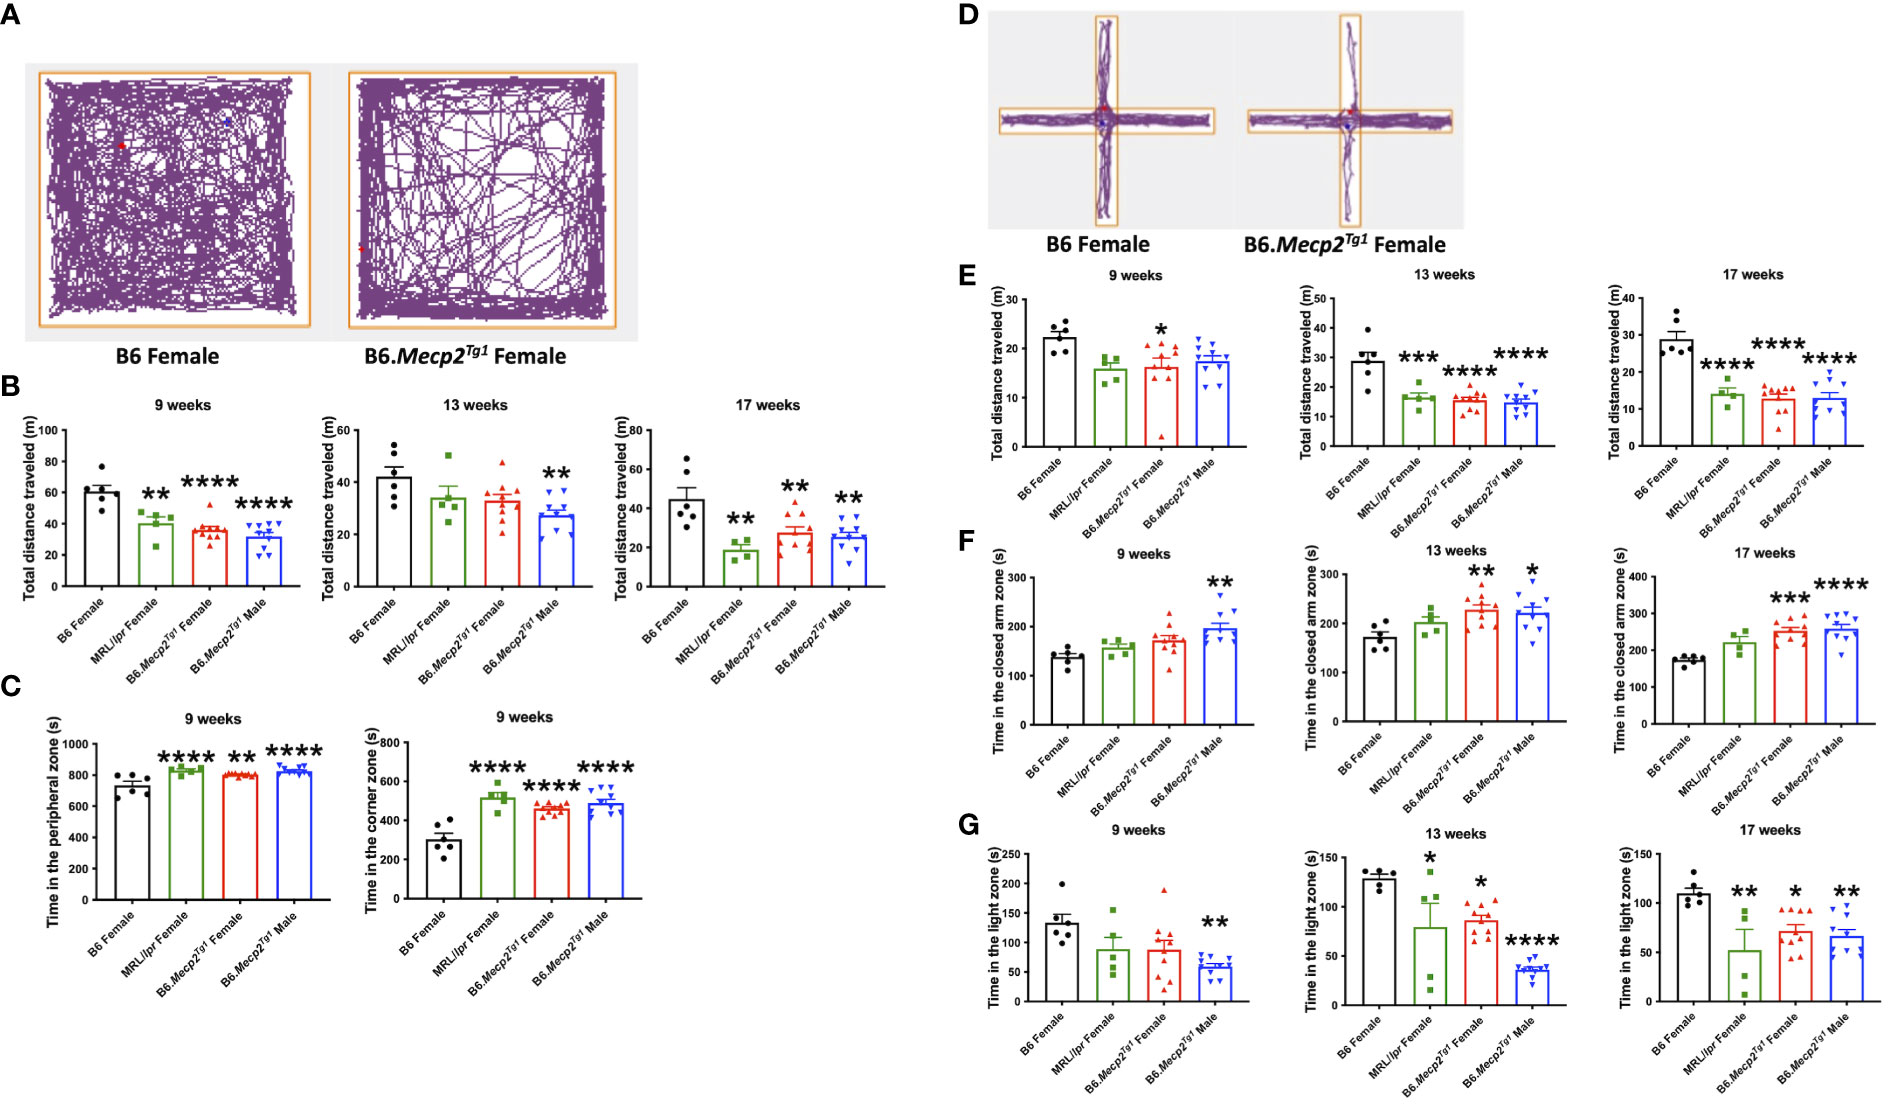
Figure 4 Behavioral assessments indicate decreased locomotor activity and anxiety-like behavior in Mecp2 transgenic mice. (A) The representative movement tracking for B6 and female transgenic mice in the open field test. (B) The total distance that mice traveled in the entire open field arena at different time points. (C) Time in the peripheral zone and corner zones was spent by the mice at 9-week-old. (D) Representative movement tracking for B6 and female transgenic mice in the elevated plus maze test. The orange line demarcates different zones. (E) Total distance traveled by mouse in the elevated plus maze at different time points. (F) Time spent by mice in the closed arms at different time points. (G) Time spent by mice on the light side in the light-dark test at different time points. n = 6 for B6 and MRL/lpr mice; n=10 for both transgenic groups. *, P < 0.05, **, P < 0.01, ***, P < 0.001, ****, P < 0.0001.
The elevated plus maze was used as an additional tool for the assessment of anxiety-like behavior. This maze consists of three zones: the central zone, open arm zone, and closed arm zone. Typical tracing of the mouse movement was shown in Figure 4D. A notable decrease in total distance traveled was observed in female transgenic mice as early as 9 weeks of age, with similar changes emerging in the MRL/lpr and male transgenic mice by 13 weeks of age (Figure 4E). Additionally, male transgenic mice spent significantly more time in the closed arm zone compared to B6 at an early age, whereas a striking increase of time spent in the closed arms was observed at 13 weeks of age for both genders of the transgenic mice and persisted till 17 weeks of age (Figure 4F).
Another test used to interrogate anxiety-like behavior was the light-dark box test. This apparatus comprises two chambers: a transparent light side except for the partition between two sides, and a concealed dark side where the mouse is invisible when inside. A distinct reduction in the time that male transgenic mice spent on the light side was observed at 9 weeks of age. MRL/lpr and female transgenic mice displayed a notable reduction in time spent on the light side starting at 13 weeks of age (Figure 4G). Collectively, these three tests revealed compromised locomotor activity and the emergence of anxiety-like behavior in the transgenic mice at an early age compared to B6 controls.
3.6 Depression-like behavior in B6.Mecp2Tg1 miceDurations of immobility were observed and recorded during the tail suspension test and forced swim test. Intriguingly, both male and female B6.Mecp2Tg1 mice displayed prolonged immobile time than B6 controls at 9 weeks of age in the tail suspension test. This phenotype persisted until 17 weeks of age (Figure 5A). Moreover, in comparison with B6 controls, the immobile time of female B6.Mecp2Tg1 mice were remarkably increased at 13 weeks of age in the forced swim test (Figure 5B). Results from these two tests collectively indicate the presence of depression-like behavior in B6.Mecp2Tg1 mice.
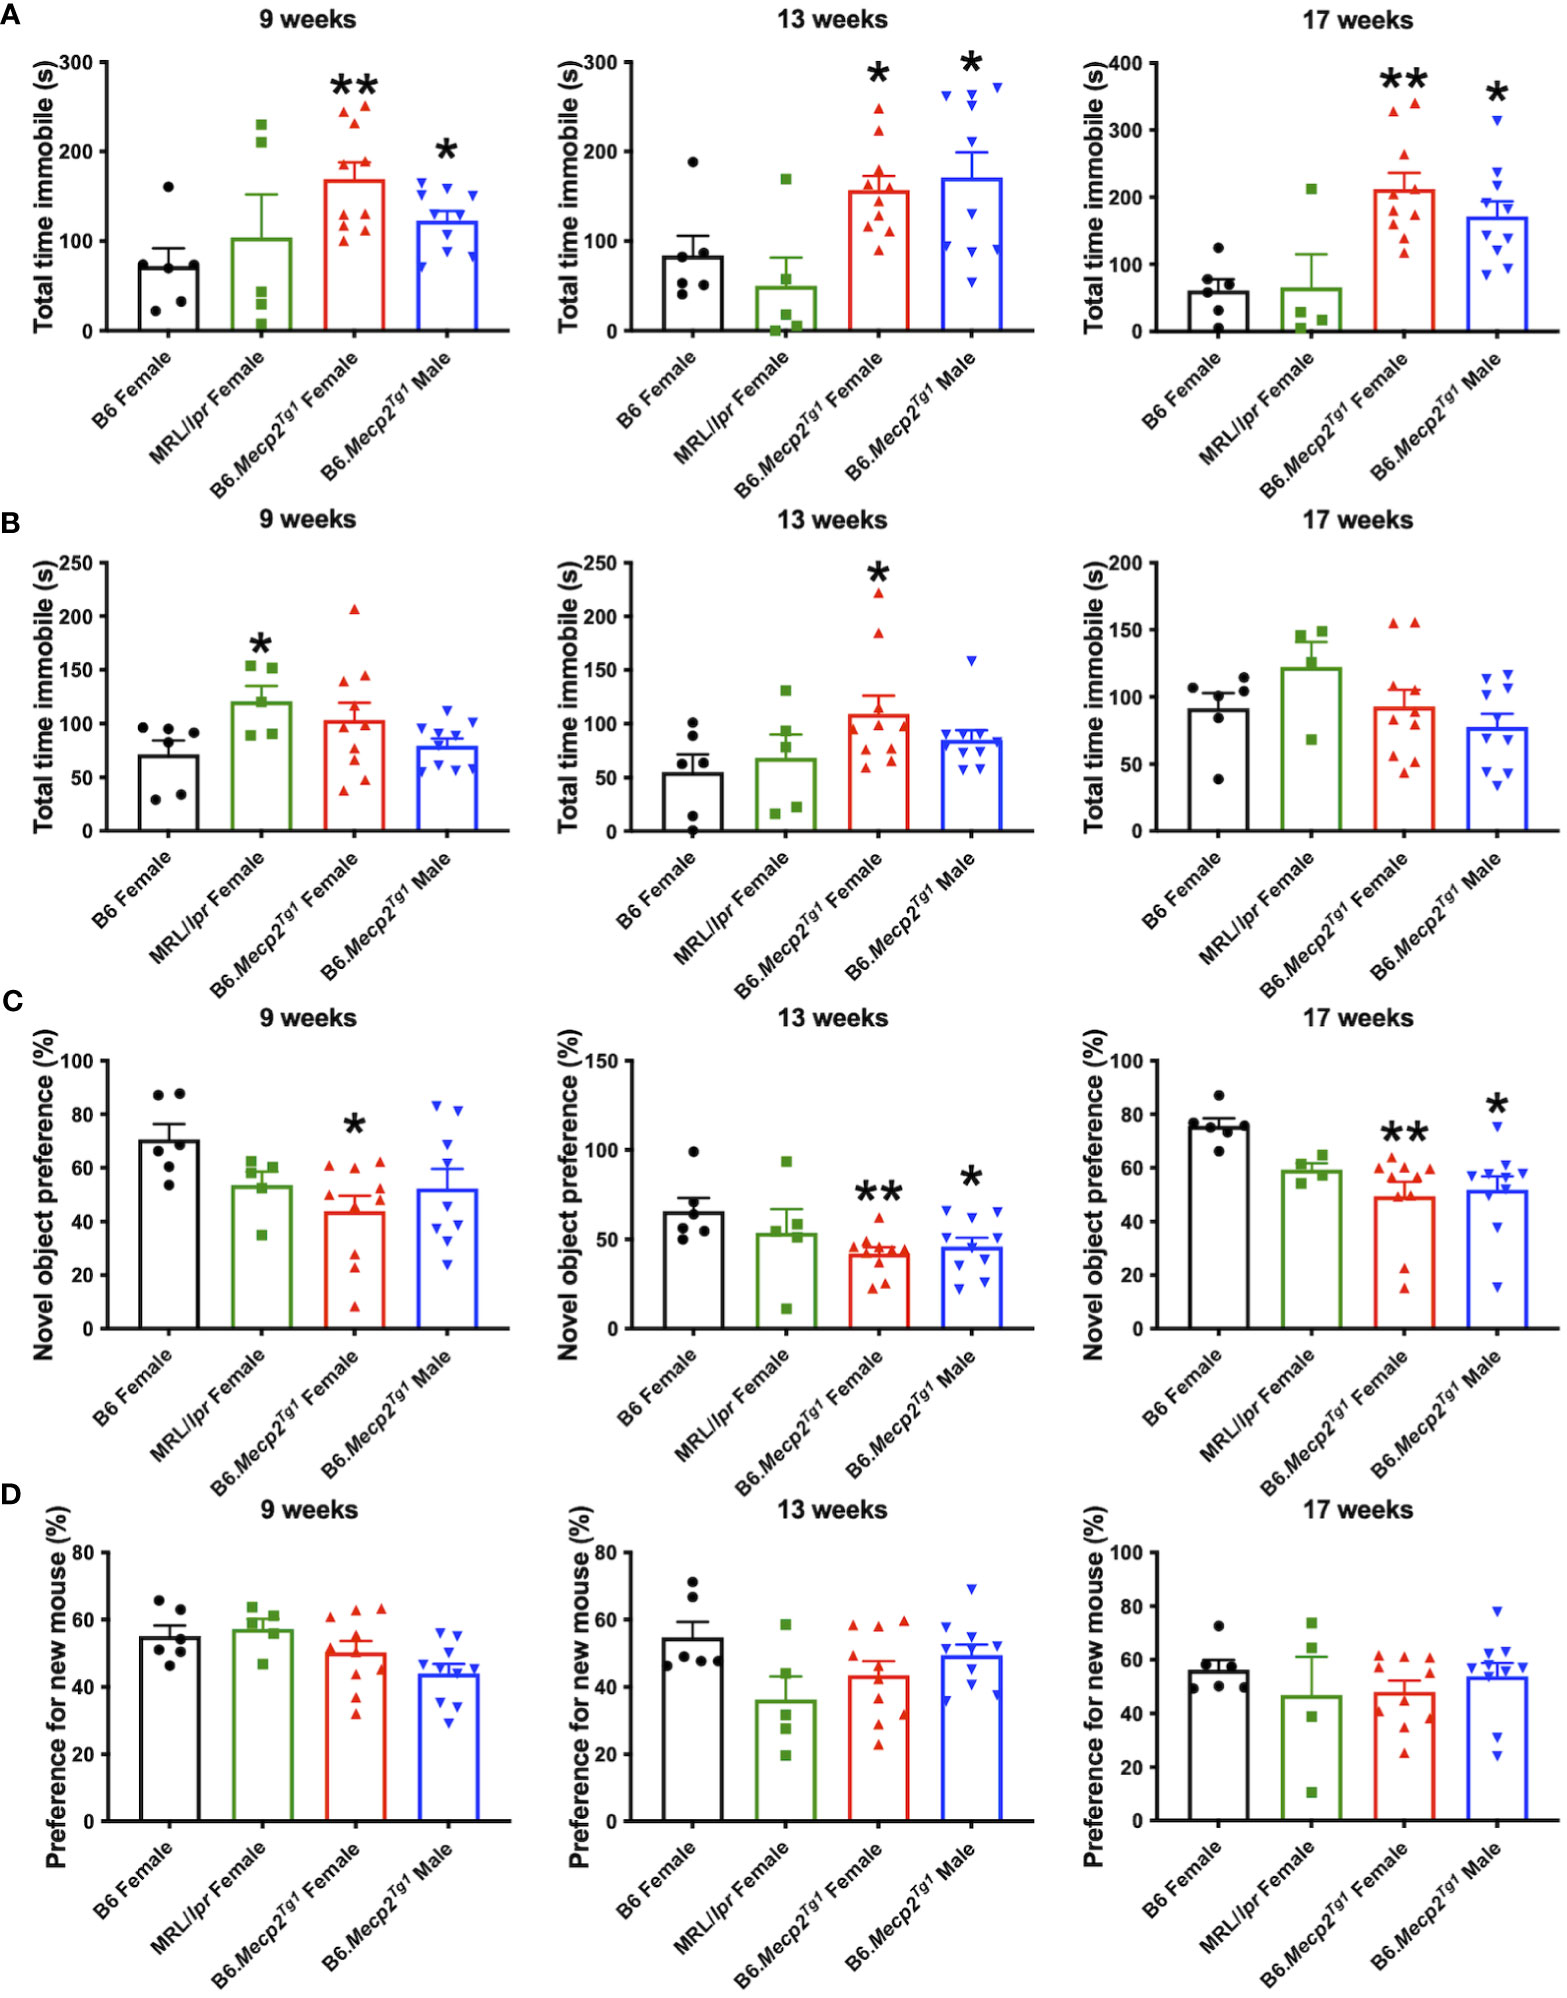
Figure 5 Depression-like behavior and impaired cognitive ability in B6.Mecp2Tg1 mice. (A, B) Immobile time was detected in the tail suspension test and forced swim test at different time points, respectively. (C) Novel object preference was determined in each group of mice at different time points. (D) Preference for the novel social interaction partner mouse was measured at different time points. n = 6 for B6 and MRL/lpr mice; n=10 for both transgenic groups. *, P < 0.05, **, P < 0.01.
3.7 Compromised cognitive and memory function in B6.Mecp2Tg1 miceTo study the potential influence of MeCP2 overexpression on recognition and memory function of the mice, we conducted the object recognition test to assess their short-term memory capabilities. We found female B6.Mecp2Tg1 mice presented significantly reduced preference for the novel object compared to B6 controls, starting at 9-week-old. However, the male B6.Mecp2Tg1 mice displayed a slight delay in the onset of reduced novel object preference (Figure 5C). Subsequently, the social abilities of these mice were also evaluated through the social interaction test. Similar to the object recognition test, preference for the novel mouse was used to assess the social ability across all mice groups. Interestingly, neither MRL/lpr mice nor the Mecp2 transgenic mice exhibited abnormality in novel mouse preference, indicating intact social abilities in these mice groups (Figure 5D).
Through all the behavior tests above, we found that the B6.Mecp2Tg1 mice exhibited an early onset of multiple abnormal behaviors, including reduced locomotor activity, the onset of anxiety-like behavior and depression-like behavior, as well as compromised recognition and short-term memory abilities.
3.8 Impaired neurogenesis in the hippocampus region of B6.Mecp2Tg1 miceTo comprehend the neuropathology underlying the observed behavioral changes in the Mecp2 transgenic mice, we delved into potential pathological changes across various brain regions using immunofluorescence. Specifically, we focused on the subgranular zone (SGZ) within the mouse hippocampus and the choroid plexus region (Figure 6A). The MeCP2+/DAPI+ cells (cyan colored) exhibited predominant expression exclusively within the transgenic mice, with notable localization of MeCP2 primarily within the granule cell layer (GCL) of the hippocampus region (Figure 6B). Compared to B6, the total dendritic length of newborn neurons was notably diminished in the male Mecp2 transgenic mice, accompanied by a reduction in the soma area in both genders of the Mecp2 transgenic mice. These changes were mirrored in the MRL/lpr mice as well (Figures 6B–D). More importantly, both female and male transgenic mice displayed a more pronounced decline of soma area when compared to MRL/lpr (Figure 6D). Furthermore, the thickness of the granule cell layer (GCL) was also remarkably decreased in the Mecp2 transgenic mice (Figure 6E). Collectively, these findings provide compelling evidence of compromised neurogenesis in the Mecp2 transgenic mice.
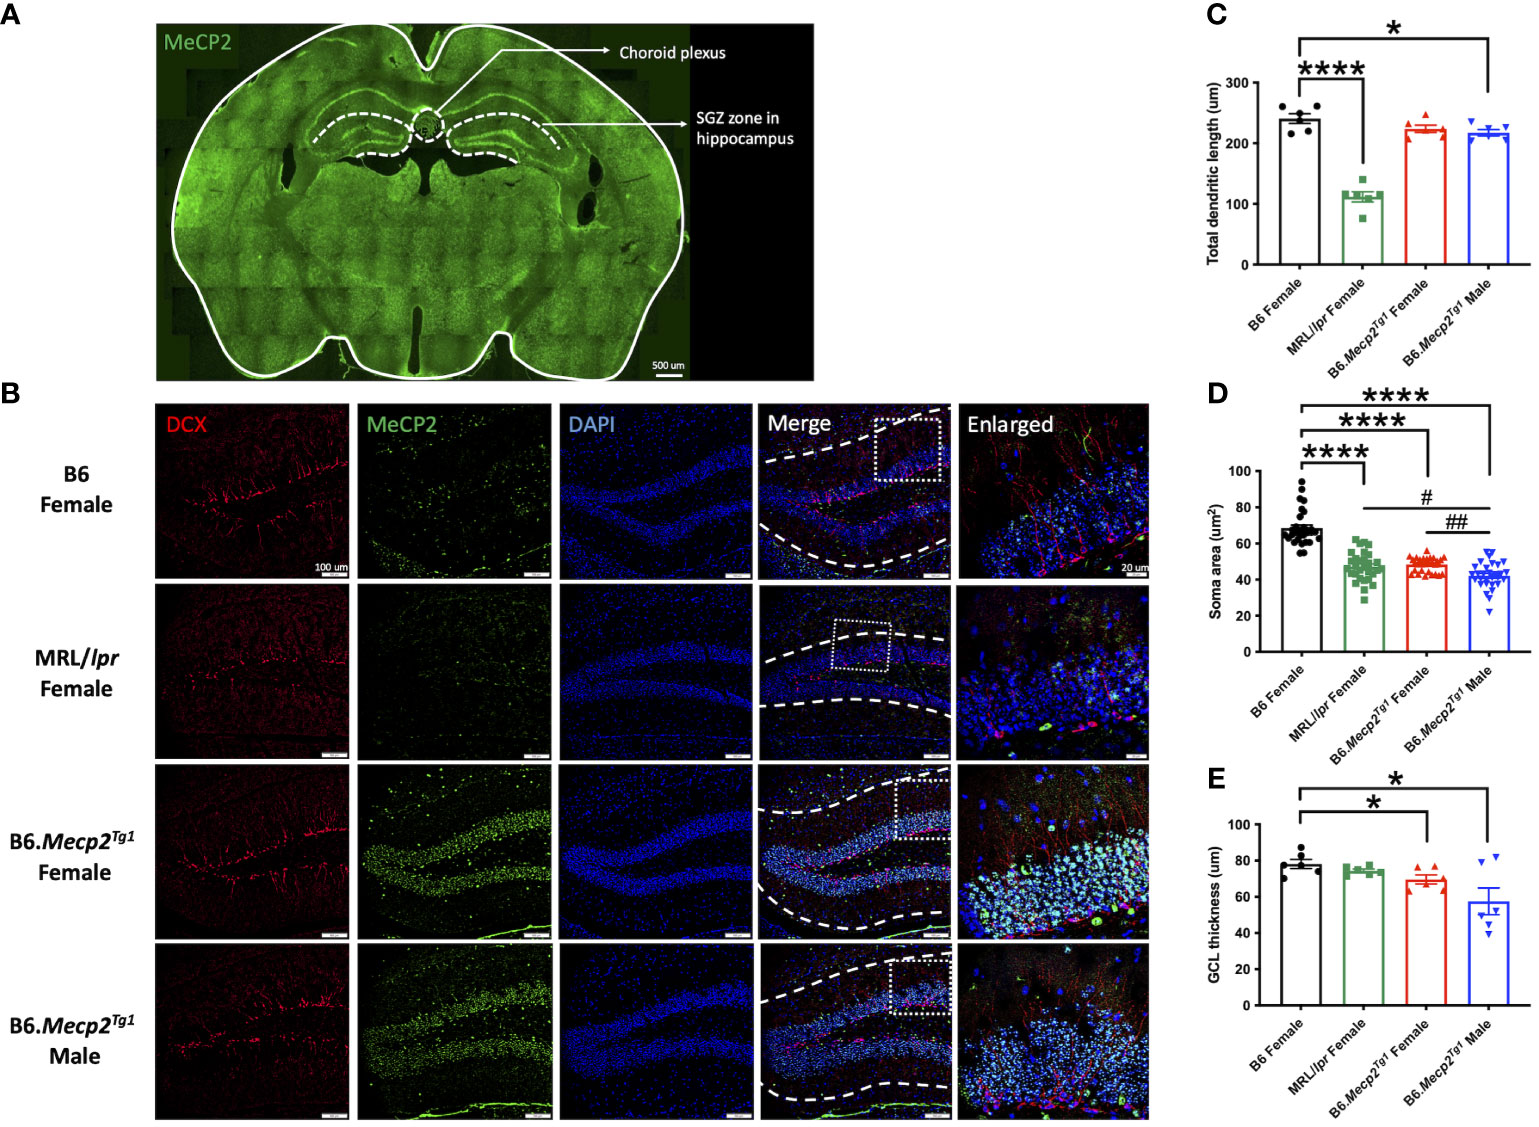
Figure 6 Impact of MeCP2 overexpression on neurogenesis in the hippocampus. (A) MeCP2 expression in a whole-brain section of a female B6.Mecp2Tg1 mouse. Green, MeCP2. Dashed lines demarcate distinct functional brain regions. Scale bar: 500 μm. (B) Assessment of neurogenesis within the SGZ of the hippocampus region. Red, doublecortin (DCX) labeled newborn neurons; green, MeCP2; blue, DAPI labeled nuclei; fourth column, merged images from the preceding three columns. White dashed lines in the fourth column delineate the extent of dendrite length in newborn neurons. Scale bar: 100 μm. The fifth column displays an enlarged view of the area marked by the dashed rectangular in the previous column. Scale bar: 20 μm. (C-E) Analysis of total dendritic length, soma area of newborn neurons, and the thickness of granule cell layer (GCL). Three mice per group were studied at 17-week-old, and both sides of the hippocampus were analyzed. *, P < 0.05, ****, P < 0.0001; #, P < 0.05, ##, P < 0.01. * means a significant difference compared to B6, and # means notable difference compared to MRL/lpr mice.
Next, we investigated the specific cell type responsible for MeCP2 expression within the brain. Double immunofluorescence staining was performed to observe the co-localization of MeCP2 with major neural cell markers in the SGZ of a female transgenic mouse. The utilized neural cell markers encompassed glial fibrillary acidic protein (GFAP) for astrocytes, ionized calcium-binding adaptor molecule 1 (Iba1) for microglia, doublecortin (DCX) for newborn neurons, and neuronal nuclear protein (NeuN) for mature neurons. The findings demonstrated pronounced MeCP2 expression in NeuN-positive mature neurons, while no MeCP2 expression was observed in other cell types (Supplementary Figure 4).
3.9 Neuroinflammation in the brain of B6.Mecp2Tg1 micePrior results showed that the MeCP2 overexpression might impact the neurogenesis in the transgenic mice. However, the relationship was not direct, as
留言 (0)