
記住我


Multiple sclerosis (MS) is a chronic inflammatory demyelinating disorder of the central nervous system. Although remyelination occurs, mainly during the early phase of the disease, it remains incomplete and even declines with disease duration and aging, underpinning neurodegeneration (Dulamea, 2017; Yeung et al., 2019).
The myelin sheath is a lipid membrane formed by mature oligodendrocytes (OLs) that spirally wrap around axons to facilitate neuronal conduction and protect axonal integrity (Simons and Nave, 2016). OLs originate from oligodendrocyte progenitor cells (OPCs). The adult brain has a pool of OPCs in the subventricular zone as well as in the surrounding intact gray and white matter that can migrate to the site of myelin turnover and differentiate into mature OLs (Miller, 2002; Hughes et al., 2013; Young et al., 2013; Perlman et al., 2020; Donega et al., 2022). However, in MS, over time OPCs are depleted and fail to migrate and/or differentiate properly as demonstrated by the presence of fewer and often undifferentiating OPCs alongside the loss of mature OLs and the apparent unreceptiveness of axons to remyelination within chronic MS lesions (Wolswijk, 2000; Chang et al., 2002; Kuhlmann et al., 2008; Fancy et al., 2011; Tepavčević and Lubetzki, 2022). Moreover, the myelin sheath formed by remyelination is thinner and extends over a shorter internode distance (Prineas et al., 1993). Demyelination or improper remyelination results in neuro-axonal degeneration, which in turn leads to brain and spinal cord atrophy (Wang C. et al., 2019). Additionally, ongoing demyelination within chronic active (slowly expanding) lesions, characteristic of smoldering MS, is clinically associated with relapse-free disability worsening and disease progression, a process referred to as progression independent of relapse activity (PIRA) (Cree et al., 2019; Elliott et al., 2019; Kappos et al., 2020). While the number of disease-modifying therapies (DMTs) has gradually increased over the last two decades, all of them target the immune system, and clinical research on remyelination-enhancing agents is still very preliminary (Gingele and Stangel, 2020). So far, there is no DMT directly promoting remyelination, which can slow down neurodegeneration and disease progression (Piehl, 2021).
MicroRNAs are small non-coding RNAs that regulate gene expression post-transcriptionally by binding to a complementary seed of their target messenger RNA (mRNA), mostly located in its 3′ untranslated region (3’UTR) (Bartel, 2004). MicroRNAs play a largely acknowledged role in physiological and pathophysiological processes (Bushati and Cohen, 2007) and are also involved in regulating central nervous system myelination. Dynamic changes in the microRNA expression profile finely tune OPC/OL development (Lau et al., 2008; Letzen et al., 2010; Barca-Mayo and Lu, 2012). miR-219, miR-338, and miR-138 promote early OPC differentiation into OLs by targeting OPC proliferation genes. Yet, while miR-219 plays a supporting role up to the late stage of differentiation, miR-138 delays it (Dugas et al., 2010; Zhao et al., 2010). Transgenic mice with OPC/OL-specific Dicer1 ablation, an indispensable endonuclease in microRNA biogenesis, develop tremor and ataxia due to myelination defects (Bartel, 2004; Dugas et al., 2010; Zhao et al., 2010). miR-219, the strongest induced microRNA in differentiating OLs, can partially rescue Dicer1 ablation and improve both lysolecithin-induced demyelination and experimental autoimmune encephalomyelitis (EAE) (Dugas et al., 2010; Wang et al., 2017). Furthermore, miR-219 and miR-338 have been found to be upregulated in normal-appearing white matter but downregulated in inactive white matter lesions of MS patients, and miR-219 is more often undetectable in the cerebrospinal fluid (CSF) of MS patients than controls (Bruinsma et al., 2017; Teuber-Hanselmann et al., 2020). Finally, microRNA dysregulation has been linked to MS (Martin and Illes, 2014). We have previously found 18 microRNAs dysregulated in the CSF of relapsing and/or remitting MS patients, of which 5 have still not been described in MS so far (miR-15a-3p, miR-33a-3p, miR-34c-5p, miR-124-5p, and miR-297) (Perdaens et al., 2020).
Therefore, we hypothesize that these MS-related microRNAs possibly affect OPC differentiation. We thus aimed to screen the effect of a series of these microRNAs on the differentiation of CG-4 cells, a bipotential OPC cell line. We then focused on the microRNAs exhibiting the strongest effect—miR-33-3p, miR-34c-5p, miR-124-5p, miR-145-5p, and miR-214-3p—to further characterize their action on CG-4 differentiation by staging the transfected cells both at the mRNA and protein level and by phenotyping changes via Gene Ontology enrichment analysis. We finally aimed to identify potential mRNA targets by crossing the data of in silico analysis and RNA sequencing, which we confirmed by independent RT-qPCR analyses, and propose several mechanisms supporting their effect on OPC differentiation via their predicted targets.
2 Methods 2.1 Cell cultureWe kindly received the Central Glia-4 (CG-4) cells, a permanent cell line derived from rat bipotential oligodendrocyte-type 2-astrocyte (O-2A) progenitor cells (Louis et al., 1992), and the B104 neuroblastoma cells from Dr. M. Grãos (University of Coimbra, Portugal). For CG-4 cell culture, T175 culture flasks or 6-well plates were coated with poly-L-lysine (P2636, Sigma-Aldrich) at 0.04 mg/mL for 30 min at 37°C and washed twice with autoclaved deionized water and once with sterile Dulbecco’s phosphate buffered saline (DPBS, L0615-500, BioWest). Cells were first plated for 30–60 min in Dulbecco’s Modified Eagle Medium (DMEM, L0101-500, BioWest) containing 100 UI/mL penicillin, 100 μg/mL streptomycin (15140-122, Gibco), and 2.5 μg/mL amphotericin B (15290-018, Gibco) (PSA-DMEM) supplemented with 5% fetal bovine serum (FBS, S15898S181H, Gibco), 5 μg/mL human insulin (I9278, Sigma-Aldrich), 2 mM sodium pyruvate (11360–039, Gibco), and 10 mM Hepes (15630-056, Gibco), called recovery medium. Hereafter, CG-4 cells were cultured in a proliferation medium consisting of PSA-DMEM supplemented with 30% B104 conditioned medium containing the essential mitogens, 50 μg/mL human apo-transferrin (T2036, Sigma-Aldrich), 9.8 ng/mL biotin (B4639, Sigma-Aldrich), 40 ng/mL sodium selenite (S5261, Sigma-Aldrich), 5 μg/mL human insulin, and 10 mM Hepes to allow OPC proliferation (Lourenço et al., 2016). To promote their differentiation into OLs, they were cultured in DMEM containing penicillin-streptomycin and 1% GlutaMAX™ supplement (35050-061, Gibco) and supplemented with 5 μg/mL bovine insulin (I6634, Sigma-Aldrich), 50 μg/mL human holo-transferrin (T0665, Sigma-Aldrich), 2% B-27™ supplement (080085-SA, Gibco), 0.5% FBS, 0.05 μg/mL recombinant rat ciliary neurotrophic factor (CNTF, 450-50, PeproTech), 1% OL-supplement, and 10 mM Hepes, called differentiation medium (O’Meara et al., 2011).
B104 conditioned medium was recovered from the culture medium of B104 cells cultured in uncoated T175 flasks at a cell density of 15,000 cells/cm2 for 24 h in PSA-DMEM-F12 medium (L0090-500, BioWest) supplemented with 10% FBS and for 72 h in PSA-DMEM-F12 medium supplemented with 10 μg/mL human holo-transferrin, 5 ng/mL sodium selenite, 16 μg/mL putrescine dihydrochloride (P5780, Sigma-Aldrich), and 6.3 ng/mL progesterone (P8783, Sigma-Aldrich). The latter medium was recovered and centrifuged at 1000 × g for 10 min. The supernatant was filtered (0.22 μm) with 1 μg/mL phenylmethylsulfonyl fluoride (a protease inhibitor, 36978, Thermo Fisher Scientific) and stored at −20°C upon use (Lourenço et al., 2016).
2.2 MicroRNA mimic and inhibitor transfection 2.2.1 Double transfection of microRNA mimicsCG-4 cells were plated (day-1) overnight in the proliferation medium at a cell density of 250,000 cells per well in a pre-coated 6-well plate and were separately transfected on day 0 for 6 h and on day 4 for 48 h following the manufacturer’s recommendations. In brief, the miRCURY LNA microRNA mimic or negative control (miR-NC) (Qiagen, Supplementary Table S1B) was diluted in 50 μL Opti-MEM™ reduced serum medium (51985026, Thermo Fisher Scientific) for a final concentration of 40 nM (in culture well) and added on top of 50 μL Opti-MEM™ containing 3 μL Lipofectamine™ 2000 Transfection Reagent (Thermo Fisher Scientific), mixed gently by reverse pipetting (15×) and incubated at room temperature for 5–10 min. This transfection mix (100 μL) was then added dropwise to 900 μL of proliferation medium for 6 h. After 6 h, the medium was replaced by 1.5 mL of proliferation medium. On day 1, the proliferation medium was replaced by 1.5 mL of differentiation medium, of which two-thirds were refreshed on day 4 before the second transfection, which was processed similarly in 1,000 μL total volume, but after 6 h of transfection, 500 μL of fresh differentiation medium was added for an additional 48 h, leaving the transfection mix in the culture wells. Cells were collected on day 6 for RNA extraction.
2.2.2 Single transfection of microRNA mimicsOn day-1, CG-4 cells were plated at a cell density of 75,000 cells on a pre-coated glass coverslip placed in a 24-well plate (for immunocytochemistry analysis) or at a cell density of 250,000 cells per well in a pre-coated 6-well plate (for RT-qPCR analysis) for 1 h in the recovery medium and for approximately 20 h in the proliferation medium. On day 0, the cells were transfected with 40 nM miRCURY LNA microRNA mimic or miR-NC (final concentration in culture well) for 6 h (Qiagen) using Lipofectamine™ 2000 according to the manufacturer’s protocol (40 nM mimic/1.2 μL Lipofectamine in 40 μL Opti-MEM™ added to 360 μL of proliferation medium in 24-well plate and 40 nM mimic/3 μL Lipofectamine in 100 μL Opti-MEM™ added to 900 μL of proliferation medium in 6-well plate). After 6 h, the medium was replaced by the differentiation medium (500 μL and 1.5 mL, respectively), and cells were kept in culture for 48 h.
2.2.3 Sequential transfection of microRNA mimics and inhibitorsCells were plated similarly in pre-coated 6-well plates (day-1) and transfected on day 0 with 40 nM LNA miRCURY microRNA mimic for 4 h followed by a second transfection without (mock transfection with Lipofectamine™ 2000 only) or with 40 nM of the corresponding miRCURY LNA microRNA inhibitor (Qiagen, Supplementary Table S1B) for 4 h (without refreshing the medium) using Lipofectamine™ 2000 (40 nM mimic or inhibitor/2 μL Lipofectamine in 50 μL Opti-MEM™ added to 900 μL of proliferation medium in 6-well plate). The medium was then replaced by 1.5 mL of differentiation medium to culture the cells for an additional 48 h.
In all transfection protocols, the proliferation and differentiation vehicle control conditions were processed similarly but transfected with Lipofectamine™ 2000 alone, without microRNA mimic/inhibitor. The proliferation vehicle control was cultured similarly in the proliferation medium only. For each transfection method, three independent experiments were performed with each condition in triplicate.
For endogenous microRNA analysis, cells were plated at a cell density of 100,000 cells per well in a pre-coated 6-well plate. The cells were cultured for 3 days in total in proliferation and/or differentiation medium following the same timing as mentioned in section 2.2.2 and did not undergo any other treatment. Four independent experiments were performed with each condition in triplicate.
2.3 RNA and microRNA extraction and RT-qPCRThe culture medium was removed from the 6-well plates, and the wells were washed with 1 mL DPBS. For RNA extraction, TriPure™ Isolation Reagent (Roche) was added to the wells, and the plates were stored for a minimum of 30 min at −80°C to help with the cell lysis. RNA was then extracted following the manufacturer’s protocol except for the precipitation step, the samples were stored for 2 h in isopropanol at −20°C to help with RNA precipitation before being centrifuged. RNA concentration and purity were verified by spectrophotometry (Shimadzu BioSpec-nano Spectrophotometer), and 500 ng RNA was reverse transcribed using iScript™ cDNA Synthesis Kit (Bio-Rad). MicroRNAs were extracted with QIAzol lysis reagent (Qiagen) following the miRNeasy Mini Kit protocol with RPE and RWT buffer (Qiagen), but we used Enzymax RNA Mini spin columns (EZCR101, Enzymax) instead. RNA concentration and purity were verified by spectrophotometry and set at an equal concentration of 50 ng/μL for all samples. MicroRNAs were reverse transcribed using miRCURY LNA RT (Qiagen). We performed the real-time quantitative polymerase chain reactions (RT-qPCR) using Takyon™ No ROX Probe 2X MasterMix Blue dTTP (Eurogentec) for mRNAs and miRCURY LNA SYBR Green PCR kit (Qiagen) for microRNAs on a RotorGene (Qiagen). Primers are listed in Supplementary Tables S1A,B. The specificity was verified with the melt curves. The relative expression was determined by the 2−ΔΔCt method (with ΔΔCt = ΔCt [target m(i)RNA-reference]sample − mean ΔCt [target m(i)RNA-reference]differentiation (vehicle) control) (Livak and Schmittgen, 2001). We used hypoxanthine phosphoribosyltransferase 1 (Hprt1) as the reference gene for the mRNAs and miR-103a-3p for the microRNAs.
2.4 RNA sequencingRNA sequencing (by synthesis) and the primary bio-informatic analyses were performed by Novogene United Kingdom. All samples of a single experiment with each condition in triplicate (proliferation and differentiation vehicle control, miR-33-3p, miR-34c-5p, miR-124-5p, miR-145-5p, miR-214-3p, and miR-NC cultured in the differentiation medium) passed the pre-sequencing sample quality control with an RNA integrity number between 9 and 9.4 (Agilent 5400), as well as the post-sequencing data quality control with an average of 98.67% clean reads [98.15–98.93% (min-max)], 97.43% Q20 (96.28–97.97%), and 93.04% Q30 (91.23–94.30%). However, one miR-NC replicate was finally excluded from the analysis as it appeared as an outlier. This sample had the lowest Q20 and Q30 percentage.
For library preparation, mRNA was purified from total RNA using poly-T oligo-attached magnetic beads. After fragmentation, the first cDNA strand was synthesized using random hexamer primers, the second using either dUTP for the directional library or dTTP for the non-directional library, followed by end repair, A-tailing, adapter ligation, size selection, USER enzyme digestion (for the directional library only), amplification, and purification. The libraries, quantified with Qubit and real-time PCR and verified by bioanalyzer for size distribution, were pooled and sequenced on Illumina NovaSeq 6000 to generate 150 bp paired-end reads. Twelve gigabytes of raw data (fastq format) were yielded per sample and processed through the fastp software. Clean reads were obtained by removing low-quality reads and reads containing adapter or poly-N. Paired-end clean reads were aligned to the improved rat reference genome (mRatBN7.2) using HISAT2 v2.0.5. The mapped reads of each sample were assembled by StringTie (v1.3.3b), and the number of reads mapped to each gene was counted with featureCounts v1.5.0-p3. Fragments per kilobase million (FPKM) of each gene were calculated based on the length of the gene and the reads count mapped to this gene.
Differential expression analysis between two conditions was performed using the DESeq2 R package (1.20.0). Gene Ontology (GO) enrichment analysis of differentially expressed genes was implemented with the cluster Profiler R package, with correction of gene length bias. The p-values were corrected for the false discovery rate by Benjamini and Hochberg’s approach. Differentially expressed genes (DEG) and enriched GO terms were significant if the adjusted p-value was ≤0.05.
2.5 ImmunocytochemistryCells were fixed the first time with 4% homemade paraformaldehyde (PFA; 1.04005.1000, Merck) while still in the culture medium (1:2 volumes) for 10 min. The medium was discarded, and cells were fixed a second time in plain 4% PFA at room temperature for 10 min. There were three staining conditions: (1) surface staining of O4 (hybridoma supernatant, AK3203/01, In Vivo BioTech) or A2B5 (hybridoma supernatant, CRL-1520, ATCC); (2) intracellular staining of Gfap (ab16997, Abcam) and Mbp (ab7349, Abcam); and (3) intranuclear staining of Pcna (2586, Cell Signaling Technology). For the surface staining of O4 (dilution 1/15) and A2B5 (dilution 1/25), cells were first blocked for 1 h with 5% bovine serum albumin (BSA; A7906, Sigma-Aldrich), then incubated for 1 h with the primary antibody and for 2 h with the secondary antibody [dilution 1/1000; goat anti-mouse IgM Alexa Fluor (AF) 488 (A21042, Thermo Fisher Scientific) and AF647 (A21238, Thermo Fisher Scientific) respectively] in 1% BSA. Then, cells were fixed again. For the intracellular staining of Gfap (dilution 1/500) and Mbp (dilution 1/500) or the intranuclear staining of Pcna (dilution 1/2400) separately, cells were blocked and permeabilized with 0.3% Triton X-100 (T8787, Sigma-Aldrich) and 5% BSA for 1 h. Moreover, for Pcna, this step was preceded by a permeabilization with 100% methanol for 10 min at −20°C. Cells were then incubated overnight at 4°C with the primary antibodies and 2h at room temperature with the secondary antibodies (dilution 1/1000; AF488 goat anti-rabbit IgG (A-11008, Thermo Fisher Scientific) and AF555 goat anti-rat IgG (A21434, Thermo Fisher Scientific), or AF488 goat anti-mouse IgG (A-11001, Thermo Fisher Scientific), respectively) in 0.3% Triton X-100 and 1% BSA. Then, the coverslips were mounted on VWR® Superfrost® Plus Micro Slide using ProLong™ Gold Antifade Mountant with DAPI (Thermo Fisher Scientific). All buffers were prepared with DPBS containing calcium and magnesium (14080-055, Gibco). All steps were performed at room temperature, except the overnight incubation, and cells were washed three times in between steps, except once after methanol permeabilization and not after blocking. The mounted coverslips were scanned by the Zeiss Axio Scan.z1, and the QuPath open-source software (version 0.4.0.) was trained to count distinctively the marked cells, except for Gfap (Bankhead et al., 2017). Gfap expression was estimated to the total number of cells by visualizing grid-wise each coverslip and scored as 0 = no Gfap-positive (Gfap+) cells, 1 = a few Gfap+ cells scattered over the whole coverslip, 2 = a few Gfap+ cells congregated in a few grids of the coverslip, 3 = a few Gfap+ cells in several grids of the coverslip, 4 = many Gfap+ cells in several grids of the coverslip, and 5 = many Gfap+ cells over the whole coverslip. The evaluator was blinded to the experimental conditions.
Each staining was performed on a single replicate per condition within each experiment, repeated three to five times. The specificity of the primary antibodies was verified by staining a differentiation vehicle control condition with the secondary antibody/antibodies only, correspondingly to each staining condition within each experiment.
2.6 In silico analysisWe interrogated 4 databases for the predicted mRNA targets of each investigated microRNA separately: miRDB, TargetScanHuman 8.0, DIANA-microT-CDS, and miRWalk 3 (Paraskevopoulou et al., 2013; Sticht et al., 2018; McGeary et al., 2019; Chen and Wang, 2020). We preselected targets predicted by at least three databases for both Rattus norvegicus and Homo sapiens and also found downregulated by the RNA sequencing analysis as compared to the differentiation vehicle control and miR-NC conditions. We checked using a PubMed search (“mRNA-target name + oligodendrocyte”) if these were involved accordingly in OPC differentiation, i.e., if their downregulation could explain the effect of the microRNA, or checked if they were listed in the gene annotations of downregulated Gene Ontology/Biological Process terms of interest.
2.7 Statistical analysisWe used GraphPad Prism 8.0.2 for all statistical analyses. Outliers identified by Grubb’s test were excluded (max 1/condition). Normality was verified by the D’Agostino & Pearson test, and a parametric (ordinary or Brown–Forsythe in case of significantly different standard deviations) or a non-parametric (Kruskal–Wallis) one-way ANOVA was performed accordingly. Dunnett’s (parametric analysis) or Dunn’s (non-parametric analysis) multiple comparison post-test was used to compare all conditions to the differentiation vehicle control or the differentiation miR-NC, Sidak’s, Tamhane’s T2, or Dunn’s multiple comparisons post-test was used as recommended to compare the mimic condition to its inhibitor. A non-parametric Mann–Whitney U-test was performed for the statistical analysis of the relative expression of endogenous microRNAs between the proliferation and differentiation control conditions. For plots built in R, we used the packages “cowplot,” “gplots,” “ggplot2,” “grid,” “gridExtra,” “patchwork,” and “stringr.”
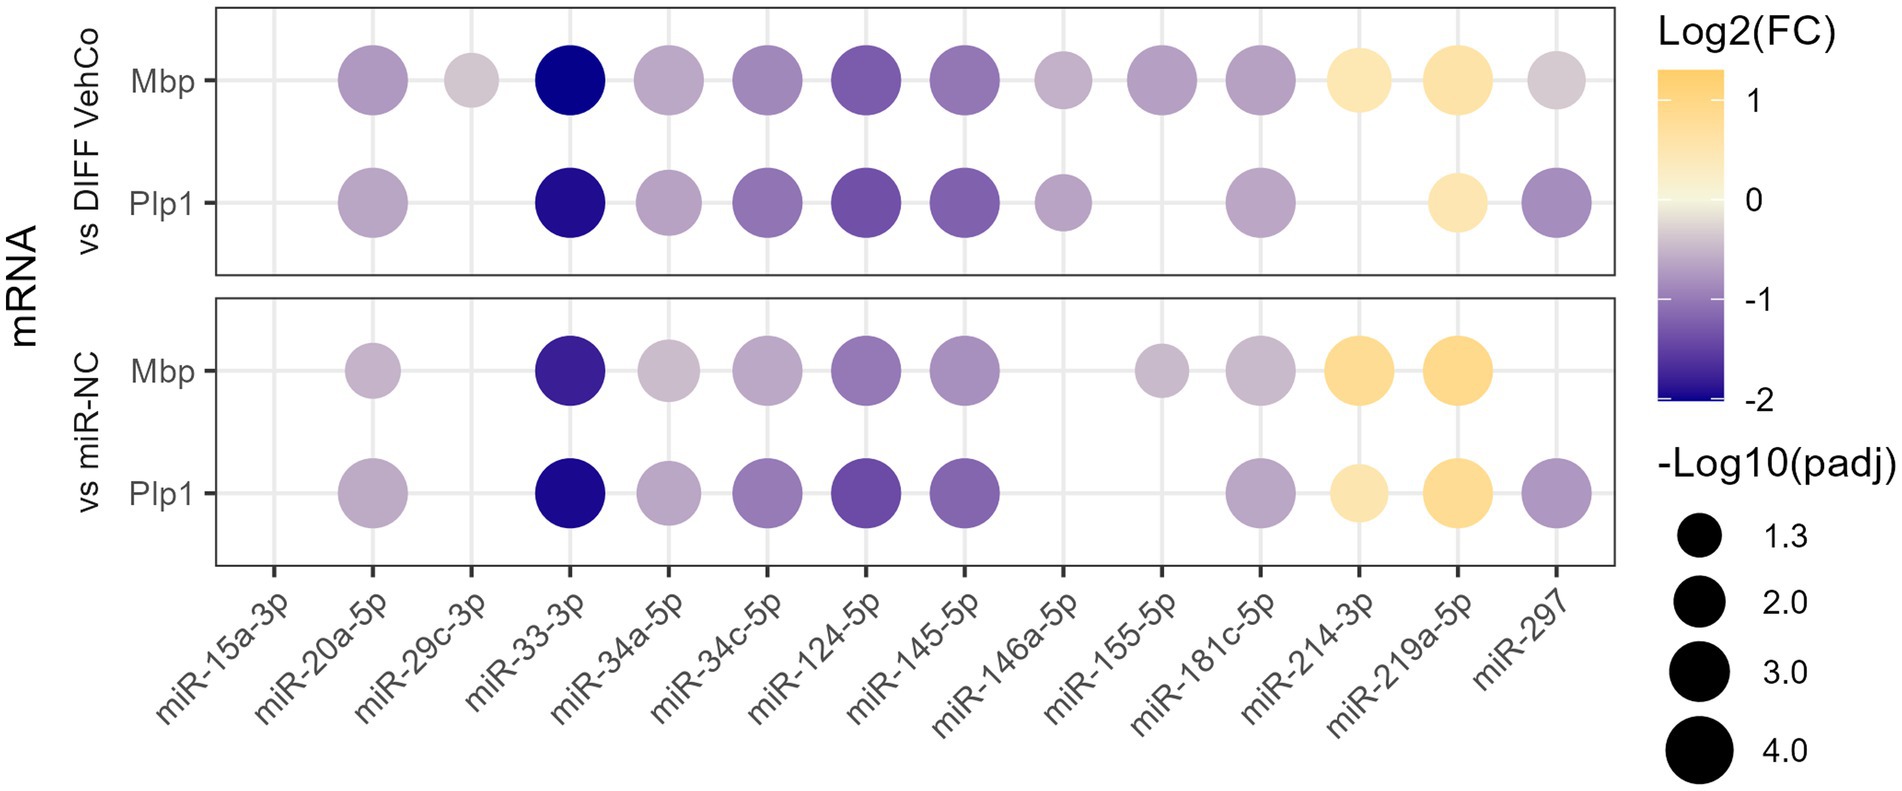
3 Results 3.1 microRNA mimics affect the differentiation of CG-4 cellsWe have previously identified 21 microRNAs dysregulated in the cerebrospinal fluid, serum, and/or peripheral blood mononuclear cells of relapsing and/or remitting MS patients compared to symptomatic/healthy controls (Perdaens et al., 2020). Therefore, we aimed to investigate whether these microRNAs could affect the differentiation of OPCs using the CG-4 cell line. The microRNAs were chosen based on the strength of their dysregulation or their uniqueness in the setting of MS. As a preliminary screening, CG-4 cells were transfected on day 0 and day 4 separately with one of the 13 microRNA mimics (miR-15a-3p, miR-20a-5p, miR-29c-3p, miR-33-3p, miR-34a-5p, miR-34c-5p, miR-124-5p, miR-145-5p, miR-146a-5p, miR-155-5p, miR-181c-5p, miR-214-3p, and miR-297) and cultured in the differentiation medium from day 1 until day 6. We used miR-219a-5p as a positive control of differentiation, as well as the negative control microRNA mimic (miR-NC). Most of these microRNAs significantly reduced the expression of the differentiation markers, myelin basic protein (Mbp), and proteolipid protein 1 (Plp1) at the mRNA level. miR-214-3p was the only microRNA that increased their expression but to a lower extent than miR-219a-5p (Figure 1; Supplementary Figure S1).
Figure 1. The effect of 13 microRNA mimics on the differentiation of CG-4 cells in RT-qPCR (screening). This dot plot shows the fold change (FC) of the relative expression of the differentiation markers Mbp and Plp1 to the differentiation vehicle control (DIFF VehCo) and the microRNA mimic negative control (miR-NC) resulting from the double transfection of each microRNA mimic, as labeled on the x-axis, in CG-4 cells in differentiation culture conditions. The color of each dot represents the fold change (expressed in logarithm base 2 [Log2(FC)]) of the relative expression, scaled by a blue-to-yellow color gradient from −2 to 1.3 (blue corresponding to a negative fold change, yellow to a positive), and its size represents the adjusted p-value (padj) (expressed as minus logarithm base 10 [−Log10(padj)]) as indicated in the plot legend. The adjusted p-value was calculated by Tukey’s multiple comparison test, as recommended, following a parametric one-way ANOVA on each microRNA separately with both controls. Only the significant data are depicted; thus, missing dots correspond to non-significant data. −Log10(padj) ≥1.3 corresponds to the significance level of p ≤ 0.05, −Log10(padj) of 2.0 corresponds to p = 0.01, −Log10(padj) of 3.0 to p = 0.001, and −Log10(padj) of 4.0 to p = 0.0001. Data were from three experiments for each microRNA with each condition in triplicate. The corresponding bar plots showing both the statistically significant and non-significant results can be found in Supplementary Figure S1.
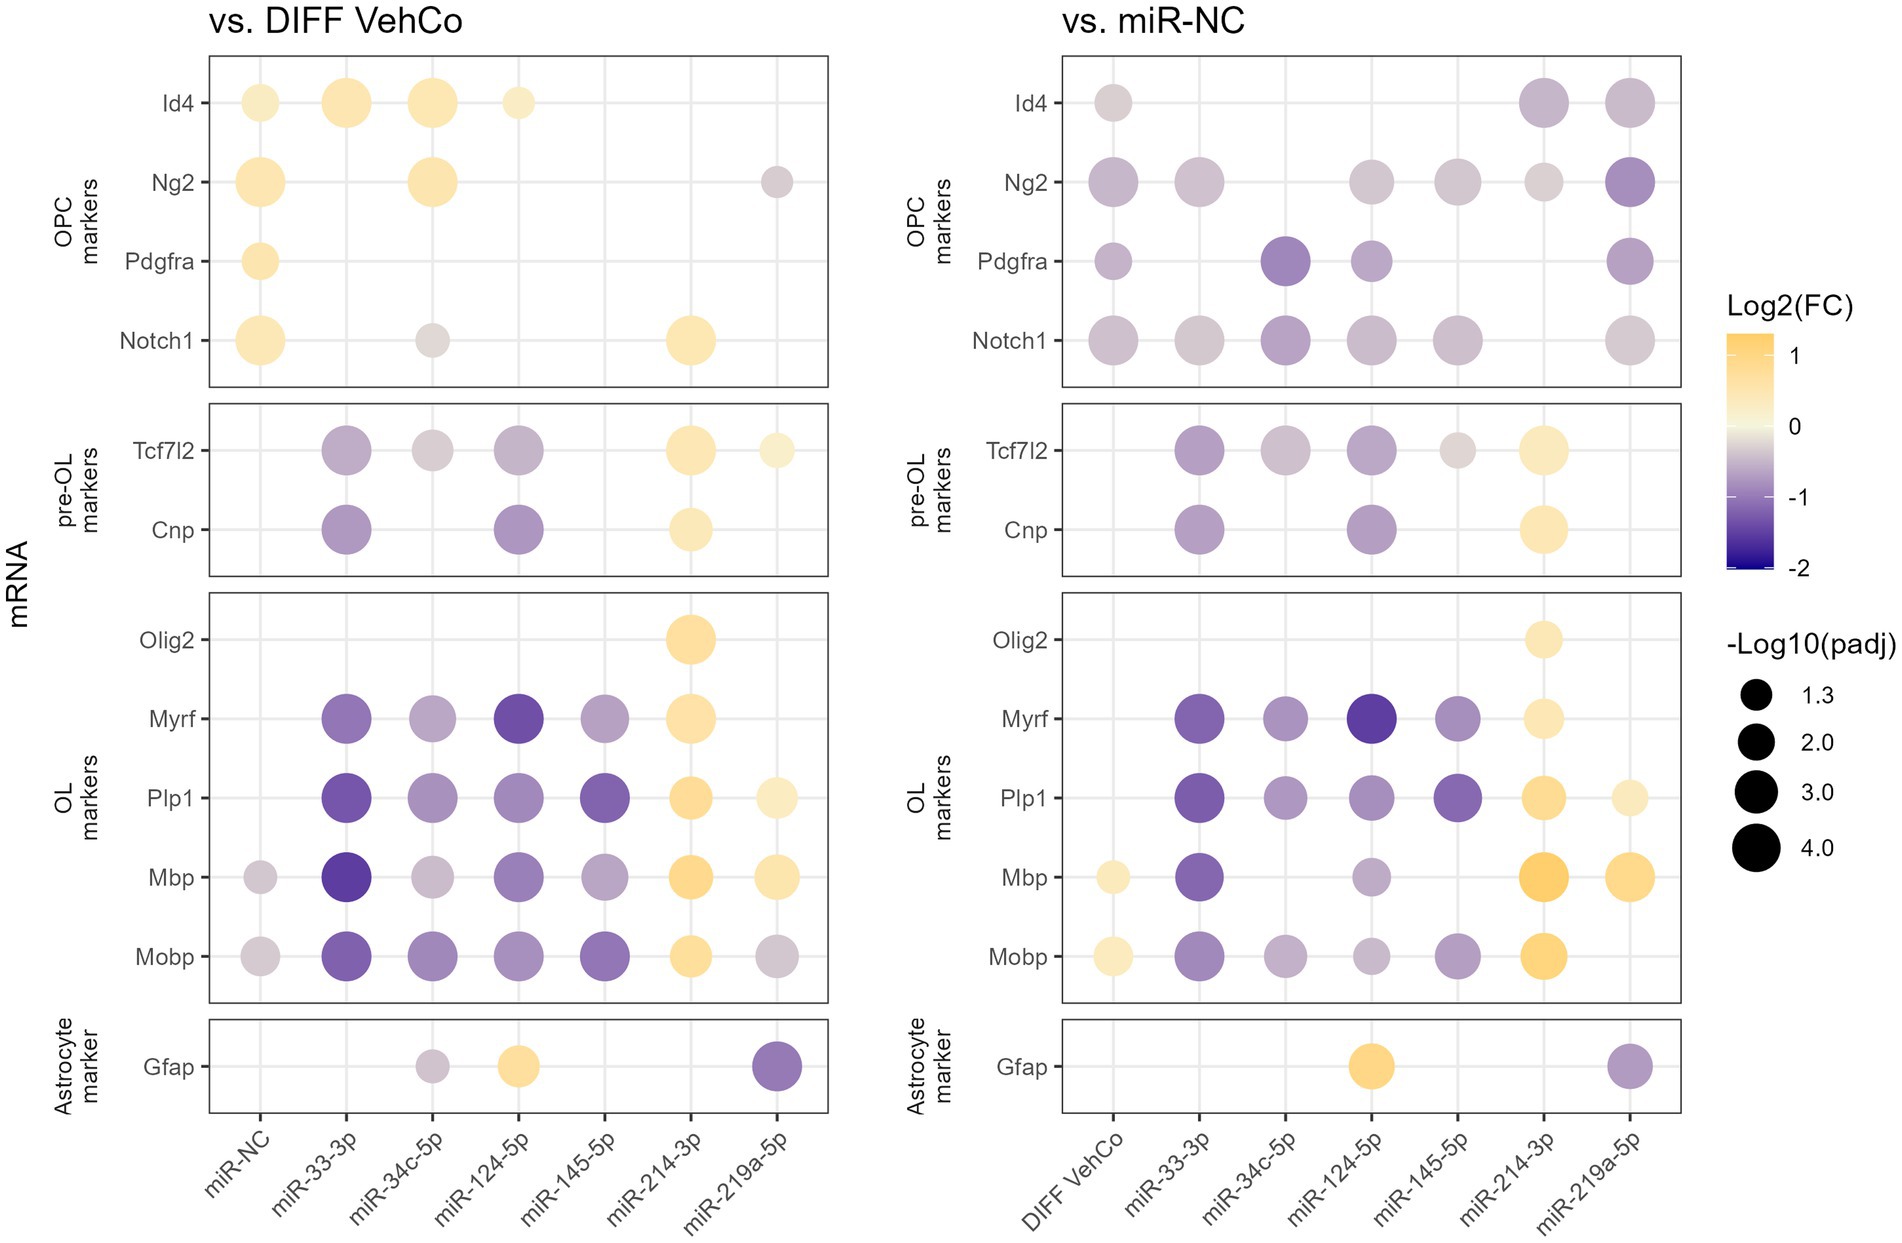
From this point onward, we decided to focus on the microRNA species that reduced the expression of the differentiation markers by at least a factor of 2 compared to the differentiation vehicle control, i.e., miR-33-3p, miR-34c-5p, miR-124-5p, and miR-145-5p. miR-214-3p was also selected as it was the only microRNA significantly increasing the expression of Plp1 and Mbp, although by less than a factor 2. We used a simplified protocol with a single transfection followed by a 48 h culture in the differentiation medium, as this appeared to be sufficient to identify differences in the differentiation stages among the transfected conditions and would simplify further comparisons with the respective microRNA inhibitors. We further aimed to stage each of the transfected cells by measuring the relative expression of several OPC/OL markers (Figure 2; Supplementary Figure S2) (Mitew et al., 2014). miR-33-3p, miR-34c-5p, miR-124-5p, and miR-145-5p significantly downregulated the expression of mature OL markers—myelin regulatory factor (Myrf), Plp1, Mbp, and myelin-associated oligodendrocyte basic protein (Mobp)—as compared to the differentiation vehicle control and miR-NC, except for Mbp with miR-34c-5p and miR-145-5p when compared to miR-NC. miR-33-3p was the strongest inhibitor for all markers except Myrf. On the contrary, miR-214-3p promoted CG-4 differentiation, remarkably to an even greater extent than miR-219a-5p, as seen by the significant upregulation of these markers (Figure 2; Supplementary Figure S2). Interestingly, these microRNAs affected the differentiation already at an early premyelinating stage, as seen by the significant downregulation of transcription factor 7 like 2 (Tcf7l2) and 2′,3′-cyclic nucleotide 3′phosphodiesterase (Cnp) by miR-33-3p and miR-124-5p, and their upregulation by miR-214-3p against both controls, while miR-34c-5p significantly downregulated Tcf7l2 only. The OPC marker, inhibitor of DNA binding 4 (Id4), was significantly upregulated by miR-33-3p, miR-34c-5p, miR-124-5p, and miR-NC as well against the differentiation vehicle control and significantly downregulated by miR-214-3p and miR-219a-5p against miR-NC. Moreover, miR-214-3p significantly increased the expression of oligodendrocyte transcription factor 2 (Olig2), which is involved in oligodendroglial specification, highly expressed in myelinating OLs and sufficient to promote OPC differentiation by inducing SRY-box transcription factor 10 (Sox10) and other differentiation genes through chromatin remodelers (Figure 2; Supplementary Figure S2) (Liu et al., 2007; Meijer et al., 2012; Yu et al., 2013). Given the bipotentiality of CG-4 progenitor cells that can differentiate into type-2 astrocytes or mature OLs, depending on the culture medium, we explored this axis as well and found that miR-124-5p increased and miR-219a-5p decreased the expression of glial fibrillary acidic protein (Gfap), while cultured in the OL-differentiation medium (Figure 2; Supplementary Figure S2).
Figure 2. The effect of five microRNA mimics on the differentiation of CG-4 cells in RT-qPCR (confirmation). This dot plot shows the fold change (FC) of the relative expression of several OPC, pre-OL, OL, and astrocyte markers, as labeled on the y-axis, to the differentiation vehicle control (DIFF VehCo) and the microRNA mimic negative control (miR-NC), resulting from the single transfection of each microRNA mimic, as labeled on the x-axis, in CG-4 cells in differentiation culture conditions. The color of each dot represents the fold change (expressed in logarithm base 2 [Log2(FC)]) of the relative expression, scaled by a blue-to-yellow color gradient from −2 to 1.3 (blue corresponding to a negative fold change, yellow to a positive), and its size represents the adjusted p-value (padj) (expressed as minus logarithm base 10 [−Log10(padj)]) as indicated in the plot legend. The adjusted p-value was calculated by Dunn’s or Dunnett’s multiple comparison test to each control separately, i.e., the differentiation vehicle control and miR-NC, as recommended following a parametric/non-parametric one-way ANOVA on all conditions, including the proliferation vehicle control (not shown). Only the significant data are depicted; thus, missing dots correspond to non-significant data. −Log10(padj) ≥ 1.3 corresponds to the significance level of p ≤ 0.05, −Log10(padj) of 2.0 corresponds to p = 0.01, −Log10(padj) of 3.0 to p = 0.001, and −Log10(padj) of 4.0 to p = 0.0001. Data were from three experiments with each condition in triplicate. OPC, oligodendrocyte progenitor cells; pre-OL, premyelinating oligodendrocytes; OL, oligodendrocytes. The corresponding bar plots showing both the statistically significant and non-significant results can be found in Supplementary Figure S2.
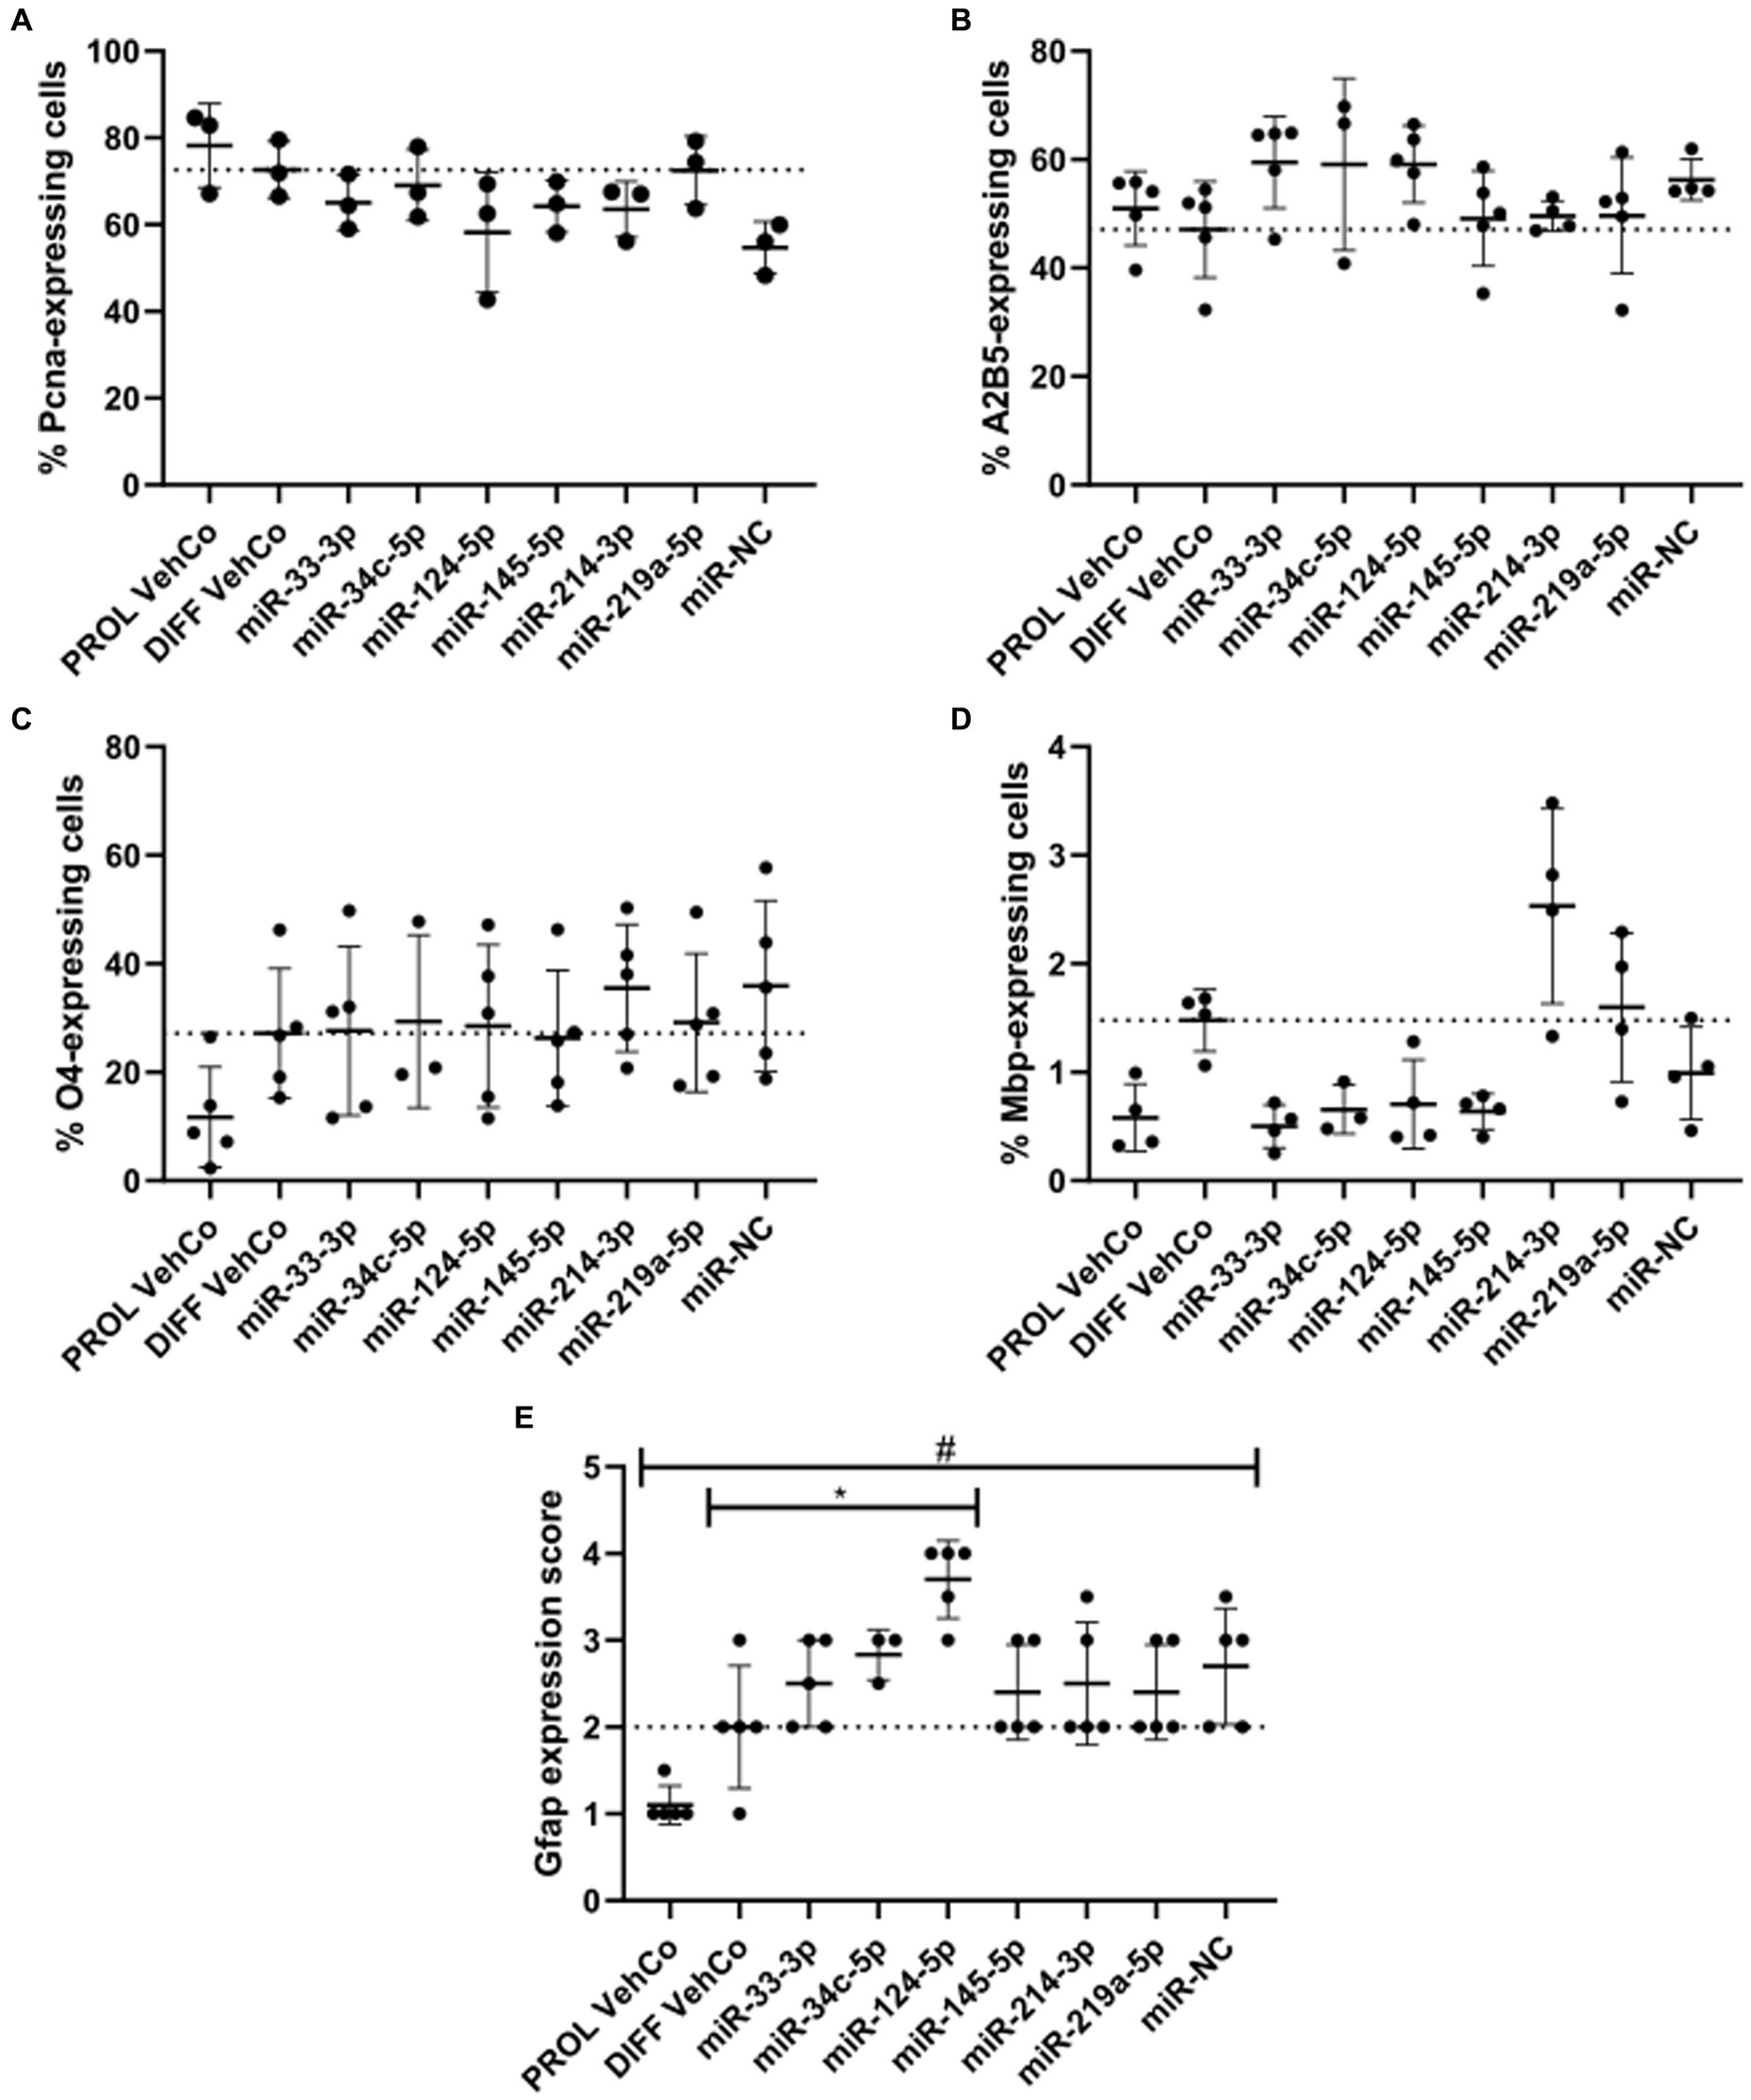
Next, we phenotypically characterized the transfected CG-4 cells at the protein level by immunocytochemistry. First, proliferation was not significantly affected by the transfection of the several microRNA mimics against the proliferation and differentiation vehicle controls as evidenced by proliferating cell nuclear antigen (Pcna), an auxiliary protein regulating DNA replication/repair, cell cycle control, etc., and hence a marker of the early G1 and S phases of the cell cycle (Strzalka and Ziemienowicz, 2011). Yet, it tended to decrease in miR-NC-transfected cells (Figure 3A; Supplementary Figure S3A). Cells transfected with miR-33-3p, miR-34c-5p, and miR-124-5p tended to show a higher proportion of A2B5+ cells, a progenitor cell marker, than the differentiation vehicle control. A trend toward a higher proportion of O4+ cells, an early differentiation marker, was observed in miR-214-3p-transfected cells (Figures 3B,C; Supplementary Figures S3B,C) (Gard and Pfeiffer, 1990). miR-33-3p, miR-34c-5p, miR-124-5p, and miR-145-5p did not affect O4-positivity as compared to the differentiation vehicle control but tended to decrease the proportion of Mbp-expressing cells, while miR-214-3p tended to increase it (Figures 3C,D; Supplementary Figures S3C,D). The outcomes of the one-way ANOVA did not exhibit any statistically significant disparities. However, it is important to note that the analysis was performed on all conditions collectively, rather than individually, for each microRNA mimic condition versus the controls. In this latter, less stringent analysis, some results were statistically significant (data not shown). Finally, miR-124-5p transfected cells expressed significantly more Gfap, based on a visual score (Figure 3E; Supplementary Figure S3D). Representative fluorescence micrographs can be found in Supplementary Figures S3A–D, whereby Mbp-staining suggests the branching morphology of mature oligodendrocytes.
Figure 3. The effect of five microRNA mimics on the differentiation of CG-4 cells in immunocytochemistry. The plots show the percentage of cells expressing (A) the proliferation marker Pcna, (B) the OPC marker A2B5, (C) the early differentiation marker O4, and (D) the late differentiation marker Mbp, as well as (E) the score of Gfap expression (mean with SD), calculated (A–D)/estimated (E) to the total number of cells (based on the detection of the nucleus counterstained with DAPI), resulting from the single transfection of each microRNA mimic (as labeled on the x-axis) in CG-4 cells in differentiation culture conditions, as well as the proliferation vehicle control (PROL VehCo). The score for Gfap expression ranges from 0 = none to 5 = abundant (namely 0 = no Gfap-positive (Gfap+) cells, 1 = a few Gfap+ cells on the whole coverslip, 2 = a few Gfap+ cells in a few grids of the coverslip, 3 = a few Gfap+ cells in several grids of the coverslip, 4 = many Gfap+ cells in several grids of the coverslip, 5 = many Gfap+ cells on the whole coverslip). The dotted line represents the mean value of the differentiation vehicle control (DIFF VehCo). The non-parametric one-way ANOVAs on all conditions were not significant, except for Gfap: adjusted p-value = 0.0148 (*) for miR-124-5p against DIFF VehCo, and adjusted p-value = 0.0261 (#) for PROL VehCo against microRNA mimic negative control (miR-NC) on Dunn’s multiple comparison test. Yet, Pcna-expression tended to decrease in miR-NC-transfected cells (non-significant non-parametric one-way ANOVA, but significant Dunn’s post-test against PROL VehCo). Data were from three to five experiments, in single replicates for each experimental and staining condition within each experiment. OPC, oligodendrocyte progenitor cells; SD, standard deviation. Representative fluorescence micrographs can be found in Supplementary Figures S3A–D.
From these results at the mRNA and protein level, we can thus conclude that miR-33-3p, miR-34c-5p, miR-124-5p, and miR-145-5p impeded to a certain extent the differentiation of CG-4 cells into more mature OLs by retaining the cells within a late progenitor (miR-33-3p, miR-34c-5p, and miR-124-5p)-early premyelinating (miR-145-5p) stage, while miR-214-3p induced their differentiation to a further stage.
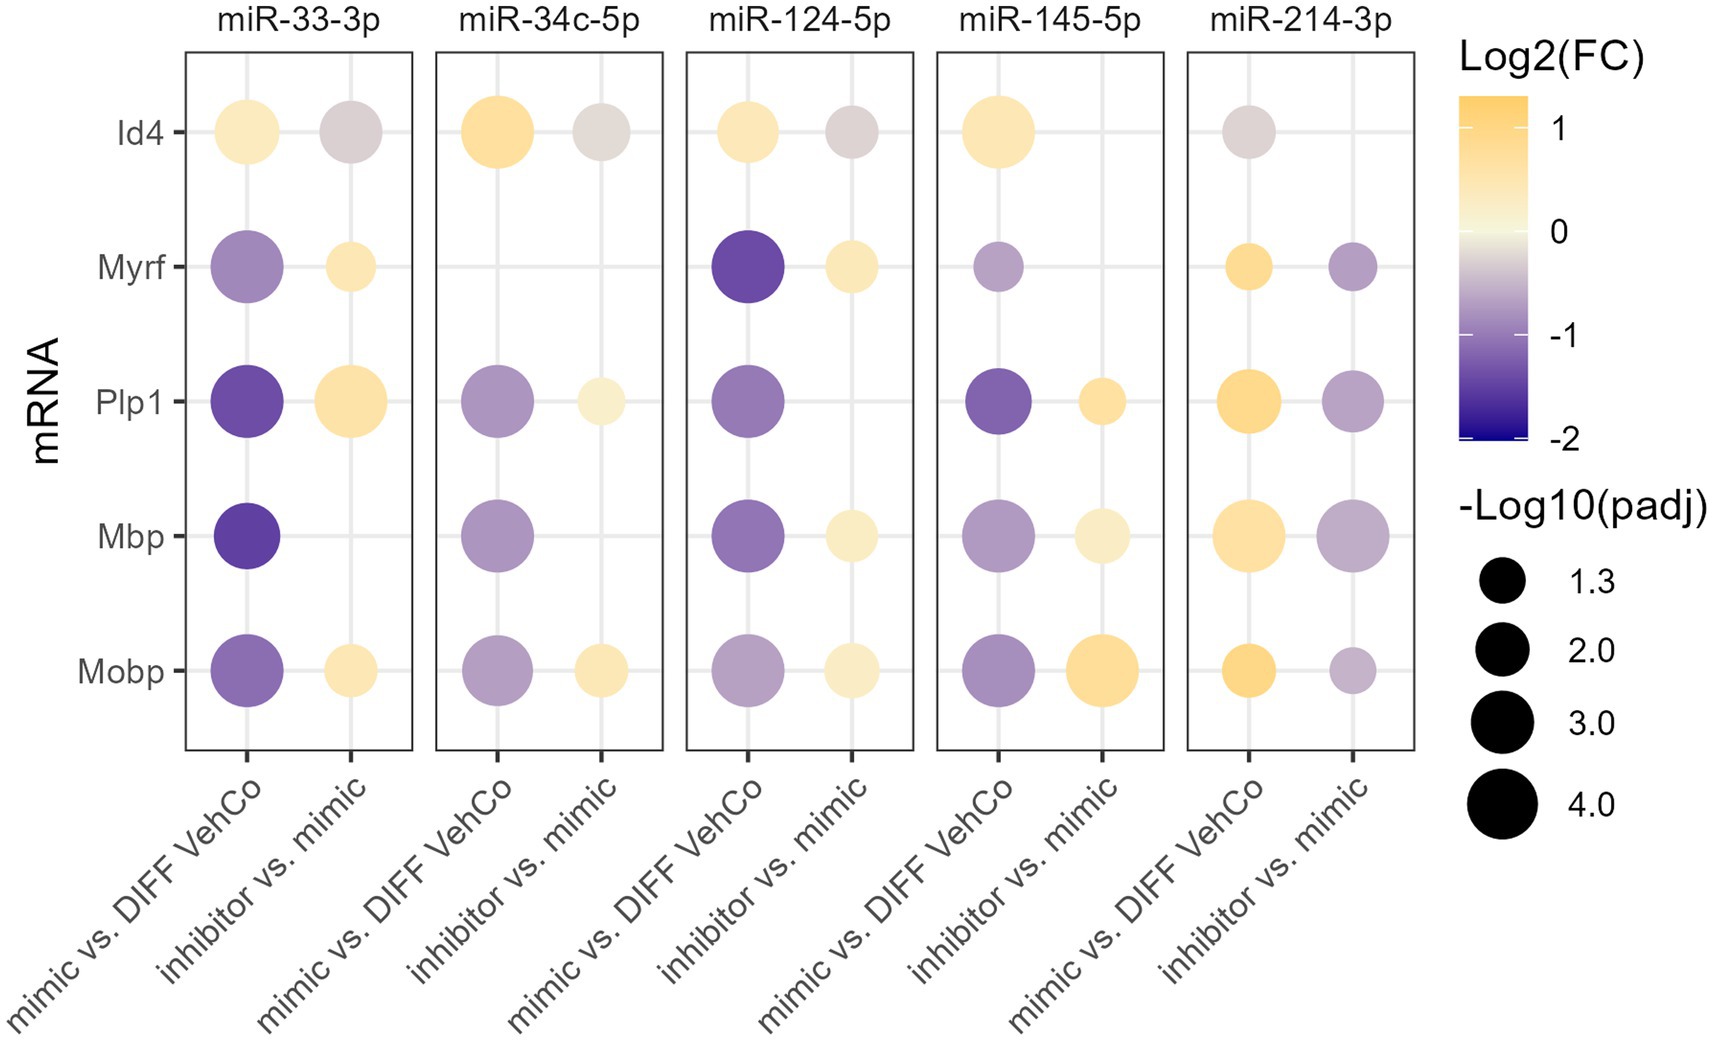
3.2 microRNA inhibitors antagonize their corresponding exogenous microRNA in differentiating CG-4 cellsTo verify the specificity of the microRNA mimics, we sought to counter their effect by transfecting the cells first with the microRNA mimic, followed by a second transfection with the respective microRNA inhibitor. This was compared to the transfection of the mimic followed by a mock transfection (without its inhibitor), which yielded, similarly to the single transfection, the expected dysregulation of Id4, Myrf, Plp1, Mbp, and Mobp for all microRNAs when compared to the differentiation vehicle control, reaching the significance level for all except for miR-34c-5p on Myrf. On the other hand, the microRNA inhibitors significantly antagonized the effect of their corresponding exogenous microRNA on the expression of 3 to 4 of these markers, depending on the microRNA species (Figure 4; Supplementary Figure S4).
Figure 4. The effect of five microRNA mimics and their inhibitors on the differentiation of CG-4 cells in RT-qPCR. This dot plot shows the fold change (FC) of the relative expression of the OPC marker (Id4) and OL markers (Myrf, Plp1, Mbp, and Mobp) as labeled on the y-axis, resulting from the sequential transfection of each microRNA mimic followed or not by its inhibitor in CG-4 cells in differentiation culture conditions. For each microRNA mimic, the fold change was calculated to the differentiation vehicle control (DIFF VehCo), while for each microRNA inhibitor, it was calculated to its corresponding microRNA mimic, as labeled on the x-axis. The color of each dot represents the fold change (expressed in logarithm base 2 [Log2(FC)]) of the relative expression, scaled by a blue-to-yellow color gradient from −2 to 1.3 (blue corresponding to a negative fold change, yellow to a positive), and its size represents the adjusted p-value (padj) (expressed as minus logarithm base 10 [−Log10(padj)]) as indicated in the plot legend. The adjusted p-value was calculated by Dunn’s or Dunnett’s multiple comparison test of each condition to the differentiation vehicle control and by Sidak’s, Tamhane’s T2, or Dunn’s multiple comparison test between the mimic and its inhibitor, as recommended following a parametric/non-parametric one-way ANOVA on all conditions, including the proliferation vehicle control (not shown). Only the significant data are depicted; thus, missing dots correspond to non-significant data. −Log10(padj) ≥1.3 corresponds to the significance level of p ≤ 0.05, −Log10(padj) of 2.0 corresponds to p = 0.01, −Log10(padj) of 3.0 to p = 0.001, and −Log10(padj) of 4.0 to p = 0.0001. Data were from three experiments for each microRNA with each condition in triplicate. OPC, oligodendrocyte progenitor cells; OL, oligodendrocytes. The corresponding bar plots showing both the statistically significant and non-significant results can be found in Supplementary Figure S4.
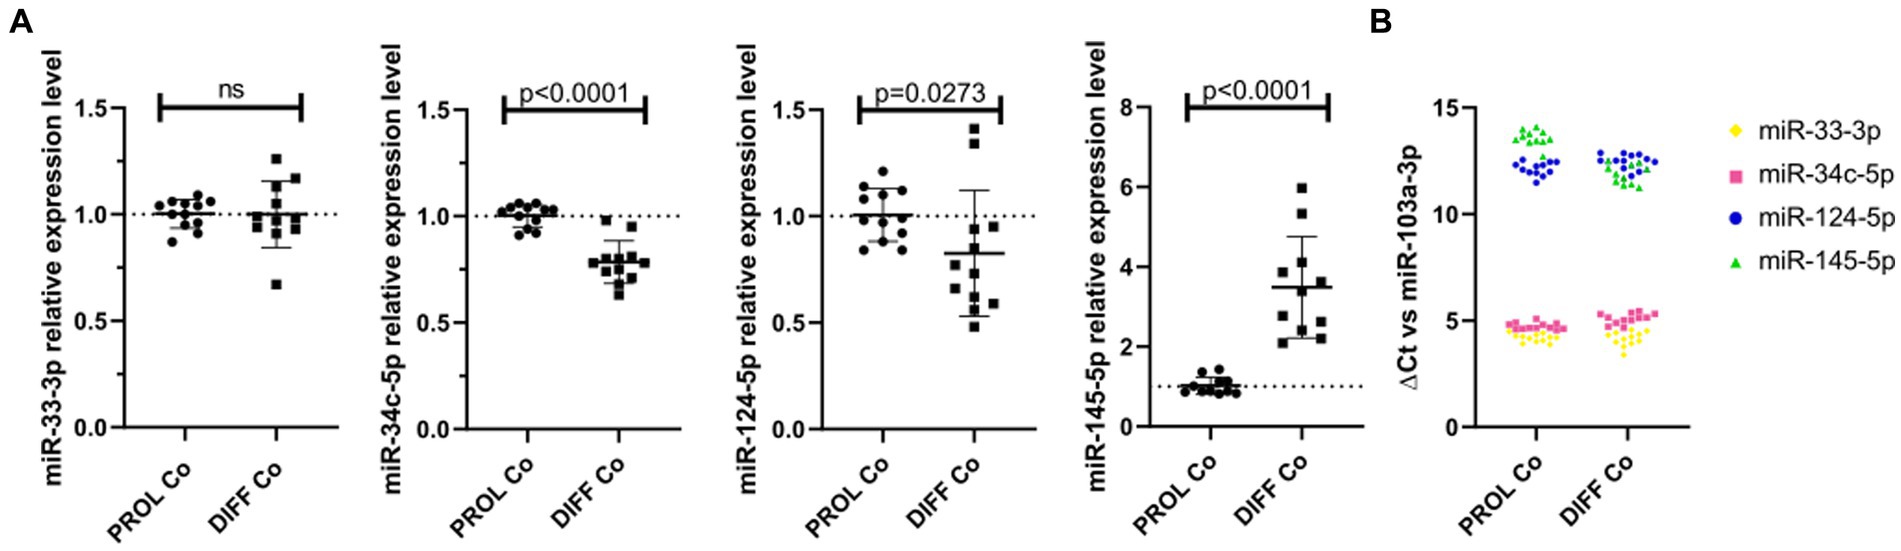
3.3 The endogenous microRNA expression is partially consistent with their effect on CG-4 cell differentiationWe verified the endogenous microRNA expression in CG-4 cells cultured for 24 h in the proliferation medium, followed by an additional 48 h in either the proliferation or differentiation medium. While miR-33-3p was not significantly dysregulated, miR-34c-5p and miR-124-5p were significantly downregulated in differentiating CG-4 cells. miR-145-5p was upregulated under differentiation culture conditions, which is inconsistent with the observed effect of the microRNA mimic, and miR-214-3p was undetectable in both conditions (Figure 5A). miR-124-5p and miR-145-5p were moreover the least abundant, as evidenced by their higher ΔCt with miR-103a-3p as reference (Figure 5B).
Figure 5. Endogenous microRNAs in proliferating and differentiating CG-4 cells. The plots show (A) the relative expression in RT-qPCR (mean with SD of 2−ΔΔCt) of each endogenous microRNA in CG-4 cells cultured in the proliferation or differentiation medium, as well as (B) the ΔCt of each microRNA with miR-103a-3p as reference (ΔCt = Ct(target microRNA)sample – Ct(reference miR-103a-3p)sample), which is representative of the relative abundance of each microRNA. Each color in (B) corresponds to a microRNA species, as indicated in the plot legend. The p-value (p) was calculated by a Mann–Whitney U-test, ns for not significant. Data were from four experiments with each condition in triplicate. PROL Co, proliferation control; DIFF Co, differentiation control; SD, standard deviation.
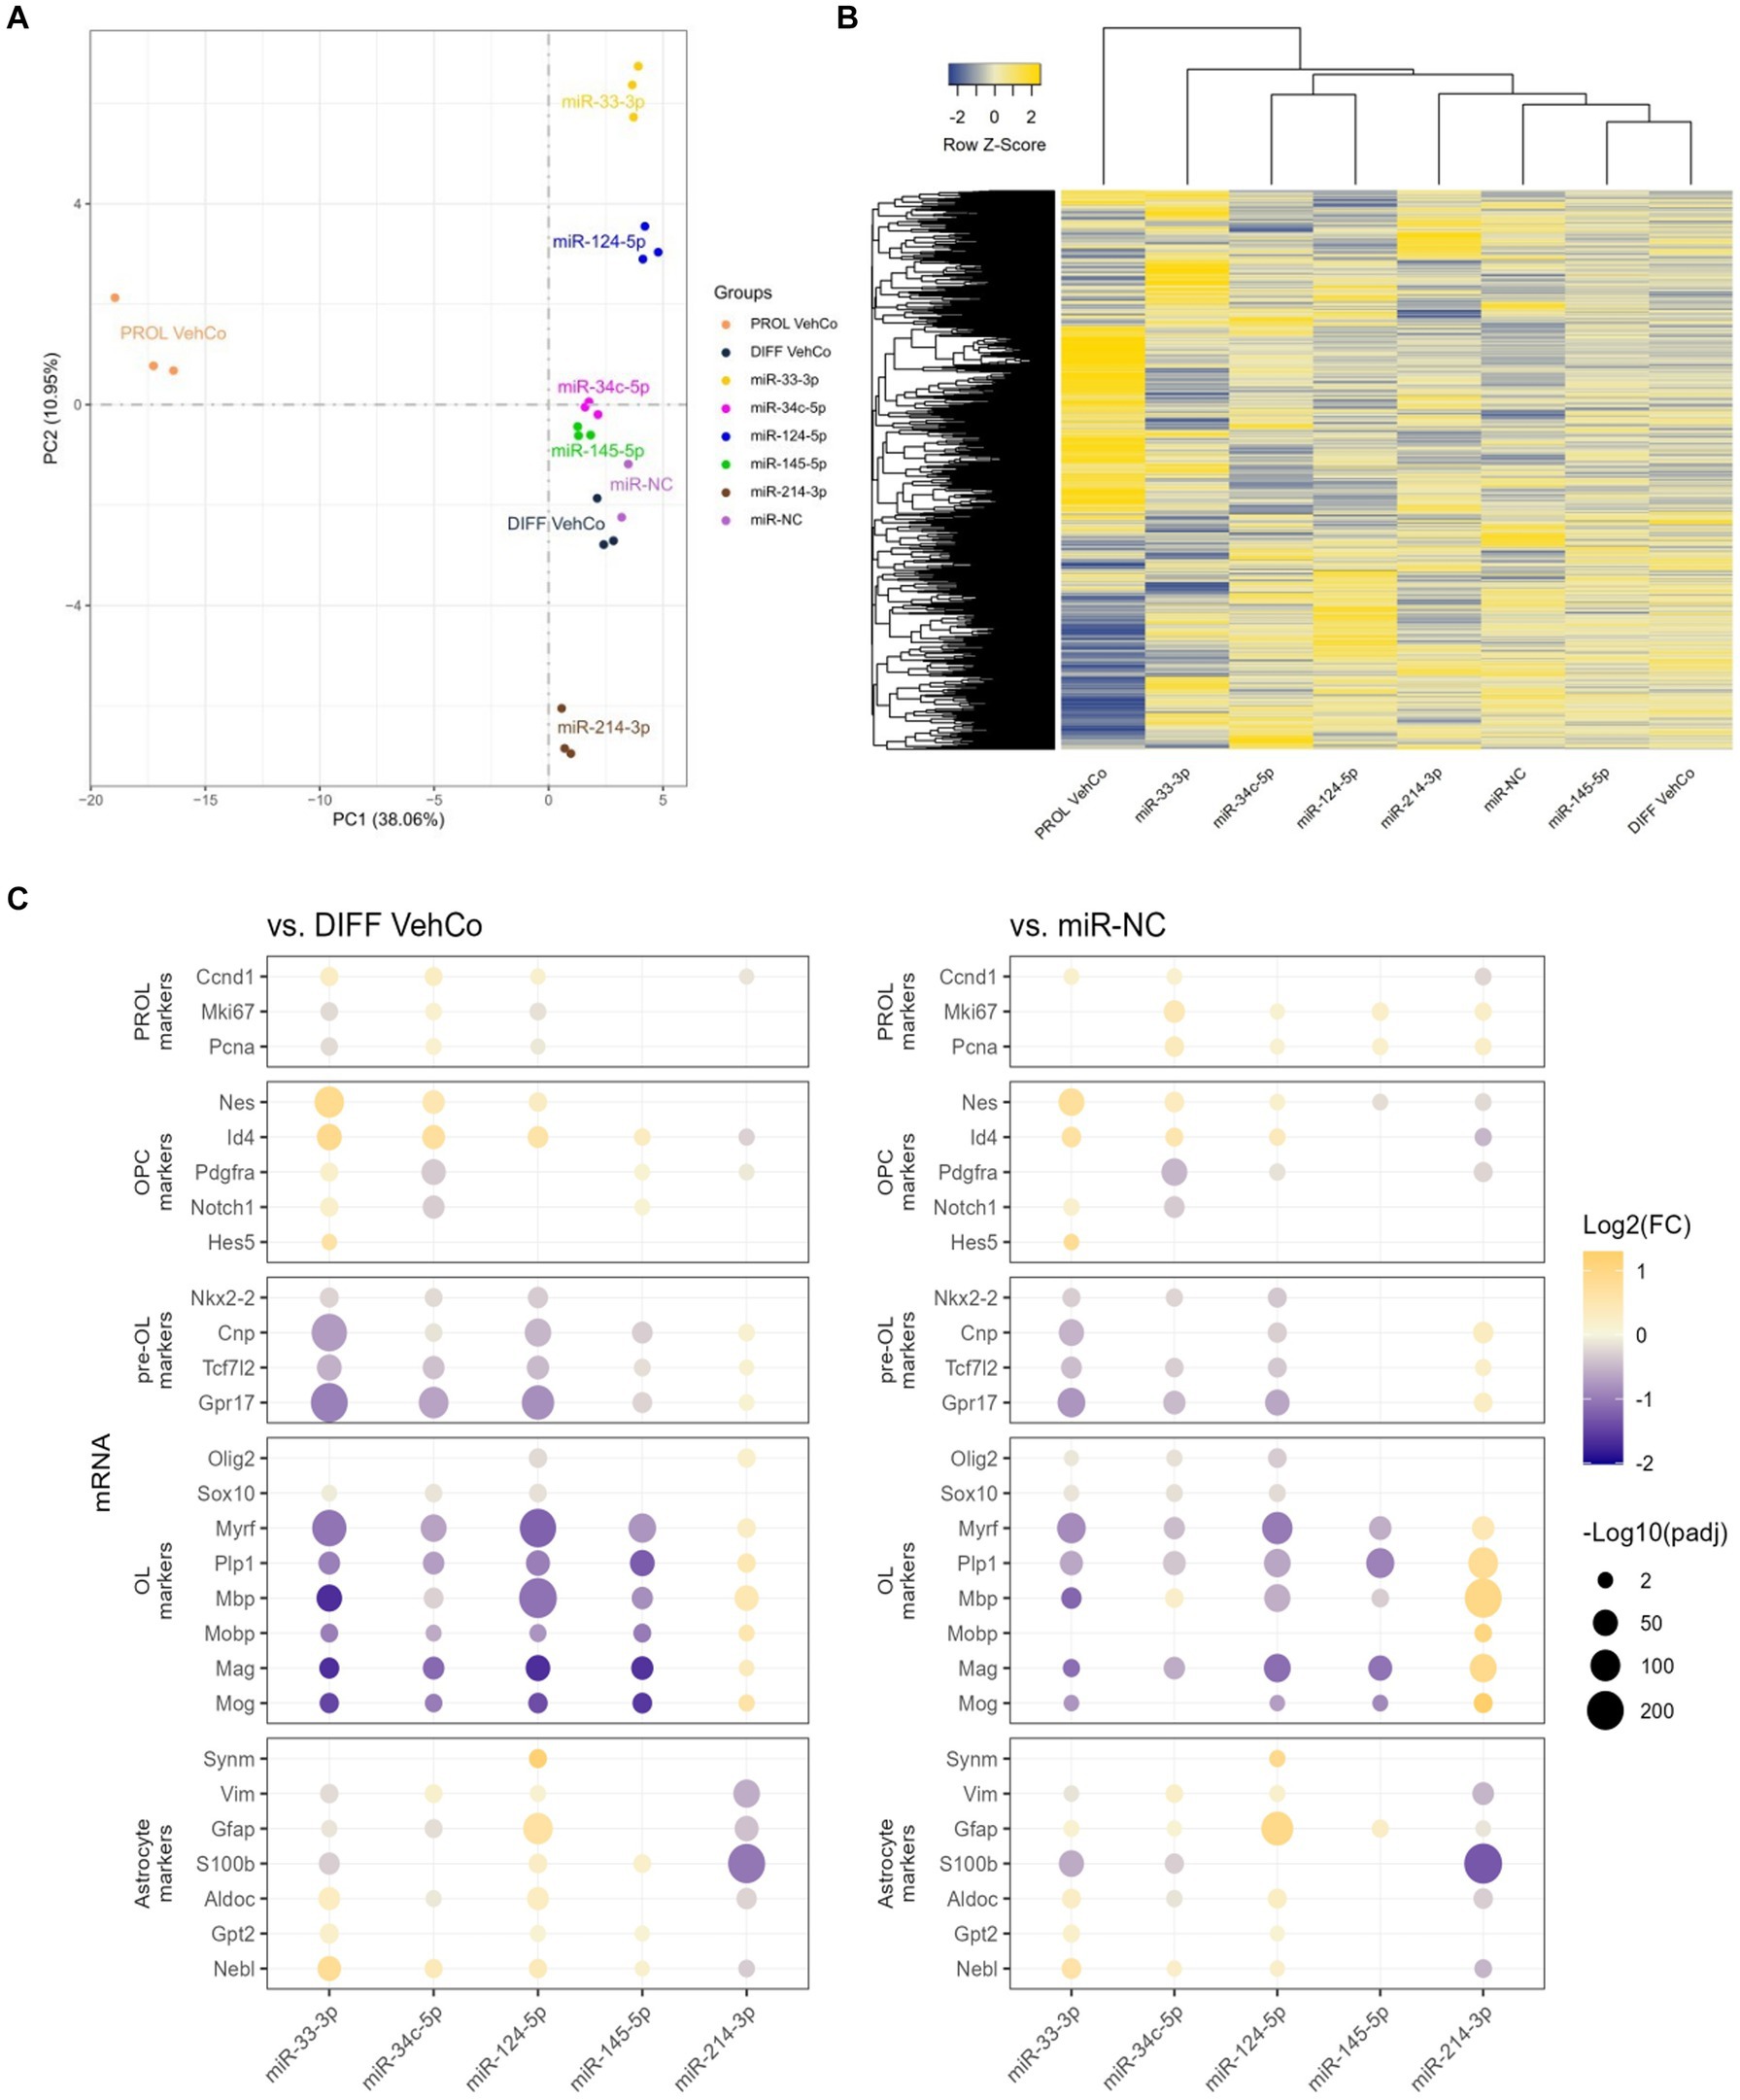
3.4 RNA sequencing reveals the changes in cell fate directed by each microRNARNA sequencing was performed on all conditions in triplicates. One miR-NC replicate was excluded from the final analysis as it appeared to be an outlier masking the effects of the other conditions (see Methods section). Principal component analysis (PCA), performed on the gene expression value [Fragments Per Kilobase Million (FPKM)] of all samples, segregated well the different conditions, especially miR-33-3p, miR-124-5p, and miR-214-3p from the differentiation vehicle control and miR-NC conditions, and the proliferation vehicle control was distinctly segregated from all other conditions (Figure 6A). The first and second principal components covered only 38.06% and 10.95%, respectively, of the conditions’ variance. The gene expression, illustrated by the heatmap, was partially different between the microRNAs and the controls (Figure 6B). In accordance with the PCA, miR-145-5p clustered the closest to the differentiation vehicle control and miR-33-3p the furthest.
Figure 6. The effect of five microRNA mimics on the differentiation of CG-4 cells in RNA sequencing. (A) Principal component analysis was performed on the gene expression value [Fragments Per Kilobase Million (FPKM)] of all samples. In this plot, each sample is dispersed to the first and second principal components. The color of the dots corresponds to the microRNA species and controls, as indicated in the plot legend. (B) The heatmap shows the cluster analysis horizontally on the row-wise homogenized gene expression value (z-score of FPKM, represented by a blue-to-yellow color gradient from −2 to 2) and vertically on the different experimental conditions as labeled at the bottom of the heatmap. (C) This dot plot shows the fold change (FC) of the gene expression value of several proliferation (PROL), OPC, pre-OL, OL, and astrocyte markers, as labeled on the y-axis, to the differentiation vehicle control (DIFF VehCo) and the microRNA mimic negative control (miR-NC), resulting from the single transfection of each microRNA mimic, as labeled on the x-axis, in CG-4 cells in differentiation culture conditions. The color of each dot represents the fold change (expressed in logarithm base 2 [Log2(FC)]) of the relative expression, scaled by a blue-to-yellow color gradient from −2 to 1.3 (blue corresponding to a negative fold change, yellow to a positive), and its size represents the adjusted p-value (padj) (expressed as minus logarithm base 10 [−Log10(padj)]) as indicated in the plot legend. Only the significant data are depicted; thus, missing dots correspond to non-significant data. −Log10(padj) ≥1.3 corresponds to the significance level of p ≤ 0.05. −Log10(padj) ranges up to approximately 10–220 for certain targets. Data were from one experiment with each condition in triplicate, except miR-NC in duplicate. PROL VehCo, proliferation vehicle control; DIFF VehCo, differentiation vehicle control; PROL, proliferation; OPC, oligodendrocyte progenitor cells; pre-OL, premyelinating oligodendrocytes; OL, oligodendrocytes.
The significant dysregulation against the differentiation vehicle control and miR-NC, induced by each microRNA on genes involved in the different stages of OPC-to-OL differentiation is illustrated in Figure 6C (Mitew et al., 2014). These differentially expressed genes (DEG) evidenced the upregulation of OPC markers nestin (Nes) and/or Id4 and the downregulation of premyelinating OL (pre-OL) markers NK2 homeobox 2 (Nkx2-2), Tcf7l2, Cnp, and G protein-coupled receptor 17 (Gpr17) and of mature OL markers [Plp1, Myrf, Mbp, Mobp, myelin-associated glycoprotein (Mag), myelin oligodendrocyte glycoprotein (Mog)] by miR-33-3p, miR-34c-5p miR-124-5p, and miR-145-5p, although the downregulation of the pre-OL markers by miR-145-5p was less pronounced, especially against miR-NC (Figure 6C). The opposite dysregulation of these markers was driven by miR-214-3p. Interestingly, miR-33-3p and miR-124-5p induced the expression of several astrocyte markers, such as aldolase fructose-bisphosphate C (Aldoc), glutamic-pyruvic transaminase 2 (Gpt2), and nebulette (Nebl). Immature astrocyte markers, vimentin (Vim) and Gfap, were upregulated by miR-124-5p but downregulated by miR-33-3p (Molofsky and Deneen, 2015; Jurga et al., 2021). All, except Gpt2, were downregulated by miR-214-3p as well (Figure 6C). Finally, all transfected cells, except miR-33-3p, had an increased proliferation rate [evidenced by the marker of proliferation Ki67 (Mki67), and Pcna] against miR-NC in RNA sequencing, while these markers were downregulated in miR-33-3p- and miR-124-5p-transfected cells against the differentiation vehicle control (Figure 6C). Nonetheless, Pcna expression did not significantly change among conditions at the protein level in immunocytochemistry (Figure 3A). The significantly increased expression of cyclin D1 (Ccnd1), Mki67, and Pcna against both controls further suggests active cell cycling in miR-34c-5p-transfected cells (Figure 6C).
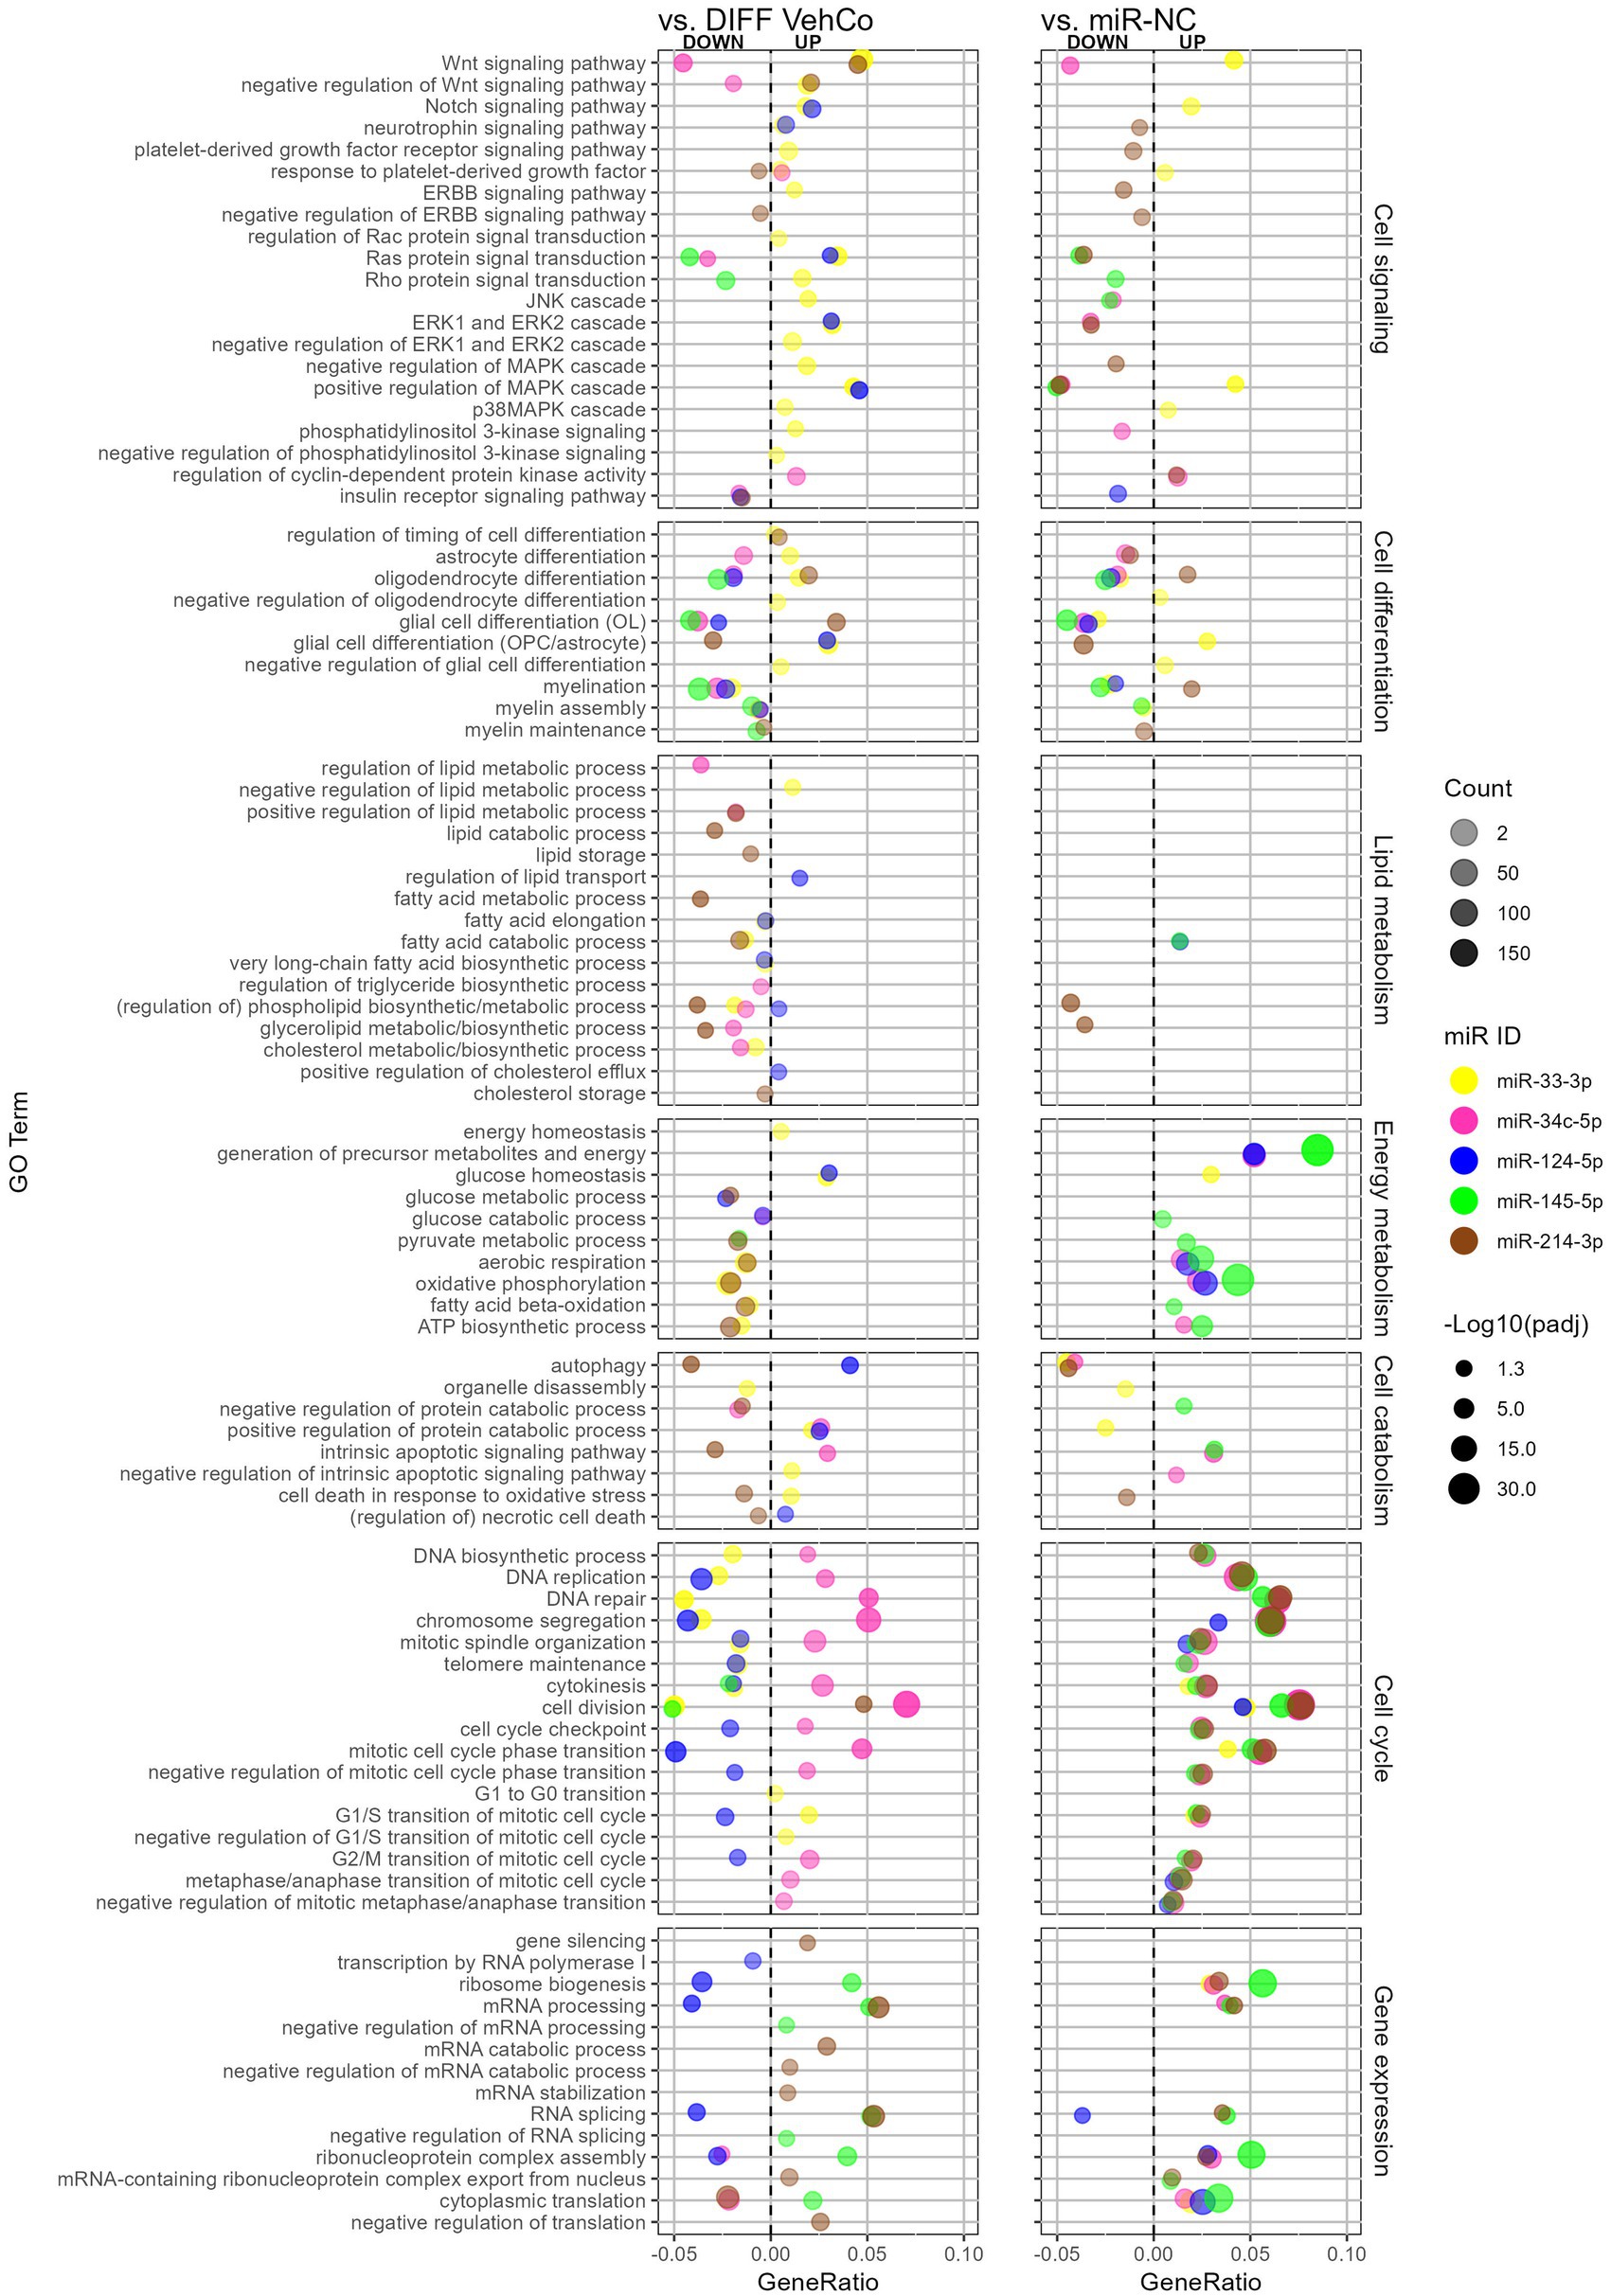
We comprehensively compared the gene enrichment analysis of each microRNA against both the differentiation vehicle control and miR-NC conditions within the Gene Ontology (GO)/Biological Process (Figure 7). miR-214-3p supported OPC differentiation and myelination, whereas miR-33-3p, miR-34c-5p, miR-124-5p, and miR-145-5p countered these processes. The GO term “oligodendrocyte differentiation” was, however, upregulated by miR-33-3p against the differentiation vehicle control, although genes annotated to this GO term support OPC rather than OL physiology, such as Notch1, Hes family BHLH transcription factor (Hes) 1, Hes5, Id2, Id4, and Leucine-rich repeat and immunoglobulin domain containing 1 (Lingo1). Note that the GO term “myelination” was not significantly dysregulated by miR-214-3p against the differentiation vehicle control, neither by miR-34c-5p against miR-NC. Additionally, astrocyte differentiation and glial cell differentiation with annotated genes rather linked to astrocytic physiology were upregulated by miR-33-3p and/or miR-124-5p but downregulated by miR-34c-5p and miR-214-3p. miR-33-3p upregulated signaling pathways involved in OPC/OL physiology, either in its proliferation (i.e., Wnt, Notch signaling pathway) or in both its proliferation and differentiation (i.e., mitogen-activated protein kinase (MAPK) and p38MAPK cascade) (Chew et al., 2010). It also upregulated the platelet-derived growth factor (Pdgfr) (proliferation) and extracellular signal-regulated kinase (ERK) and phosphoinositide-3-kinase (PI3K) (proliferation/differentiation) signaling pathways (Baron et al., 2000; Gaesser and Fyffe-Maricich, 2016), as well as the negative regulation of these signaling pathways, when compared to the differentiation vehicle control only. The other microRNAs affected fewer signaling pathways. miR-34c-5p downregulated the Wnt signaling pathway, while miR-124-5p induced the Notch signaling pathway and ERK cascade. miR-145-5p downregulated Ras protein signal transduction and miR-214-3p downregulated the “negative regulation of ERBB signaling pathway” (epidermal growth factor receptor (Egfr) tyrosine kinase family), both involved in differentiation.
Figure 7. The effect of five microRNA mimics on the differentiation of CG-4 cells in RNA sequencing (Gene Ontology enrichment analysis). This dot plot shows the significant down- and upregulated Gene Ontology (GO) terms within the biological process for each microRNA to the differentiation vehicle control (DIFF VehCo) and the microRNA mimic negative control (miR-NC). The GO terms have been grouped by classes of biological processes as labeled on the right side of the plot. The gene ratio, which is the number of genes annotated to the GO term divided by the total number of down-/upregulated genes in the condition, is depicted on the x-axis, positively for upregulated GO terms, negatively for downregulated GO terms, separated by the vertical dotted line. The color of the dots corresponds to the microRNA species, the transparency to the absolute gene count, and the size to the adjusted p-value (expressed as minus logarithm base 10 [−Log10(padj)]) as indicated in the plot legend. Data were from one experiment with each condition in triplicate, except miR-NC in duplicate.
Lipid metabolism was barely affected against miR-NC, except for miR-214-3p, which downregulated phospholipid/glycerolipid metabolism against both controls. Conversely, as compared to the differentiation vehicle control only, lipid metabolism was curtailed by miR-33-3p at the level of fatty acid, phospholipid, and cholesterol biosynthesis, by miR-34c-5p at the level of triglyceride/glycerolipid biosynthesis and phospholipid/cholesterol metabolism, and by miR-214-3p at the level of lipid/fatty acid catabolism and lipid/cholesterol storage, while miR-124-5p supported lipid/sterol transport.
Energy metabolism was negatively affected by miR-33-3p and miR-214-3p against the differentiation vehicle control but supported by miR-34c-5p, miR-124-5p, and miR-145-5p against miR-NC, as seen by the dysregulation of oxidative phosphorylation, aerobic respiration, ATP biosynthesis, and the generation of precursor metabolites. The energy homeostasis appeared, however, still safeguarded with miR-33-3p. miR-214-3p reduced autophagy and cell death in response to oxidative stress as well, while GO terms within autophagy and apoptosis were less consistent against both controls for the other microRNAs.
Cell cycle processes (cell division and cell cycle transition) were upregulated by all microRNAs against miR-NC but only by miR-34c-5p against the differentiation vehicle control and downregulated by miR-124-5p. Remarkably, the cyclin-dependent protein kinase activity was upregulated by miR-34c-5p against both controls. miR-33-3p impeded DNA biosynthesis, replication, repair, and telomere maintenance and supported the cell cycle transition only up to the G1/S phase compared to the differentiation vehicle control. Concerning gene expression, miR-145-5p and miR-214-3p supported (m)RNA processing and splicing against both controls, while miR-124-5p downregulated these against the differentiation vehicle control only. Furthermore, miR-145-5p supported the negative regulation of (m)RNA processing and splicing, while miR-214-3p negatively regulated translation and increased gene silencing against the differentiation vehicle control.
In conclusion, the RNA sequencing data supported our results obtained by RT-qPCR on independent experiments, phenotyping miR-33-3p, miR-34c-5p, and miR-124-5p transfected cells as late OPCs while miR-33-3p and miR-124-5p induced to a certain extent some astrocytic features as well. miR-145-5p transfected cells shifted closer to a pre-OL stage. All of them inhibited OPC differentiation and myelination, which was also supported by the decreased metabolism of various lipid species by both miR-33-3p and miR-34c-5p. miR-33-3p restrained DNA biosynthesis and energy metabolism, and miR-34c-5p sustained cell division, while miR-124-5p prevented cell cycle and gene expression compared to the differentiation vehicle control. GO enrichment analysis was overall poorer for miR-145-5p, but it downregulated Ras protein signal transduction. On the other hand, miR-214-3p fostered the differentiation of OPCs into a mature OL phenotype, which could be attributed to its regulation of Erbb signaling despite its negative impact on energy and lipid metabolism.
3.5 Several predicted mRNA targets possibly support the effect of each microRNA on OPC differentiationWe identified several potential mRNA targets of each microRNA using in silico analysis, at best predicted by three to four databases for both rat and human. We then verified whether RNA sequencing confirmed their downregulation (against the differentiation vehicle control and miR-NC) and whether they were correspondingly involved in OPC differentiation via a Pubmed search or their annotation to downregulated GO terms of interest (Supplementary Tables S2A,B). Their dysregulation by the other microRNAs was variable (data not shown).
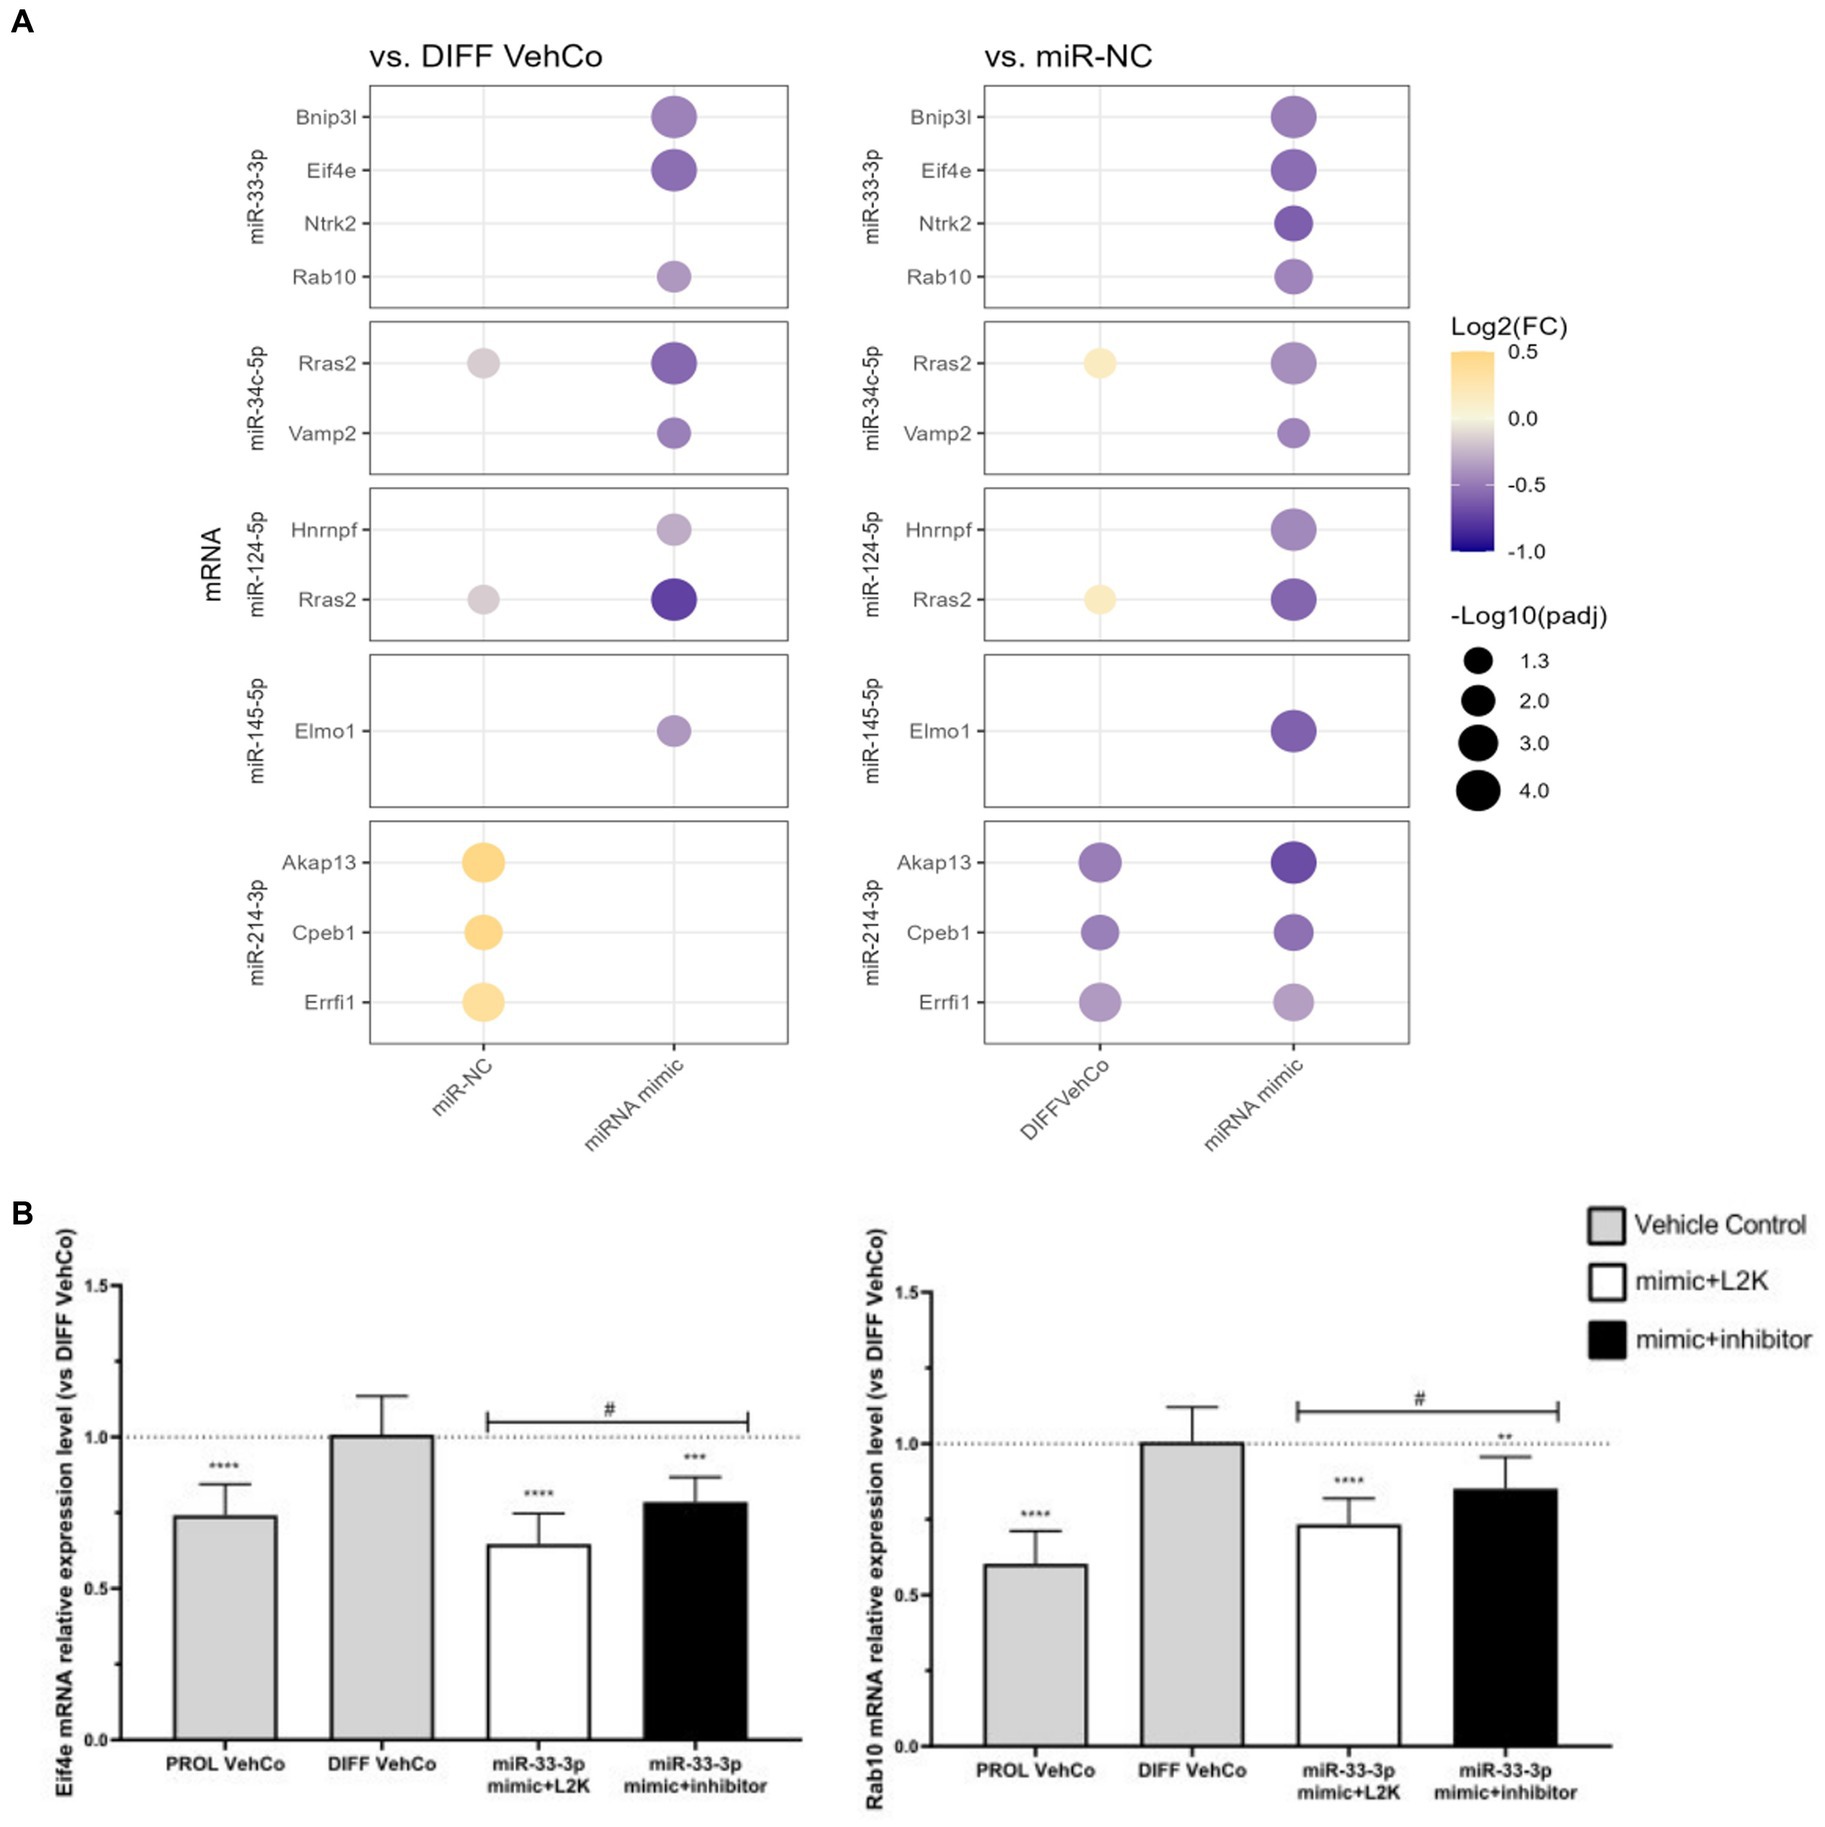
Hereafter, we confirmed the downregulation of several targets by RT-qPCR on three independent experiments: Bcl2 interacting protein 3 like (Bnip3l), eukaryotic translation initiation factor 4E (Eif4e), Rab10, a member of the Ras oncogene family (miR-33-3p), vesicle-associated membrane protein 2 (Vamp2) (miR-34c-5p), Ras-related 2 (Rras2) (miR-34c-5p and miR-124-5p), heterogeneous nuclear ribonucleoprotein F (Hnrnpf) (miR-124-5p) Myrf, and engulfment and cell motility 1 (Elmo1) (miR-145-5p) were significantly downregulated against both controls (Figure 8A; Supplementary Figure S5A). Note that Vamp2 and Rras2 were predicted in silico by three databases in rats but by only 2 or fewer in humans. For miR-34c-5p, Rras2 was not significantly downregulated against miR-NC in RNA sequencing, but it was on independent RT-qPCR analysis. Furthermore, on independent RT-qPCR analysis, neurotrophic receptor tyrosine kinase 2 (Ntrk2) (miR-33-3p), A-kinase anchoring protein 13 (Akap13), cytoplasmic polyadenylation element binding protein 1 (Cpeb1), and Erbb receptor feedback inhibitor 1 (Errfi1) (miR-214-3p) were significantly downregulated against miR-NC only, but their expression was also significantly upregulated by miR-NC against the differentiation vehicle control, except for Ntrk2. Notably, Akap13 showed a tendency toward downregulation against the differentiation vehicle control (Figure 8A; Supplementary Figure S5A). Finally, protein tyrosine phosphatase receptor type J (Ptprj) (miR-214-3p) was not significantly downregulated against neither of the controls in RT-qPCR, although it was in RNA sequencing (Supplementary Figure S5A).
Figure 8. Potential mRNA targets of each microRNA verified in RT-qPCR. (A) This dot plot shows the fold change (FC) of the relative expression of potential mRNA targets of each microRNA as labeled on the y-axis, to the differentiation vehicle control (DIFF VehCo) and the microRNA mimic negative control (miR-NC), resulting from the single transfection of each microRNA mimic in CG-4 cells in differentiation culture conditions. The color of each dot represents the fold change (expressed in logarithm base 2 [Log2(FC)]) of the relative expression, scaled by a blue-to-yellow color gradient from −1 to 0.5 (blue corresponding to a negative fold change, yellow to a positive), and its size represents the adjusted p-value (padj) (expressed as minus logarithm base 10 [−Log10(padj)]) as indicated in the plot legend. The adjusted p-value was calculated by Dunn’s or Dunnett’s multiple comparison test to each control separately, i.e., the differentiation vehicle control and miR-NC, as recommended following a parametric/non-parametric one-way ANOVA on all conditions, including the proliferation vehicle control (not shown). Only the significant data are depicted; thus, missing dots correspond to non-significant data. −Log10(padj) ≥1.3 corresponds to the significance level of p ≤ 0.05, −Log10(padj) of 2.0 corresponds to p = 0.01, −Log10(padj) of 3.0 to p = 0.001, and −Log10(padj) of 4.0 to p = 0.0001. Data were from three experiments with each condition in triplicate. The corresponding bar plots showing both the statistically significant and non-significant results can be found in Supplementary Figure S5A. (B) The plots show the relative expression (mean with SD of 2−ΔΔCt) of Eif4e and Rab10 to the differentiation vehicle control (DIFF VehCo, gray bar), resulting from the sequential transfection of miR-33-3p mimic followed (black bar) or not (white bar) by its inhibitor (as labeled on the x-axis) in CG-4 cells in differentiation culture conditions, as well as the proliferation vehicle control (PROL VehCo, gray bar). The dotted line represents the mean relative expression of the differentiation vehicle control to which the relative expression (2−ΔΔCt) of each sample was calculated. The adjusted p-value was calculated by Dunnett’s multiple comparison test to the differentiation vehicle control (*) and by Sidak’s multiple comparison test between the microRNA mimic and its inhibitor (#), as recommended following a parametric one-way ANOVA on all conditions: */# for p ≤ 0.05, ** for p ≤ 0.01, *** for p ≤ 0.001, **** for p ≤ 0.0001. Data were from three experiments with each condition in triplicate. L2K, Lipofectamine™ 2000; SD, standard deviation.
The downregulation of these predicted targets was also corroborated by the sequential transfection of the microRNA mimic followed by a mock transfection, except for the miR-145-5p target Elmo1 (Supplementary Figure S5B). However, only the expression of Eif4e and Rab10 was significantly antagonized by the microRNA inhibitor compared to the miR-33-3p mimic (Figure 8B). For all the other investigated predicted targets, the microRNA inhibitor slightly, but non-significantly, tended to reverse or did not change the target’s expression level against its corresponding mimic (Supplementary Figure S5B).
Regarding miR-34c-5p, Notch receptor 1 (Notch1) and platelet-derived growth factor receptor A (Pdgfra) were targets predicted by both strategies. However, this was not in favor of the phenotype observed in miR-34c-5p-transfected CG-4 cells, as both Notch1 and Pdgfra support OPC proliferation and are expected to decrease during differentiation. Their downregulation by miR-34c-5p was verified by RNA sequencing and RT-qPCR analysis on three independent experiments (Figure 6C; Supplementary Figure S5A).
4 DiscussionWe investigated the effect of 13 microRNAs previously identified as dysregulated in relapsing and/or remitting MS (Perdaens et al., 2020) on the differentiation of an OPC cell line called CG-4. Most of the screened microRNAs decreased OPC differentiation, while Dicer ablation in mice, which impedes microRNA maturation, markedly affects myelination, thereby suggesting that microRNAs would rather promote differentiation by inhibiting OPC proliferation (Dugas et al., 2010; Zhao et al., 2010; Emery and Lu, 2015). miR-146a-5p and miR-155-5p, for instance, two widely acknowledged microRNAs in MS, downregulated Mbp expression in our experimental setting. Unexpectedly, both the administration of exogenous miR-146a-5p as well as its knockout in mice improved cuprizone demyelination and/or EAE by promoting an anti-inflammatory phenotype of microglia/macrophages or reducing microglial/macrophagic infiltration in the corpus callosum, respectively, as well as increasing OPC differentiation and myelination (Zhang J. et al., 2017; Martin et al., 2018; Zha
留言 (0)